
Abstract
Background
Low back pain (LBP) is one of the most common musculoskeletal complaints and considered as the most disabling condition among general population. Magnetic resonance imaging (MRI) is the preferred modality in imaging of LBP. Diffusion tensor imaging (DTI) is a version of MRI that can detect tissue microstructure changes occurring in different pathologies. The commonly used parameters are fractional anisotropy (FA) and mean diffusivity (MD). We aimed in this study to evaluate the role of DTI in the assessment of back muscles in young adults with chronic LBP with no major neurological or orthopedic disorders.
Results
There was a statistically significant difference in MD values of back muscles between patients and control groups. At the ROC curve, for psoas muscle, the AUC was 0.906 with a cutoff point of 0.951. Sensitivity and specificity were 89.2% and 90.9% with accuracy 89.8%. For multifidus muscle, the AUC was 0.919 with a cutoff point of 1.29. Sensitivity and specificity were 91.9% and 90.9% with accuracy 91.4%. For erector spinae muscle, the AUC was 0.834 with a cutoff point of 1.224. Sensitivity and specificity were 81.1% and 72.7% with accuracy 77.9%. There was a statistically significant difference in FA values of back muscles between the patients and control groups. At the ROC curve, for psoas muscle, the AUC was 0.840 with a cutoff point of 0.546. Sensitivity and specificity were 81.1% and 72.7% with accuracy 77.97%. For multifidus muscle, the AUC was 0.875 with a cutoff point of 0.415. Sensitivity and specificity were 81.1% and 90.9% with accuracy 84.7%. For erector spinae muscle, the AUC was 0.805 with a cutoff point of 0.437. Sensitivity and specificity were 81.1% and 77.3% with accuracy 79.7%.
Conclusions
DTI is a valuable promising noninvasive tool in the assessment of back muscles quality in patient with chronic low back pain, with no detected neurological or orthopedic pathologies. This is due to its sensitivity to microscopic intracellular changes that could not be detected on conventional imaging, allowing better tissue characterization.
Background
Low back pain (LBP) is a widespread musculoskeletal (MSK) ailment, affecting about 65%-85% of the general population [1,2,3]. The World Health Organization (WHO) declared that most of handicap** diseases are those affecting the MSK [4,5,6]. The diagnosis of chronic low back pain is made if the complaint lasted beyond 7–12 weeks or if it took more than expected for an acute condition [7].
Various imaging modalities are used in the diagnosis of LBP. Ultrasonography (US) is considered the most limited. Computed tomography (CT) has the risk of ionizing radiation. Magnetic resonance imaging (MRI) is the preferred imaging technique due to the ability to measure the volume of the muscle, its fat fraction, deposition of fibrotic tissue and diffusion restriction. All of these measures are related to the muscle microstructure [8,9,10].
Diffusion tensor imaging (DTI) has proved its superiority in the demonstration of alterations in the muscle microstructures which occur in various diseases [11,12,13]. Fractional anisotropy (FA) and mean diffusivity (MD) are the main diagnostic DTI parameters used in detecting changes in isotropic/anisotropic water molecule diffusion which occur in different pathologies [14, 15]. However, these changes are not disease-specific limiting DTI role so far [16, 17].
The structure of the lumbar spine (LS) has contributed to the occurrence and worseness of LBP [18,19,20]. Stability and posture maintenance are essentially maintained by the back muscles. Chronic LBP is usually associated with lumbar instability which can result in more back muscles injury. Aging and back muscles injury along with posture changes have been linked with muscular degeneration [2, 19, 20].
Paraspinal muscles cross-sectional area (CSA) has been investigated by multiple systematic reviews which declared the association between paraspinal muscles changes and LBP [21,22,23]. Muscle performance capacity has shown considerable dependance on microstructural variations which can result in decreased power of contraction and increased muscle rigidity. Such matrix changes have been noticed with increased volume of the extra-cellular matrix (e.g., fibrosis) [2, 10, 12, 24].
Skeletal muscle microstructure is highly organized hierarchically. It is formed of multiple layers of muscle fiber columns wrapped by connective tissue. Active and passive muscle forces are largely dependent on cellular and extra-cellular muscle constituents. Since muscle fiber sarcolemma hinders free passage of the moving water molecules, one can deduce that water molecular diffusion has longitudinal not radial arrangement [2, 25, 26].
Methods
-
Institutional Review Board (IRB) approval was obtained for our prospective study, and informed contests were taken from all the patients and controls.
-
The study enclosed 59 young adult patients. They were divided into two groups. The first is the patient group. It included 37 patients (31 females and six males, whose ages were between 18 and 39 years, mean 30.03 ± 6.56). The second is the control group. It included 22 controls (17 females and five males, age ranged from 19 to 39 years, mean 28.86 ± 5.66). All patients underwent MR examination with DTI.
-
Patients were referred from Mansoura University Hospitals orthopedic department clinics in the period from June 2018 to June 2019.
Inclusion criteria
-
Young adult with chronic low back pain with no major neurological or orthopedic disorders (based on Erikson’s research, the young adult age ranges from 19 to 39).
Exclusion criteria
General contra-indications for MRI scans, like: Patients with cardiac pacemaker or cochlear implant. Patients with ocular metallic foreign body. Patients with bad general conditions. Claustrophobic patients.
-
Patients with major neurological and orthopedic causes of chronic low back pain.
Technique and image acquisition
-
The study was held in MRI unit in our department.
-
The MR examinations were done using 1.5 Tesla scanner (Ingenia, Philips Medical Systems, Best Netherlands).
-
Body coil was utilized.
-
Participants were positioned supine in the magnetic bore.
-
Routine MRI sequences were obtained. First; sagittal and axial T1-weighted images (TR/TE = 500/20 ms) and T2-weighted images (TR/TE = 4000/120 ms) of the back muscles from the most cranial aspect of the first sacral vertebral body (S1) to the most cranial aspect of the first lumbar vertebral body (L1). The DTI was also done with a single-shot echo-planar sequences (TR/TE = 3118/93 ms) with sensitivity encoding (SENSE). The diffusion gradients were applied along 32 axes, using a b value of 0 and 1000 s/mm2. FOV = 24–28 cm and data matrix = 92 × 88 were used, leading to voxel dimensions (2.43 × 2.54 × 2.5 mm). Slice thickness of 2.5 mm, no gap and total scan time = 7–8 min.
Image interpretation and post-processing
-
DICOM format was used to store images for processing.
-
DICOM images were transferred to workstation (extended MR Workspace 2.6.3.5, Philips Medical Systems, Best Netherlands B.V) supplied by the vendor.
-
Eddy current artifacts were eliminated by automated registration of the DTI data.
-
Metrics were measured within the back muscles using multiple ROI method. Each ROI was applied manually to each muscle at the previously detected level with no fixed surface area (its surface area depends on the muscle cross-sectional area) (Fig. 1).
Fig. 1 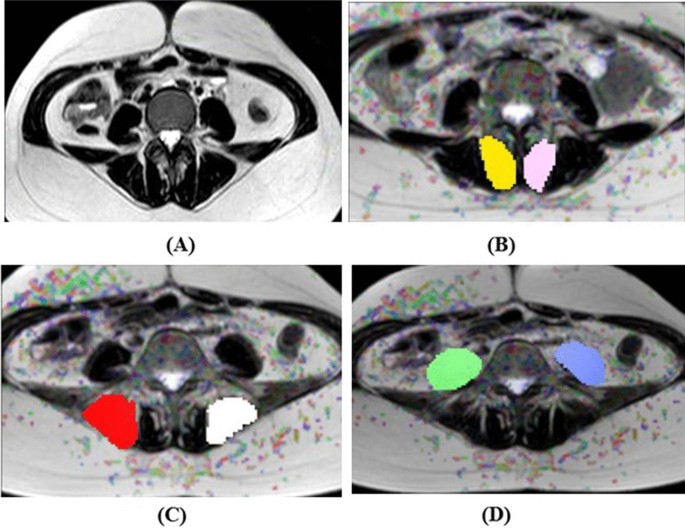
A 21-year-old female patient presented clinically with chronic low back pain with no detected neurological or orthopedic pathology. A T2WI with no measures. B DTI measures of the multifidus muscle {FA = 0.4 and MD = 1.24 × 10⁻³ mm2/s}. C DTI measures of the erector spinae muscle {FA = 0.47 and MD = 1.03 × 10⁻³ mm2/s}. D DTI measures of the psoas muscle {FA = 0.55 and MD = 0.93 × 10⁻³ mm2/s}…generally there is increase in the FA value and decrease in MD value of the measured muscles
-
The FA and MD values were measured (by only one reader ST with 22 years of experience in MR imaging) within three muscles (multifidus muscle, erector spinae muscle and psoas muscle) bilaterally at three levels L1, L3 and L5, then the mean value was obtained for each muscle.
-
Statistical analysis was assessed by the final FA and MD values.

Statistical analysis
-
Statistical analyses of our data were based on Statistical Package for the Social Sciences (SPSS, Chicago, IL) version 22 program. Quantitative data were represented by the mean and standard deviation (SD). For both patients and control groups, the mean and standard deviation of FA and MD at regions of interest were calculated. Comparison between normally distributed data in the three groups was done by independent samples t-test. Mann–Whitney test was used in comparing data which were discordant with the normality assumptions. Statistically significant probability (P) values are considered when they were less than 0.05. Diagnostic capability of the FA and MD in differentiating patients from controls was assessed by the receiver operating characteristic (ROC) curve through calculation of area under the curve (AUC) together with the accuracy, sensitivity and specificity.
Results
In this study, the role of DTI is evaluated in the assessment of back muscles in young adults having chronic LBP with no major neurological or orthopedic disorders. The total number of patients and controls included in the study was 59. They were 11 males and 48 females. The mean age of the included patients was 30.03 +/− 6.56 years and that of the control group was 28.86 +/− 5.66 years. They were divided into early (from 18 to 29 years) and late (from 30 to 39 years) young adults. The early young adult control group included nine persons which represented 40.9% of the control group, and the early young adult patient group included 20 patients which represented 54.1% of the patient group. The late young adult control group included 13 persons which represented 59.1% of the control group, and the late young adult patient group included 17 patients which represented 45.9% of the patient group. We noticed that there was significant increased incidence of chronic unexplained LBP among females than males (31 females and six males).
The MD of the psoas muscle in patients group was 0.699 ± 0.26 × 10⁻³ mm2/s and in control group was 1.113 ± 0.238 × 10⁻³ mm2/s (Table 1). The MD value showed a statistically significant difference between the patients and control groups (p < 0.001). The AUC of the MD value used to differentiate patients from control using the ROC curve, Fig. 2, was 0.906 with a cutoff point of 0.951. Sensitivity and specificity were 89.2% and 90.9% with accuracy 89.8% (Table 2). The FA of the psoas muscle in patients group was 0.680 +/− 0.167 and in control group was 0.536 +/− 0.101 (Table 1). FA value showed a statistically significant difference between the patient and control groups (p < 0.001). At the ROC curve, Fig. 3, the AUC of the FA value used to differentiate patients from control group was 0.840 with a cutoff point of 0.546. Sensitivity and specificity were 81.1% and 72.7% with accuracy 77.97% (Table 2).

ROC curve of MD. Diagonal segments are produced by ties

ROC curve of FA. Diagonal segments are produced by ties
The MD of the multifidus muscle in patients group was 0.931 +/− 0.331 and in control group was 1.33 +/− 0.20 (Table 1). MD value was statistically different in the patients and control groups (p < 0.001). At the ROC curve, the AUC of the MD value used to differentiate patients from control was 0.919 with a cutoff point of 1.29. Sensitivity and specificity were 91.9% and 90.9% with accuracy 91.4% (Table 2). The FA of the multifidus muscle in patients group was 0.518 +/− 0.136 and in control group was 0.392 +/− 0.09 (Table 1). MD value showed a statistically significant difference between the cases and control groups (p < 0.001). At the ROC curve, the AUC of the FA value used to discriminate patients from control was 0.875 with a cutoff point of 0.415. Sensitivity and specificity were 81.1% and 90.9% with accuracy 84.7% (Table 2).
The MD of erector spinae muscle in patients group was 0.941 +/− 0.318 and in control group was 1.324 +/− 0.202 (Table 1). MD value showed a statistically significant difference between the patients and control groups (p < 0.001). At the ROC curve, the AUC of the MD value used to differentiate patients from control was 0.834 with a cutoff point of 1.224. Sensitivity and specificity were 81.1% and 72.7% with accuracy 77.9% (Table 2). The FA of erector spinae muscle in patients group was 0.544 +/− 0.11 and in control group was 0.415 +/− 0.085 (Table 1). There was a statistically significant difference in the MD value between the patients and control groups (p < 0.001). At the ROC curve, the AUC of the FA value used to discriminate patients from control was 0.805 with a cutoff point of 0.437. Sensitivity and specificity were 81.1% and 77.3% with accuracy 79.7% (Table 2).
Discussion
The second leading cause of manpower loss and decreased human productivity all over the world is LBP. It has been reported that during any period of life, 80% of the general population experience LBP. It is usually chronic and progresses in an undulating pattern [26, 27]. It was reported that in 90% of patients with acute LBP, a second attack of pain was reported in the 1st year by 69% of the cases. Though the etiology of recurrence is still unknown, affection of the back muscles is considered an important cause [28, 29]. Countless data about the volume and characteristics of back muscles in patients with LBP were published recently. Microscopic assessment of the back muscles of patients and healthy subjects found changes in the formulation in patients with chronic LBP [21, 28].
The aim of this study was to assess the role of DTI in the evaluation of back muscles in cases with chronic low back pain in young adults with no major neurological or orthopedic disorders.
In our study, the role of DTI was assessed in the evaluation of back muscles in young adults having long-standing LBP with no major neurological or orthopedic disorders, and we found that there was significant increased distribution of chronic unexplained LBP among females compared to males (31 females and six males). This showed agreement with the results of Goubert et al. [30] concerning the complaint of chronic LBP and its relation to sex. As this study reported increased incidence of chronic LBP in females more than males, mostly in the child-bearing period. This is suggested to be due to the hormonal changes causing increase fat content of the back muscles resulting in weak muscles and LBP, as mentioned by Nayak et al. [31].
DTI is an MRI sequence that can measure the water molecule Brownian movement in different tissues with microstructure anisotropy. The presence of sarcolemma around the muscle fiber is considered the initial boundary to isotropic diffusion of the water molecule, preventing its radial diffusion across the muscle fibers. So, DTI is considered the most sensitive imaging modality in revealing alterations in the quality of the muscle structural units [32, 33]. Few literatures studied the value of DTI in assessment of the unexplained chronic LBP. In our study, MD and FA have significant values in detecting the quality of the back muscles in patients with chronic unexplained LBP. MD and FA values of the psoas, multifidus and erector spinae muscles were significant predictors of measuring the quality of the muscles. In the current study, the FA of the patients shows increased value compared to the control group, and the MD value of the patients group shows decreased value compared to the control group. This was concordant with the studies of Oudeman et al. [34] who have the same results, and this could be explained by increased fatty infiltration of the muscles resulting in decreased MD and increased FA values.
Inverse relation between FA and fiber cross-sectional area was found in the present study that means reduction of muscle fiber cross-sectional area leads to increased FA…while the cross-sectional area of the muscle fibers is directly related to its isometric force. So, increased FA is an indicator for decreased muscle fiber area together with its isometric force (i.e., the muscle is weaker), and this was in agreement with the results of McKinnon et al. [35], Sions et al. [26], Berry et al. [36] and Franchi et al. [37].
An important finding about muscle structure was found in this study; the muscle quality was found to be significant predictor of chronic unexplained LBP. This finding suggests that the back muscles (multifidus, erector spinae and psoas) act as the main spine stabilizers and have vital contribution to the maintenance of lumbar posture. The muscle volume was directly correlated with its efficacy, and the muscle microstructure was found to be a better indicator of muscle force, and this is co** with the conclusions of Sions et al. [38], Crawford et al. [39] and Wilhelm [40].
On a clinical basis, the findings in this study are significant because they suggest that microstructural quality of the lumbar muscles detected by the measured DTI parameters (MD and FA) which is more important than the muscle volume when assessing the whole lumbar posture with overload. This shows agreement with Berry et al. [36], Klupp et al. [41] and Nayak et al. [31] who found that the minor changes in the quality of the muscle structure decreasing their quality and their efficacy to do their function leading to LBP.
Non-contractile tissues, such as fat and fibrous tissues, affect measurement of the whole muscle size and quality. In agreement with Klupp et al. [41] and Nayak et al. [31], we found that FA can be a noninvasive measurement method of the contractile muscle tissue function (counting healthy muscle fibers relative to fat and fibrous tissue in a whole muscle), and it also can provide an explanation of how the axial load leads to different postural responses.
Our study revealed that increased amount of fat deposited in muscles of the back in the patients group resulted in alteration in muscle quality, force along with changes in DTI parameters (increased FA and decreased MD values) in psoas muscle, multifidus and erector spinae muscles when compared to the control group.
Study limitations
The restrictions of our study could be summarized in the limited number of patients with the absence of follow-up DTI. So, further studies should be done using large number of patients with follow-up DTI. Also, DTI tractography can be added to MRI examination, it will be of value in verification of findings. Higher Tesla scanners also will be of great values with application of advanced post-processing DTI that will give better results.
Conclusions
DTI is a valuable promising noninvasive tool in evaluation of quality of muscles of the back quality in patient with long-standing LBP, with no detected neurological or orthopedic pathologies. This is due to its sensitivity to microscopic intracellular changes that could not be detected on conventional imaging, allowing better tissue characterization. We recommend adding DTI to the routine lumbar spine MRI scan in chronic LBP patients.
Availability of data and materials
Due to privacy regulations, the clinical data collected in this study are not deposited in a public registry, but the data can be made available via a request to the corresponding author.
Abbreviations
- AUC:
-
Area under the curve
- CSA:
-
Cross-sectional anatomy
- CT:
-
Computed tomography
- DTI:
-
Diffusion tensor imaging
- FA:
-
Fractional anisotropy
- LBP:
-
Low back pain
- MD:
-
Mean diffusivity
- MRI:
-
Magnetic resonance imaging
- MSK:
-
Musculoskeletal
- ROC:
-
Receiver operating characteristic
- SD:
-
Standard deviation
- US:
-
Ultrasonography
- WHO:
-
World Health Organization
References
Wáng YXJ, Wáng JQ, Káplár Z (2016) Increased low back pain prevalence in females than in males after menopause age: evidences based on synthetic literature review. Quant Imaging Med Surg 6(2):199
Berry DB (2017) Non-invasive measurements of muscle microstructure using diffusion tensor imaging in active-duty marines. Doctoral thesis, California University. California. https://escholarship.org/uc/item/66g6368n
Morris LD, Daniels KJ, Ganguli B et al (2018) An update on the prevalence of low back pain in Africa: a systematic review and meta-analyses. BMC Musculoskelet Disord 19(1):1–15
Palazzo C, Ravaud JF, Papelard A et al (2014) The burden of musculoskeletal conditions. PLoS ONE 9(3):e90633
Briggs AM, Cross MJ, Hoy DG et al (2016) Musculoskeletal health conditions represent a global threat to healthy aging: a report for the 2015 World Health Organization world report on ageing and health. The Gerontologist 56(S-2):S243–S255
Tousignant-Laflamme Y, Martel MO, Joshi AB et al (2017) Rehabilitation management of low back pain-it’s time to pull it all together! J Pain Res 10:2373–2385
Bento TPF, dos Santos Genebra CV et al (2020) Low back pain and some associated factors: Is there any difference between genders? Braz J Phys Ther 24(1):79–87
Ranson CA, Burnett AF, Kerslake R et al (2006) An investigation into the use of MR imaging to determine the functional cross-sectional area of lumbar paraspinal muscles. Eur Spine J 15(6):764–773
Chan ST, Fung PK, Ng NY et al (2012) Dynamic changes of elasticity, cross-sectional area, and fat infiltration of multifidus at different postures in men with chronic low back pain. Spine J 12(5):381–388. https://doi.org/10.1016/j.spinee.2011.12.004
Crawford RJ, Filli L, Elliott JM et al (2016) Age and level dependence of fatty infiltration in lumbar paravertebral muscles of healthy volunteers. Am J Neuroradiol 37(4):742–748. https://doi.org/10.3174/ajnr.A4596
Rodríguez-Soto AE, Jaworski R, Jensen A et al (2013) Effect of load carriage on lumbar spine kinematics. Spine 38(13):E783–E791
Strijkers GJ, Araujo EC, Azzabou N et al (2019) Exploration of new contrasts, targets, and MR imaging and spectroscopy techniques for neuromuscular disease-a workshop report of working group 3 of the biomedicine and molecular biosciences COST action BM1304 MYO-MRI. J Neuromusc Dis 6(1):1–30
Bernsen MR, van Straten M, Kotek G et al (2020) Computed tomography and magnetic resonance in imaging molecular imaging in oncology. Rec Results Cancer Res (216), 2nd ed. Springer, pp 31–110
Tae WS, Ham BJ, Pyun SB et al (2018) Current clinical applications of diffusion-tensor imaging in neurological disorders. J Clin Neurol 14:129–140
Abdel Razek AAK, Taman SE, Ezz El Regal M et al (2020) Diffusion tensor imaging of microstructural changes in the gray and white matter in patients with Crigler–Najjar Syndrome Type I. J Comput Assist Tomogr 44(3):393–398
Marsh RM (2007) Using in vivo diffusion-weighted MRI to quantify treatment response in murine tumors. Doctoral thesis, Texas University. School of Biomedical Sciences at Houston. https://www.proquest.com/docview/304706029
Froeling M, Oudeman J, Strijkers GJ et al (2014) Muscle changes detected with diffusion-tensor imaging after long-distance running. Radiology 274(2):548–562
Endean A, Palmer KT, Coggon D (2011) Potential of MRI findings to refine case definition for mechanical low back pain in epidemiological studies: a systematic review. Spine 36(2):160
Ranger TA, Cicuttini FM, Jensen TS et al (2017) Are the size and composition of the paraspinal muscles associated with low back pain? A systematic review. Spine J 17(11):1729–1748
Romeo V, Covello M, Salvatore E et al (2019) High prevalence of spinal magnetic resonance imaging findings in asymptomatic young adults (18–22 Yrs) candidate to air force flight. Spine 44(12):872–878
Hodges PW, Danneels L (2019) Changes in structure and function of the back muscles in low back pain: different time points, observations, and mechanisms. J Orthopaed Sports Phys Therapy 49(6):464–476
Mäki T, Oura P, Paananen M et al (2019) Longitudinal analysis of paraspinal muscle cross-sectional area during early adulthood, a 10-year follow-up MRI study. Sci Rep 9(1):1–8
Sipaviciene S, Kliziene I (2020) Effect of different exercise programs on non-specific chronic low back pain and disability in people who perform sedentary work. Clin Biomech 73:17–27
Teklemariam A (2016) A finite element approach to study skeletal muscle tissue. Doctoral thesis, Manchester University. Manchester. https://e-space.mmu.ac.uk/id/eprint/617509
Adam CJ (2017) Multiscale modelling and simulation of musculoskeletal tissues for orthopaedics. In: Li Q, Mai YW (eds) Biomaterials for implants and scaffolds (Springer Series in biomaterials science and engineering, vol 8. Springer, pp 1–44
Sions JM, Coyle PC, Velasco TO et al (2017) Multifidi muscle characteristics and physical function among older adults with and without chronic low back pain. Arch Phys Med Rehabil 98(1):51–57
Morgan E, Edomwonyi E, Okwumezie C et al (2019) A review of the current management of low back pain. J Res Basic Clin Sci 1(2):122–129
Lintang TDP, Rahardjo P, Setiawati R (2020) MRI evaluation of paraspinal muscle fatty infiltration in low back pain patients. Int J Res Publ 59(1):34–49
Barr KP, Standaert CJ, Johnson SC et al (2021) Low back disorders. In: Braddom's physical medicine and rehabilitation, 6th ed, vol 4. Elsevier, pp 651–689.e659
Goubert D, Van Oosterwijck J, Meeus M et al (2016) Structural changes of lumbar muscles in non-specific low back pain. Pain Phys 19(7):E985–E999
Nayak K, Lakshmikanth H, Kotian RP et al (2021) A diffusion tensor imaging study to compare normative fractional anisotropy values at the lumbar spine with patients suffering from low back pain. Ann Roman Soc Cell Biol 25(2):4565–4570
Liang W, Han B, Hai Y et al (2021) Diffusion tensor imaging with fiber tracking provides a valuable quantitative and clinical evaluation for compressed lumbosacral nerve roots: a systematic review and meta-analysis. Eur Spine J 30(4):818–828
Berry DB, Englund EK, Galinsky V et al (2021) Varying diffusion time to discriminate between simulated skeletal muscle injury models using stimulated echo diffusion tensor imaging. Magn Reson Med 85(5):2524–2536
Oudeman J, Nederveen AJ, Strijkers GJ et al (2016) Techniques and applications of skeletal muscle diffusion tensor imaging: a review. J Magn Reson Imaging 43(4):773–788
McKinnon NB, Connelly DM, Rice CL et al (2017) Neuromuscular contributions to the age-related reduction in muscle power: mechanisms and potential role of high velocity power training. Ageing Res Rev 35:147–154
Berry DB, Shahidi B, Rodríguez-Soto AE et al (2018) Lumbar muscle structure predicts operational postures in active-duty marines. J Orthopaed Sports Phys Therapy 48(8):613–621
Franchi MV, Raiteri BJ, Longo S et al (2018) Muscle architecture assessment: strengths, shortcomings and new frontiers of in vivo imaging techniques. Ultrasound Med Biol 44(12):2492–2504
Sions JM, Elliott JM, Pohlig RT et al (2017) Trunk muscle characteristics of the multifidi, erector spinae, psoas, and quadratus lumborum in older adults with and without chronic low back pain. J Orthopaed Sports Phys Therapy 47(3):173–179
Crawford RJ, Cornwall J, Abbott R et al (2017) Manually defining regions of interest when quantifying paravertebral muscles fatty infiltration from axial magnetic resonance imaging: a proposed method for the lumbar spine with anatomical cross-reference. BMC Musculoskelet Disord 18(1):1–11
Wilhelm M (2019) The effect of low back pain history on multifidus co-contraction during common lumbosacral voluntary stabilizing contractions. Doctoral thesis, Texas University, Austin. https://ttu-ir.tdl.org/bitstream/handle/2346/86961
Klupp E, Cervantes B, Schlaeger S et al (2019) Paraspinal muscle DTI metrics predict muscle strength. J Magn Reson Imaging 50(3):816–823
Acknowledgements
Not applicable.
Funding
No funding was obtained for this study.
Author information
Authors and Affiliations
Contributions
MS, RA, AS and ST are guarantor of integrity of the entire study. MS and ST helped in study concept and design. ST, AS and RA helped in clinical studies. ST and RA helped in experimental studies/data analysis, ST and RA helped in statistical analysis, ST and RA worked in manuscript preparation and MS and ST worked in manuscript editing. All authors read and approved the final manuscript.
Corresponding author
Ethics declarations
Ethics approval and consent to participate
This study had approval from the Institutional Review Board of Mansoura Faculty of Medicine on May 2018. Ethics committee’s reference number (MS.18.05.134). Written informed consent was obtained from all patients.
Consent for publication
A written consent to publish this information was obtained from study participants.
Competing interests
The authors declare that they have no competing interests and no relationships with any companies, whose products or services may be related to the subject matter of the article.
Additional information
Publisher's Note
Springer Nature remains neutral with regard to jurisdictional claims in published maps and institutional affiliations.
Rights and permissions
Open Access This article is licensed under a Creative Commons Attribution 4.0 International License, which permits use, sharing, adaptation, distribution and reproduction in any medium or format, as long as you give appropriate credit to the original author(s) and the source, provide a link to the Creative Commons licence, and indicate if changes were made. The images or other third party material in this article are included in the article's Creative Commons licence, unless indicated otherwise in a credit line to the material. If material is not included in the article's Creative Commons licence and your intended use is not permitted by statutory regulation or exceeds the permitted use, you will need to obtain permission directly from the copyright holder. To view a copy of this licence, visit http://creativecommons.org/licenses/by/4.0/.
About this article

Cite this article
Shady, M.M., Abd El-Rahman, R.M., Saied, A.M.M. et al. Role of magnetic resonance diffusion tensor imaging in assessment of back muscles in young adults with chronic low back pain. Egypt J Radiol Nucl Med 54, 143 (2023). https://doi.org/10.1186/s43055-023-01090-1
Received:
Accepted:
Published:
DOI: https://doi.org/10.1186/s43055-023-01090-1