
Abstract
Background
In this study, we present a NGS-based panel designed for sequencing 1993 SNP loci for forensic DNA investigation. This panel addresses unique challenges encountered in forensic practice and allows for a comprehensive population genetic study of the Chinese Korean ethnic group. To achieve this, we combine our results with datasets from the 1000 Genomes Project and the Human Genome Diversity Panel.
Results
We demonstrate that this panel is a reliable tool for individual identification and parentage testing, even when dealing with degraded DNA samples featuring exceedingly low SNP detection rates. The performance of this panel for complex kinship determinations, such as half-sibling and grandparent-grandchild scenarios, is also validated by various kinship simulations. Population genetic studies indicate that this panel can uncover population substructures on both global and regional scales. Notably, the Han population can be distinguished from the ethnic minorities in the northern and southern regions of East Asia, suggesting its potential for regional ancestry inference. Furthermore, we highlight that the Chinese Korean ethnic group, along with various Han populations from different regional areas and certain northern ethnic minorities (Daur, Tujia, Japanese, Mongolian, **bo), exhibit a higher degree of genetic affinities when examined from a genomic perspective.
Conclusion
This study provides convincing evidence that the NGS-based panel can serve as a reliable tool for various forensic applications. Moreover, it has helped to enhance our knowledge about the genetic landscape of the Chinese Korean ethnic group.
Background
In recent decades, short tandem repeats (STRs) have emerged as highly efficient and well-established DNA markers in forensic analyses because of their high genetic polymorphisms, particularly for individual identification and parentage testing cases [1, 2]. The prevailing method for STR genoty** is polymerase chain reaction (PCR)-based capillary electrophoresis (CE) profiling due to its great convenience and cost-effectiveness [3, 4]. However, challenges persist in CE-based STR profiling when dealing with highly degraded, mixed and low-templated DNA in complex cases [5, 6]. These challenges encompass several aspects: (1) it is difficult to determine the minor contributor’s DNA genotype in mixed samples using CE, especially when the ratio of the minor to major donor DNA is lower than 1:10 [7]; (2) the STR loci exhibit poor performance when applied to highly degraded DNA (< 50 bp) because they rely on amplifying large target regions; (3) when STR ty** is performed on low-template DNA, there is a heightened risk of unbalanced amplification of STR alleles, as well as the occurrence of random allele drop-out or allele drop-in. Therefore, to further enhance the efficacy of DNA analyses in forensic investigations, there are still many challenges that need to be addressed by forensic scientists. Fortunately, the advent of sequencing technologies has greatly broadened the scope and depth of applications in forensic DNA investigation, transitioning from low-throughput of a limited number of genetic markers to high-throughput sequencing of tens of thousands of genetic markers. This expanded capacity presents novel avenues for resolving intricate forensic scenarios [8, 20]. Subjects found to be biologically related were excluded. Peripheral blood samples of these participants were collected after they were made aware of the purpose of this study and signed the written informed consent. To better preserve the samples, we prepared bloodstains by applying a portion of peripheral blood (about 200 μL) to FTA cards.
DNA extraction, library preparation, and variants calling
DNA of the 161 Chinese Koreans was extracted from bloodstains on FTA cards using the Magbead Blood Spots DNA Kit from CWBIO in Bei**g, China, following the manufacturer's instructions. The MGIEasy Pa-SNPs panel (MGI, Shenzhen, China) was used to prepare the libraries. We added 10 ng of DNA to a centrifuge tube and mixed it with Elution Buffer to make a final volume of 20.5 μL for the experiment. The library preparation process involved two rounds of PCR, which has been detailed explained in a previous study [21]. Following the two rounds of PCR, the products of the second round PCR were cleaned up using DNA Clean Beads, following the manufacturer's instructions. We used the Qubit® dsDNA HS Assay Kit on a Qubit® 4.0 Fluorometer (Thermo Fisher Scientific, Waltham, USA) to determine the quality of purified PCR products. The second-step PCR products needed to have a concentration of at least 5 ng/μL, and the purified products were required to have a final size distribution of 140 to 180 bp for subsequent DNA sequencing.
DNA nanoballs were prepared according to the manufacturer’s instructions with the final concentration being ≥ 8 ng/μL. Then, DNB sequencing was conducted on the MGISEQ-2000RS platform, configured with FCL SE50 + 10 settings. We used the SoaPnuke2 software to analyze the raw data. All reads were aligned to hs37d5 reference sequences using Burrows-Wheeler Aligner software. SNP genotypes were called using the Freebayes software (http://clavius.bc.edu/~erik/freebayes/).
Forensic application estimations
We used the STRAF (version 2.1) software [22] to calculate various descriptive statistical parameters, including probability of match (PM), power of discrimination (PD), probability of exclusion (PE), observed heterozygosity (Hobs) and genetic diversity (GD). Besides, the Hardy–Weinberg equilibrium (HWE) test for each SNP locus were also estimated using both PLINK and STRAF, adjusting the p (p > 0.000025) values for HWE tests following Bonferroni’s correction. The linkage disequilibrium (LD) tests among pairwise SNP loci were assessed using the Haploview (version 2.1) software [23], with LD determined at a r2 > 0.2. These parameters were used to evaluate the genetic diversities of the 1993 SNPs in the Chinese Korean ethnic group. Additionally, we computed the cumulative probability of discrimination (CPD) values and the cumulative probability of exclusion (CPE) values to confirm the effectiveness of this new panel for individual identification and parentage testing. We used the Familias (version 3.01) software [24] to simulate pairwise relationship tests in parent–child (PC), full-sibling (FS), half-sibling (HS) and grandparent-grandchild (GG) cases in the Chinese Korean ethnic group. The likelihood ratios (LRs) for each kinship hypothesis (H1) compared to the values for the unrelated hypothesis (H2) were calculated and compared. We used the allele frequencies of the SNPs in the Chinese Korean ethnic group to simulate genotype data for PC, FS, HS and GG relationships and further generated the LR distributions of these kinship cases. For these SNP loci, the mutation rate of 1.29 × 10⁻⁸ was determined based on a previous study [25].
Dataset compilation
In addition to the data generated in this study, we assembled previously published public datasets, including the 1 KG and the HGDP datasets, to construct a comprehensive dataset for population genetic analyses. The composite dataset contained genotype data of present-day human populations representing eight continents, namely Africa, Europe, East Asia, Central South Asia, South Asia, America, Middle East, and Oceania. To ensure the robustness of our estimates, the method requires an SNP set with a minor allele frequency higher than 5%, and further mandated that the SNPs under consideration exhibit independence from each other. Therefore, we pruned the SNP loci using the PLINK software, which resulted in 1706 SNP loci available for subsequent population genetic analyses. The combined dataset consisted of genotype data from 1706 SNPs spanning 76 populations located across eight major global regions. For convenience, the Chinese Korean ethnic group was abbreviated as Korean_C in the data analyses. Detailed information on the geographic origins, names and abbreviations of the 75 reference groups can be accessed in Additional file 1: Table S1.
Principal components analysis
Population-level principal component analysis (PCA) was performed utilizing the smartpca program in the EIGENSOFT package [26] for the Chinese Korean ethnic group and 75 present-day reference populations from the 1 KG and HGDP. We adopted default settings except for lsqproject: YES, numoutlieriter: 0, and shrinkmode: YES.
To perform the individual-level PCA, we utilized the GraphPad Prism (version 9.4.1) software to compute the PCs that explained the majority of variances within the compiled dataset. Notably, the individual-level PCA was performed stepwise to distinguish between different population groups. Initially, all 76 populations from eight intercontinental geographic regions were employed to construct the principal component space on which we projected all individuals. Subsequently, we retained populations from Asia (i.e., East Asia, South Asia, and Central South Asia), along with those from the Middle East, to generate a more distinct distribution of these geographically closed populations. Lastly, we divided these populations, all of East Asian ancestry, into Han, Northern minority, and Southern minority groups for PCA to show their distribution patterns. The ggplot2 package in Rstudio software was used to visualize PCA results using the first three PCs.
Population structure analysis
We used the ADMIXTURE (version 1.3.0) software [27] to analyze the genetic structures of 76 populations, comprising a total of 3590 individuals, and estimate individual ancestries through maximum likelihood estimation. To determine the best hypothetical ancestral population values (K) with the lowest cross-validation (CV) errors, we ran ADMIXTURE with K values ranging from 2 to 10. We conducted 20 algorithm iterations for each K value. The population structures were visualized using the pophelper packages in Rstudio and plotted the replicate of each K.
F ST and f statistics
In the combined dataset, the FST matrix among different populations was evaluated using the smartpca function in EIGENSOFT (version 7.2.1) software [26]. The "fstonly: YES" option was used for this assessment.
The f-statistic framework was used to explore the genetic relationships between the Chinese Korean ethnic group and the reference populations by computing the outgroup-f3 and f4 statistic tests using the “q3pop” and “qpDstat” commands in the AdmixTools2 packages [28] in the R program, respectively. The outgroup-f3 statistic was computed as f3 (Mbuti; Korean_C, X) to explore the shared genetic drifts between the Chinese Korean ethnic group and the reference populations, where X represented various populations from the combined dataset (except for the Korean_C and Mbuti populations). Higher f3 values indicated that more genetic drifts had occurred between the Korean_C group and X, suggesting their higher genetic similarities. The pairwise outgroup-f3 results were then presented with a heatmap using the R package ggplot2.
The f4 statistics were measured using the ordered set (Mbuti, Korean_C; X, Y), where X represented the East Asia Han populations (Northern Han, Bei**g Han, and Southern Han) and Y represented the non-Han populations (Cambodian, Dai, Daur, Hezhen, Japanese, Lahu, Miao, Mongolian, Naxi, Oroqen, She, Tu, Tujia, Vietnam, ** of complex traits in diverse samples. Bioinformatics. 2007;23(19):2633–5." href="/article/10.1186/s40246-023-00541-0#ref-CR30" id="ref-link-section-d246958338e794">30]. These two trees were then visualized using the online Chiplot (https://www.chiplot.online/) and the iTOL (https://itol.embl.de/) tools, respectively. Besides, we also used the TreeMix (version 2.1) software [31] to reconstruct the phylogeny of these populations coupled with the potential admixture events. In the TreeMix analysis, the Mbuti population was used as an outgroup to root the tree. The gene flow among these populations were tested by assuming one to eight migration edges and running five algorithm iterations for each. The scripts for data analysis with TreeMix were available on GitHub (https://github.com/carolindahms/TreeMix) and were kindly provided by the developers. We used the 'OptM' package in R to estimate the optimal number of admixture events.
Results
Data quality control
We manually checked the sequencing data quality to ensure a reliable estimation of the forensic efficiencies for the analyzed SNP loci in the Chinese Korean ethnic group. This process involved a thorough evaluation of the newly generated dataset, including both per-sample and per-marker examinations. We removed samples with map** rates < 100% and excluded SNP loci with allele calling rates < 100% to generate a comprehensive dataset for subsequent analyses. Eventually, four samples and 47 SNPs were excluded, leaving a total of 157 samples and 1946 SNP loci (accounted for 97.6% of the total SNP loci) for further forensic analyses. These 1946 SNP loci spanned across the 22 autosomes in the human genome (Additional file 1: Fig. S1A).
To determine whether there were any biologically related participants in this study, we performed the kinship analysis among the 157 Korean individuals. We showed that none of the 157 individuals shared close relatedness with each other. Consequently, 157 unrelated Korean individuals were recruited for subsequent analyses of forensic and population genetic analyses. The sequencing depth of these SNPs varied from 106.85 ± 39.62× to 20,376.01 ± 6654.35×, with most of the sequencing depth concentrated between 1000× and 5000× (Additional file 1: Fig. S1B). We also presented the SNPs with sequencing depths below 500 × in a boxplot, as shown in Additional file 1: Fig. S1C. The results showed that the minimal sequencing depth for the all 1946 SNP loci exceeded 50×. Furthermore, the histogram (Additional file 1: Fig. S1D) showed that the majority of heterozygous SNP loci had an average coverage ratio (ACR) ranging from 0.6538 to 0.9538. Overall, the results suggested that high-quality SNP data have been generated in the Chinese Korean ethnic group with the new NGS-based panel, further ensuring the reliability of subsequent analyses.
Forensic performance of the 1946 SNP loci in the Chinese Korean ethnic group
For the HWE tests of the 1946 SNPs, 13 diallelic SNPs disconformed to HWE after Bonferroni correction (p < 0.000025). The results of LD tests for pairwise SNP loci showed that only 14 pairs (14/1048575 = 0.0013%) of SNP loci deviated from LD in the Chinese Korean ethnic group.
The statistical parameters for the 1946 SNPs were computed as a crucial step in providing informative recommendations for evaluating the panel's potential for forensic use in the Chinese Korean ethnic group. The 1946 SNP loci consisted of 1906 diallelic SNPs and 40 tri-allelic SNPs. We excluded 13 diallelic SNP loci for being completely homozygosity and heterozygosity in the Chinese Korean ethnic group before visualizing the statistical parameters of these SNP loci. Overall, these SNP loci displayed high polymorphisms in the Chinese Korean ethnic group (Additional file 1: Fig. S2A). In the diallelic SNP set, PD values ranged from 0.0252 to 0.5016; GD values varied from 0.0126 to 0.5016; PM values were in the range of 0.3412 to 0.9748; Hobs values varied from 0.0064 to 0.9873; and PE values spanned from 0.0002 to 0.9744. In the tri-allelic SNP set, PD values of these SNPs ranged from 0.3042 to 0.8034; GD values varied from 0.1944 to 0.6602; PM values spanned from 0.1966 to 0.6958; Hobs values were in the range of 0.1465 to 0.9172; PE values ranged from 0.0169 to 08307. Overall, the medians of PD, GD, PM, Hobs, and PD values were 0.5529, 0.4154, 0.4471, 0.4164, 0.1368 and 0.6916, 0.5410, 0.3084, 0.5518, 0.2601 in the diallelic; and tri-allelic SNP sets, respectively, indicating that the tri-allelic SNP loci were genetically more polymorphic than diallelic SNP loci.
Additionally, we estimated the distribution patterns of 1-CPD and 1-CPE values while incrementally incorporating SNP loci in descending order. Generally, both 1-CPD and 1-CPE values gradually decreased as the number of SNP loci increased. The lowest 1-CPD and 1-CPE values for the 1946 SNPs in the Chinese Korean ethnic group were 3.76E-308 and 2.18E-130, respectively. These results indicated that this panel can be effectively used for individual identification and parentage testing (Additional file 1: Fig. S2B). Moreover, even when the successful detection rate of the SNP loci decreased to 10% (200/1993), the 1-CPD and 1-CPE values could still meet the statistically required identification thresholds for individual identification and parentage testing. For more information on the forensic parameters of these SNPs, referring to Additional file 1: Table S2.
Furthermore, we conducted simulations for PC, FS, HS, and GG relationships based on the allele frequencies of the 1946 SNPs in the Chinese Korean ethnic group. Each simulation was repeated 2000 times, and we analyzed the LR for each type of kinship to determine their distribution patterns. As shown in Fig. 1A, significant differences were observed in the log10(LR) distribution for first-degree kinship (including PC and FS) and second-degree kinships (encompassing HS and GG). For the first-degree kinships, the log10(LR) values for PC and FS were in the range of 110.46 to 155.90 (mean of 132.48 ± 6.90 standard deviation) and 87.02 to 149.38 (mean of 117.31 ± 9.62 standard deviation), respectively. For the second-degree kinships, the Log10(LR) values for HS and GG kinships were distributed from 10.65 to 41.95 (mean of 26.71 ± 4.66 standard deviation), and 10.81 to 42.88 (mean of 26.71 ± 4.74 standard deviation), respectively. The distributions of Log10(LR) values for FS, HS and GG kinships were entirely distinct from those of unrelated individuals in the simulated kinships (Fig. 1B–D), demonstrating that the new NGS-based panel was potentially useful for identifying first-degree and second-degree kinships in the Chinese Korean ethnic group.

Estimating the efficiencies of the 1946 SNP loci for kinship analyses by simulating different kinships. A Box plots displaying the distributions of Log10 (LR) for different kinships based on 1946 SNP loci. PC, parent–child pair; FS, full sibling pair; HS, half sibling pair; GG, grandparent-grandchild pair; B Log10 (LR) distributions for FS and unrelated individuals (UI); C Log10 (LR) distributions for HS and unrelated individuals (UI); D Log10 (LR) distributions for GG and unrelated individuals (UI)
Informativeness for assignment (I n) statistics estimated for the 1706 SNPs
By incorporating the 75 reference populations into this study, we were able to conduct a comprehensive evaluation of the ancestry inference power for this panel. Initially, we visualized the allele frequencies of the 1706 overlap** SNPs across all 76 populations through a heatmap (Fig. 2A). These results revealed notable differentiation in the allele frequencies of specific SNP loci across various populations, suggesting that these SNP loci could be potentially useful for ancestry inference. Subsequently, we further used the infocalc program to compute the informativeness for assignment (In) statistics to measure the ancestry information content of these SNP loci in distinguishing among different populations. The In values were calculated to distinguish populations at different levels. In_1 denoted the capacity of the SNP loci to differentiate among the overall 76 intercontinental populations. In_2 quantified the effectiveness of the SNP loci in distinguishing populations from East Asia, South Asia, Central South Asia and Middle East. In_3 specifically gauged their efficiencies in distinguishing East Asian populations. We also generated the scatter plots to provide an intuitive distribution of the forensic efficiencies for these SNP loci, with the X and Y axes demonstrating the In and PD values of each SNP locus. As shown in Fig. 2B–D, while most SNP loci exhibited superior effectiveness in individual identification, some also displayed potential for ancestry inference. In addition, the number of SNP loci with higher ancestral inference efficiency increased with the geographic separation of the distinguished groups. To support future ancestry inference studies, we also provided the SNP loci with robust ancestry inference efficiencies (In > 0.1) in Additional file 1: Table S3.
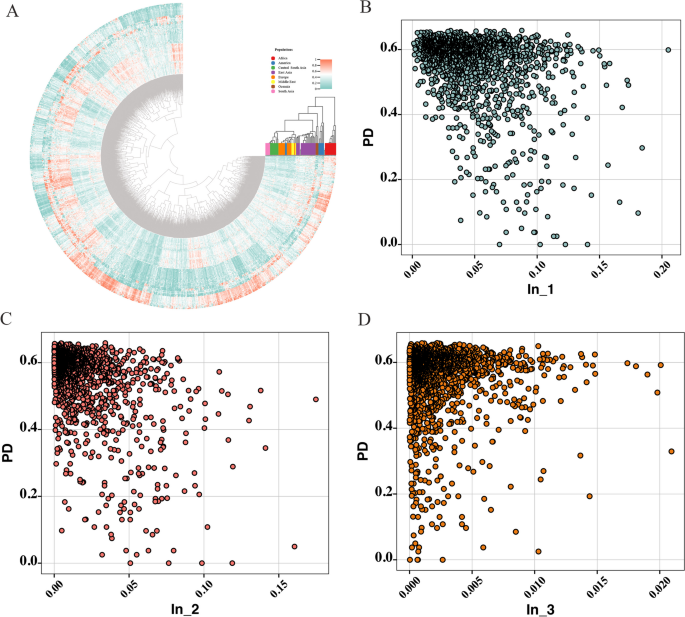
Forensic applications of the 1706 SNP loci in individual identification and ancestry inference. A Heatmap of the allele frequencies for the 1706 SNP loci in the 76 populations; B Distribution of PD and In_1 values of the 1706 SNPs to distinguish among the overall eight intercontinental populations C Distribution of PD and In_2 values of the 1706 SNPs to distinguish between Asia populations; D Distribution of PD and In_3 values of the 1706 SNPs to distinguish between East Asia populations. The In_1 denotes that the SNP loci are used to distinguish between the overall 76 intercontinental populations. The In_2 is calculated to show the efficiency of the SNP locus to distinguish between East Asia, South Asia, Central South Asia and Middle East populations. The In_3 is estimated to show the efficiency of the SNP locus in distinguishing between East Asia populations
Population genetic structures revealed by F ST estimations and ADMIXTURE analysis
The fixation index (FST) was used to estimate pairwise genetic differentiations among the overall 76 populations, encompassing the Chinese Korean ethnic group genotyped in this study and 75 worldwide populations selected from the 1 KG and the HGDP. First, we computed the pairwise FST among different intercontinental populations and visualized the FST values using a heatmap. Then, we extracted the FST between the Chinese Korean ethnic group and its reference populations from different continents to visually present genetic relationships among these populations. Our observations unveiled significantly lower genetic distinctions among populations residing within the same continents, whereas higher genetic differences were evident when comparing populations from different continents. The African populations were relatively more genetically far from other intercontinental populations (Fig. 3A). In this context, the Chinese Korean ethnic group exhibited the most genetic differentiations from African populations, as indicated by a mean FST of 0.2138. In contrast, the Chinese Korean ethnic group shared the least genetic divergence from the East Asian populations, with a mean FST of 0.0087. Meanwhile, the mean FST values between the Chinese Korean ethnic group and populations from South Asia, Central South Asia, America, Europe, Middle East and Oceania populations ranged from 0.0714 to 0.1637, lower than those observed for African populations but higher than those for East Asian populations (Fig. 3B). In the East Asian reference populations, the Yakut and Lahu groups showed the most genetic differentiations from the Chinese Korean ethnic group compared with other East Asian populations. In contrast, the Han populations from various regions (Northern Han, Southern Han, Bei**g Han), ** data of the Chinese Korean ethnic group with data derived from reference populations representing eight different continents worldwide, to provide an extensive exploration of the genetic background of the Chinese Korean ethnic group. To the best of our knowledge, the number of Chinese Koreans and the SNP loci covered in this study surpasses barely all previous studies on the genetic characterization of the Chinese Korean ethnic group. This study was conducted to further expand the genetic diversity profile of the Chinese Korean ethnic group, which will not only serve as a valuable resource for future genome-wide association studies concerning the Chinese Korean ethnic group but also extend insights into its neighboring populations across East Asia.
We have confirmed that this new panel can be effectively used for individual identification and parentage testing in the Chinese Korean ethnic group. Considering the potential challenges of SNP locus detection in aged or degraded DNA samples, we evaluated the trend of 1-CPD and 1-CPE values as the number of SNP loci increased. The results showed that even with only 10% of the loci detected (200/1993), the threshold of statistical determination required for individual identification and paternity testing can still be reliably met. By simulating different degrees of kinships separately, we confirmed that this panel could effectively determine parent–child, full-sibling, half-sibling and grandparent-grandchild kinships from unrelated individuals, indicating that this panel was potentially useful for complex kinship determinations. However, this conclusion should be further validated with real cases in future studies.
This study expanded the population analyses to a global scale by incorporating 75 reference populations from eight different geographic regions. In the population genetic analyses, we showed that the Chinese Korean ethnic group was genetically more related to the East Asian populations in comparison to groups outside the East Asian context. More specifically, the Chinese Korean ethnic group has been shown to be closely related to the Han Chinese populations and several ethnic minorities residing in northern China. The influence of the geographic location in the differentiation of different intercontinental populations was observed in the PCA, which defined major clusters coincident with Africa, Europe, East Asia, South Asia, Middle East, Central South Asia, and Oceania populations. Pairwise FST among different populations also supported that the genetic affinities of populations decreased with increased geographic distances, consistent with the isolation-by-distance model [32]. This geographic pattern was also observed in the ADMIXTURE analyses in which nine genetic components were identified in the Chinese Korean ethnic group and the overall 75 reference populations. With the increase of the pre-assumed ancestral components, the genetic composition of the Chinese Korean ethnic group remained consistent with the East Asian populations. Phylogenetic reconstruction and ADMIXTURE analyses also revealed that the Chinese Korean ethnic group shared more genetic similarities with East Asian populations. Furthermore, there was no detectable influence of genetic ancestries from other intercontinental populations on the gene pool of the Chinese Korean ethnic group.
In recent years, the genomic characteristics of the ethnic Korean population in South Korea has been well characterized by a series of genome-wide studies. The Koreans in South Korea were discovered to share relatively close genetic connections with other East Asian populations, including the Japanese and the Han Chinese [33,34,35]. In 2022, Lee et al. studied 1896 whole-genome sequences and 3409 whole-exome sequences from healthy individuals of Korean ethnicity in South Asia and found that the ethnic Korean population in South Asia might have undergone a recent divergence and continuous admixture with its neighboring populations in East Asia, like CHB and JPT in the 1 KG [36]. Apart from genome-wide analyses, nucleotide sequences of the major noncoding (D-loop) region of human mitochondrial DNA have revealed that the ethnic Korean population in South Asia might share greater genetic connections with Manchurians, Japanese, Mongolians, and northern Han Chinese [37]. In this study, we showed clear evidence that the Chinese Korean ethnic group could be closely related to Han Chinese populations across different regions, as well as the Miao, Daur, Tujia, Japanese, Mongolian and **bo populations. Compared with previous studies, we not only reconfirmed the closer genetic relationships between the Koreans, Han Chinese and Japanese, but also we revealed that some ethnic minorities of northern origin may also share more genetic similarities with the Korean ethnic group in China.
To summarize, the genomic data and findings yielded in this study enhance our understanding of East Asia population histories and contribute to the broader knowledge of global genetic history. Importantly, our data have provided a crucial resource and biomedical reference that will facilitate understanding of rare and common genetic variants in the Chinese Korean ethnic group. Meanwhile, we also admitted that given the limited number of participants included in this study, there may be some uncertainty in the conclusions drawn when exploring the genomic background of the Korean ethnic group in China. In future research endeavors, we intend to enhance our analysis of the genetic structure of the Chinese Korean ethnic group by including a more extensive cohort of Korean individuals, as well as its neighboring ethnic groups that may engage in significant genetic exchanges [38].
Availability of Data and materials
All data needed to evaluate the conclusions in the paper are presented in the paper and associated supplementary materials. Additional data and materials used in this study may be requested from the authors.
References
Jobling MA, Gill P. Encoded evidence: DNA in forensic analysis. Nat Rev Genet. 2004;5(10):739–51.
Butler JM, Buel E, Crivellente F, McCord BR. Forensic DNA ty** by capillary electrophoresis using the ABI Prism 310 and 3100 genetic analyzers for STR analysis. Electrophoresis. 2004;25(10–11):1397–412.
Hennessy LK, Mehendale N, Chear K, Jovanovich S, Williams S, Park C, Gangano S. Developmental validation of the GlobalFiler(®) express kit, a 24-marker STR assay, on the RapidHIT(®) System. Forensic Sci Int Genet. 2014;13:247–58.
Oostdik K, Lenz K, Nye J, Schelling K, Yet D, Bruski S, Strong J, Buchanan C, Sutton J, Linner J, et al. Developmental validation of the PowerPlex(®) fusion system for analysis of casework and reference samples: a 24-locus multiplex for new database standards. Forensic Sci Int Genet. 2014;12:69–76.
Opel KL, Chung DT, Drábek J, Butler JM, McCord BR. Developmental validation of reduced-size STR Miniplex primer sets. J Forensic Sci. 2007;52(6):1263–71.
Alaeddini R, Walsh SJ, Abbas A. Forensic implications of genetic analyses from degraded DNA—a review. Forensic Sci Int Genet. 2010;4(3):148–57.
Isaacson J, Schwoebel E, Shcherbina A, Ricke D, Harper J, Petrovick M, Bobrow J, Boettcher T, Helfer B, Zook C, et al. Robust detection of individual forensic profiles in DNA mixtures. Forensic Sci Int Genet. 2015;14:31–7.
Jäger AC, Alvarez ML, Davis CP, Guzmán E, Han Y, Way L, Walichiewicz P, Silva D, Pham N, Caves G, et al. Developmental validation of the MiSeq FGx Forensic genomics system for targeted next generation sequencing in forensic DNA casework and database laboratories. Forensic Sci Int Genet. 2017;28:52–70.
Wu L, Chu X, Zheng J, **ao C, Zhang Z, Huang G, Li D, Zhan J, Huang D, Hu P, et al. Targeted capture and sequencing of 1245 SNPs for forensic applications. Forensic Sci Int Genet. 2019;42:227–34.
Butler JM, Coble MD, Vallone PM. STRs versus SNPs: thoughts on the future of forensic DNA testing. Forensic Sci Med Pathol. 2007;3(3):200–5.
Bose N, Carlberg K, Sensabaugh G, Erlich H, Calloway C. Target capture enrichment of nuclear SNP markers for massively parallel sequencing of degraded and mixed samples. Forensic Sci Int Genet. 2018;34:186–96.
Hwa HL, Chung WC, Chen PL, Lin CP, Li HY, Yin HI, Lee JC. A 1204-single nucleotide polymorphism and insertion-deletion polymorphism panel for massively parallel sequencing analysis of DNA mixtures. Forensic Sci Int Genet. 2018;32:94–101.
Li JZ, Absher DM, Tang H, Southwick AM, Casto AM, Ramachandran S, Cann HM, Barsh GS, Feldman M, Cavalli-Sforza LL, et al. Worldwide human relationships inferred from genome-wide patterns of variation. Science. 2008;319(5866):1100–4.
Auton A, Brooks LD, Durbin RM, Garrison EP, Kang HM, Korbel JO, Marchini JL, McCarthy S, McVean GA, Abecasis GR. A global reference for human genetic variation. Nature. 2015;526(7571):68–74.
Pagani L, Lawson DJ, Jagoda E, Mörseburg A, Eriksson A, Mitt M, Clemente F, Hudjashov G, DeGiorgio M, Saag L, et al. Genomic analyses inform on migration events during the peopling of Eurasia. Nature. 2016;538(7624):238–42.
Mallick S, Li H, Lipson M, Mathieson I, Gymrek M, Racimo F, Zhao M, Chennagiri N, Nordenfelt S, Tandon A, et al. The Simons Genome Diversity Project: 300 genomes from 142 diverse populations. Nature. 2016;538(7624):201–6.
** HJ, Tyler-Smith C, Kim W. The peopling of Korea revealed by analyses of mitochondrial DNA and Y-chromosomal markers. PLoS ONE. 2009;4(1):e4210.
Zhao GB, Ma GJ, Zhang C, Kang KL, Li SJ, Wang L. BGISEQ-500RS sequencing of a 448-plex SNP panel for forensic individual identification and kinship analysis. Forensic Sci Int Genet. 2021;55:102580.
Li R, Shen X, Chen H, Peng D, Wu R, Sun H. Developmental validation of the MGIEasy Signature Identification Library Prep Kit, an all-in-one multiplex system for forensic applications. Int J Legal Med. 2021;135(3):739–53.
Purcell S, Neale B, Todd-Brown K, Thomas L, Ferreira MA, Bender D, Maller J, Sklar P, de Bakker PI, Daly MJ, et al. PLINK: a tool set for whole-genome association and population-based linkage analyses. Am J Hum Genet. 2007;81(3):559–75.
Cui W, Chen M, Yang Y, Cai M, Lan Q, **e T, Zhu B. Applications of 1993 single nucleotide polymorphism loci in forensic pairwise kinship identifications and inferences. Forensic Sci Int Genet. 2023;65:102889.
Gouy A, Zieger M. STRAF—a convenient online tool for STR data evaluation in forensic genetics. Forensic Sci Int Genet. 2017;30:148–51.
Barrett JC, Fry B, Maller J, Daly MJ. Haploview: analysis and visualization of LD and haplotype maps. Bioinformatics. 2005;21(2):263–5.
Kling D, Tillmar AO, Egeland T. Familias 3—extensions and new functionality. Forensic Sci Int Genet. 2014;13:121–7.
Besenbacher S, Sulem P, Helgason A, Helgason H, Kristjansson H, Jonasdottir A, Jonasdottir A, Magnusson OT, Thorsteinsdottir U, Masson G, et al. Multi-nucleotide de novo Mutations in Humans. PLoS Genet. 2016;12(11):e1006315.
Patterson N, Price AL, Reich D. Population structure and eigenanalysis. PLoS Genet. 2006;2(12):e190.
Alexander DH, Novembre J, Lange K. Fast model-based estimation of ancestry in unrelated individuals. Genome Res. 2009;19(9):1655–64.
Patterson N, Moorjani P, Luo Y, Mallick S, Rohland N, Zhan Y, Genschoreck T, Webster T, Reich D. Ancient admixture in human history. Genetics. 2012;192(3):1065–93.
Tamura K, Stecher G, Kumar S. MEGA11: molecular evolutionary genetics analysis version 11. Mol Biol Evol. 2021;38(7):3022–7.
Bradbury PJ, Zhang Z, Kroon DE, Casstevens TM, Ramdoss Y, Buckler ES. TASSEL: software for association map** of complex traits in diverse samples. Bioinformatics. 2007;23(19):2633–5.
Pickrell JK, Pritchard JK. Inference of population splits and mixtures from genome-wide allele frequency data. PLoS Genet. 2012;8(11):e1002967.
Jay F, Sjödin P, Jakobsson M, Blum MG. Anisotropic isolation by distance: the main orientations of human genetic differentiation. Mol Biol Evol. 2013;30(3):513–25.
Kim YJ, ** HJ. Dissecting the genetic structure of Korean population using genome-wide SNP arrays. Genes Genom. 2013;35:355–63.
Pan Z, Xu S. Population genomics of East Asian ethnic groups. Hereditas. 2020;157(1):49.
Wang Y, Lu D, Chung YJ, Xu S. Genetic structure, divergence and admixture of Han Chinese. Jpn Korean Popul Hereditas. 2018;155:19.
Lee J, Lee J, Jeon S, Lee J, Jang I, Yang JO, Park S, Lee B, Choi J, Choi BO, et al. A database of 5305 healthy Korean individuals reveals genetic and clinical implications for an East Asian population. Exp Mol Med. 2022;54(11):1862–71.
Horai S, Murayama K, Hayasaka K, Matsubayashi S, Hattori Y, Fucharoen G, Harihara S, Park KS, Omoto K, Pan IH. mtDNA polymorphism in East Asian Populations, with special reference to the peopling of Japan. Am J Hum Genet. 1996;59(3):579–90.
Sun N, Tao L, Wang R, Zhu K, Hai X, Wang CC. The genetic structure and admixture of Manchus and Koreans in northeast China. Ann Hum Biol. 2023;50(1):161–71.
Funding
We would like to thank the participants of this study, who very generously provided their blood samples. This work was supported by the National Natural Science Foundation of China (Nos. 82072122 and 81930055).
Author information
Authors and Affiliations
Contributions
BF Z and CM S conceptualized and designed the study. QL analyzed the data and wrote the manuscript. YF L and XY provided extensive comments on the first drafts of the manuscript. All authors provided helpful comments and feedback on the manuscript. XW helped in data acquisition and preprocessing. All authors read and approved the final manuscript.
Corresponding authors
Ethics declarations
Ethics approval and consent to participate
Not applicable.
Consent for publication
Not applicable.
Competing interests
The authors declare that they have no competing interests.
Additional information
Publisher's Note
Springer Nature remains neutral with regard to jurisdictional claims in published maps and institutional affiliations.
Supplementary Information
Additional file 1. Fig. S1:
Sequencing depths and allele coverage ratios of the SNP loci in the Chinese Korean ethnic group. A Distribution of the 1993 SNP loci in the 22 autosomes; B Histogram of the average sequencing depths for 1993 SNP loci in 161 Chinese Korean individuals; C Boxplot of the sequencing depths for SNP loci with a sequencing depth less than 500×; D Histogram of the average allele coverage ratios for the heterozygous SNP loci in the Korean ethnic group. Fig. S2: Forensic efficiencies of the 1946 SNPs in the Chinese Korean ethnic group. A Forensic statistical parameters, encompassing gene diversity (GD), Hobs (Observed heterozygosity), PD (Power of discrimination), PE (Power of exclusion) and PM (Probability of match) of the 1946 SNPs; B Distribution of 1-CPD and 1-CPE values estimated with the increase of SNP loci. Fig. S3: ADMIXTURE results for K = 2 ~10, with the K denoting the pre-assumed ancestry components represented by different colors. The ancestry composition of each population is proportional to the height of different colors. Fig. S4: Principal component analyses (PCA) of the Chinese Korean ethnic group and the reference populations. Each dot represents a single individual and is colored according to its continental origin. A PCA of the Chinese Korean ethnic group and all the reference populations from eight major geographic regions worldwide. The Chinese Korean ethnic group and East Asian populations are marked with black box; B PCA of the Chinese Korean ethnic group and the East Asian reference populations. Fig. S5: Phylogenetic reconstruction of Treemix results for one to seven (except for four) migration events between the Chinese Korean ethnic group and the reference populations. Fig. S6: Pairwise residuals of Treemix results for one to seven (except for four) migration events between the Chinese Korean ethnic group and the reference populations.
Rights and permissions
Open Access This article is licensed under a Creative Commons Attribution 4.0 International License, which permits use, sharing, adaptation, distribution and reproduction in any medium or format, as long as you give appropriate credit to the original author(s) and the source, provide a link to the Creative Commons licence, and indicate if changes were made. The images or other third party material in this article are included in the article's Creative Commons licence, unless indicated otherwise in a credit line to the material. If material is not included in the article's Creative Commons licence and your intended use is not permitted by statutory regulation or exceeds the permitted use, you will need to obtain permission directly from the copyright holder. To view a copy of this licence, visit http://creativecommons.org/licenses/by/4.0/. The Creative Commons Public Domain Dedication waiver (http://creativecommons.org/publicdomain/zero/1.0/) applies to the data made available in this article, unless otherwise stated in a credit line to the data.
About this article

Cite this article
Lan, Q., Lin, Y., Wang, X. et al. Targeted sequencing of high-density SNPs provides an enhanced tool for forensic applications and genetic landscape exploration in Chinese Korean ethnic group. Hum Genomics 17, 107 (2023). https://doi.org/10.1186/s40246-023-00541-0
Received:
Accepted:
Published:
DOI: https://doi.org/10.1186/s40246-023-00541-0