Abstract
Background
The cohesin complex organizes the genome-forming dynamic chromatin loops that impact on all DNA-mediated processes. There are two different cohesin complexes in vertebrate somatic cells, carrying the STAG1 or STAG2 subunit, and two versions of the regulatory subunit PDS5, PDS5A and PDS5B. Mice deficient for any of the variant subunits are embryonic lethal, which indicates that they are not functionally redundant. However, their specific behavior at the molecular level is not fully understood.
Results
The genome-wide distribution of cohesin provides important information with functional consequences. Here, we have characterized the distribution of cohesin subunits and regulators in mouse embryo fibroblasts (MEFs) either wild type or deficient for cohesin subunits and regulators by chromatin immunoprecipitation and deep sequencing. We identify non-CTCF cohesin-binding sites in addition to the commonly detected CTCF cohesin sites and show that cohesin-STAG2 is the preferred variant at these positions. Moreover, this complex has a more dynamic association with chromatin as judged by fluorescence recovery after photobleaching (FRAP), associates preferentially with WAPL and is more easily extracted from chromatin with salt than cohesin-STAG1. We observe that both PDS5A and PDS5B are exclusively located at cohesin-CTCF positions and that ablation of a single paralog has no noticeable consequences for cohesin distribution while double knocked out cells show decreased accumulation of cohesin at all its binding sites. With the exception of a fraction of cohesin positions in which we find binding of all regulators, including CTCF and WAPL, the presence of NIPBL and PDS5 is mutually exclusive, consistent with our immunoprecipitation analyses in mammalian cell extracts and previous results in yeast.
Conclusion
Our findings support the idea that non-CTCF cohesin-binding sites represent sites of cohesin loading or pausing and are preferentially occupied by the more dynamic cohesin-STAG2. PDS5 proteins redundantly contribute to arrest cohesin at CTCF sites, possibly by preventing binding of NIPBL, but are not essential for this arrest. These results add important insights towards understanding how cohesin regulates genome folding and the specific contributions of the different variants that coexist in the cell.
Background
Cohesin plays a major role in the three dimensional organization of the genome in addition to mediate sister chromatid cohesion [1]. This conserved protein complex consists of four core components, Structural Maintenance of Chromosomes (SMC) subunits SMC1 and SMC3, the kleisin subunit RAD21 and the HEAT-repeat containing STAG/SA subunit [2]. Another two HEAT-repeat proteins associate with cohesin. One is NIPBL, which forms a heterodimer with MAU2 and is considered the cohesin loader [3]. The other is PDS5, which can associate with WAPL to drive cohesin unloading but can also stabilize cohesin on chromatin by promoting its acetylation by acetyltransferases ESCO1/2 and the binding of Sororin [4–7]. There are two PDS5 proteins in vertebrate cells, PDS5A and PDS5B, highly homologous except in their C-terminal regions [8]. Knock-out mice for either gene die before birth, suggesting that full compensation cannot be achieved [4]. The two PDS5 proteins are present in cells throughout the cell cycle, can associate with either cohesin-STAG1 or cohesin-STAG2 and can recruit ESCO1 to cohesin [8, 9]. Moreover, both must be depleted in order to alter cohesin dynamics and promote the appearance of vermicelli in MEFs and HeLa cells [5, 7]. There are also two versions of the STAG subunit, STAG1 and STAG2, for which both overlap** and distinct roles have been described in recent years [10–13]. Elimination of either STAG gene results in embryonic lethality [14, 15]. Mutations in STAG1 and STAG2 have been identified in human developmental syndromes and STAG2 is frequently mutated in cancer [16, 17]. Understanding the specific roles of the different versions of cohesin that coexist in the cell may provide important hints for a rational design of specific treatments for these patients. Importantly, several lines of evidence suggest that these disease-causing mutations alter the function of cohesin in genome folding rather than in sister chromatid cohesion.
The role of cohesin in genome architecture centers on its ability to generate chromatin loops [18, 19, 7]. According to the loop extrusion model, cohesin loads on DNA and forms a small loop that is progressively extended until the complex is released from DNA by the action of PDS5-WAPL or until it is stopped and stabilized by chromatin-bound CTCF [20–22]. This explains why cohesin largely colocalizes with CTCF genome-wide [23, 24]. The boundary and/or anchoring function of CTCF depends on its interaction with an interface formed by STAG and RAD21, which is the same that requires WAPL, but possibly also on PDS5 and ESCO1 [25, 26, 27, 7, 13]. Recent in vitro reconstitution of loop extrusion by cohesin has demonstrated the requirement for NIPBL to activate the SMC1/3 ATPase [28, 29]. In yeast, Pds5 competes with Scc2 (NIPBL ortholog) for cohesin-binding and structural studies indicate that the two proteins bind the same region in RAD21 [30, 31]. It is therefore possible that PDS5 contributes to halting extrusion at CTCF sites by preventing the interaction of cohesin with NIPBL. In addition, PDS5 may promote SMC3 acetylation by ESCO1 at these sites, as deletion of CTCF dramatically decreases cohesin acetylation [32]. While acetylated cohesin has been mapped to CTCF sites, the genome-wide localization of PDS5 proteins in mammalian cells has not been reported yet [33, 9, 34].
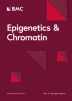
Recent studies have described the genome-wide distribution of cohesin variants STAG1 and STAG2 [35, 10, 36, 37, 38, 45]. However, they use a single antibody to detect the four-subunit cohesin complex, an antibody against RAD21. We have performed our experiments using antibodies against different cohesin subunits and regulators and used also data from other studies using a different set of cohesin antibodies [32, 44]. Different antibodies have different abilities to recognize their epitopes at sites in which cohesin may present a different conformation or be bound by different regulators [46]. While it is difficult to compare data obtained with different antibodies, read density plots shown in Figs. 1 and 2 comparing distribution of ChIP reads between CTCF and non-CTCF sites for each antibody in different cell lines support the existence of non-CTCF cohesin sites and further show that cohesin-STAG2 is the preferred variant at those sites, consistent with our previous results in human cells [37] and mouse embryonic stem cells [36].
At least a fraction of the non-CTCF cohesin sites could represent loading sites, as previously suggested [41]. In WT MEFs, the more dynamic cohesin-STAG2 would be more available for loading and therefore it would be detected at these sites more frequently. In Ctcf KO MEFs, as cohesin-STAG1 becomes more dynamic [13] this variant would also occupy those sites. Conversely, when the absence of WAPL abrogates cohesin release and there is no free cohesin available, cohesin cannot be detected at those sites. One puzzling observation is that CTCF depletion decreases cohesin (SMC1) occupancy not only at CTCF sites, but also at non-CTCF sites. We reckon that the gain of STAG1 at these positions does not compensate for the loss of STAG2, a consequence of the strong reduction in STAG2 protein levels observed by immunoblot analyses in Ctcf KO MEFs. The reason for this reduction is unclear. One possibility is that NIPBL preferentially engages the STAG1 complex, which becomes more available in the absence of CTCF, and that STAG2 that cannot be loaded/stabilized on chromatin is degraded. This effect could be particularly strong in the experimental conditions used here, as extensive depletion of CTCF required 10 days of cell culture in low serum in the presence of Cre recombinase. Additional replicates for this experiment, maybe also in different experimental conditions and cell lines, will be required to validate these hypotheses.
Recently, the validity of NIPBL ChIP-seq datasets, including the one used here, and the actual existence of defined loading sites for cohesin have been called into question [47]. Whether this is the case or not, an alternative scenario, previously discussed, is that sites to which cohesin relocates in the absence of CTCF represent secondary boundaries for loop extrusion, such as those occupied by the transcriptional machinery [47, 32]. Recent reports have shown a correlation between NIPBL occupancy and the presence of RNA polII and transcriptional regulators [48–50]. Moreover, we have previously identified preferential interactions between STAG2 and transcription factors in human cells [37]. Whether these interactions recruit cohesin to enhancers/promoters or are the consequence of cohesin being retained by the transcriptional machinery remains to be clarified.
The role of Pds5 proteins in CTCF boundary function
Here we have shown that genome-wide distribution of PDS5A and PDS5B is virtually identical and the two proteins localize almost exclusively at CTCF-bound cohesin sites. Deletion of one or the other PDS5 paralog does not have a noticeable effect on cohesin distribution while cohesin is moderately reduced at all sites in Pds5 DKO MEFs. Wutz et al. [7] showed that PDS5 proteins are required for CTCF boundary function and suggested that this might depend, at least in part, on exclusive binding of cohesin to PDS5 or NIPBL, as suggested by structural studies [30]. Our immunoprecipitation data confirm that human cohesin complexes bound to PDS5 do not interact with NIPBL, as suggested by results in yeast [31]. The competition of NIPBL and PDS5 for binding cohesin appears to be regulated by acetylation [51, 27]. This acetylation, in turn, may occur preferentially at CTCF sites, as it is dramatically reduced in Ctcf KO MEFs [32]. Mutation of CTCF in residues that are key for the cohesin-CTCF interaction (Y226A/F228A) decreases but does not abrogate cohesin localization at CTCF sites, suggesting the existence of additional interaction surfaces [26]. Intriguingly, the N-terminal region of CTCF contains a motif, found also in WAPL and SORORIN, that interacts with the APEAP motif in the N-terminus of PDS5 [52, 53]. Thus, a single cohesin complex could interact with the N-terminal regions of two CTCF proteins at the base of a chromatin loop: one through PDS5 and the other through the RAD21-STAG interface (Fig. 6). The latter appears to be dominant, since deletion of the PDS5-binding motif in CTCF did not reduce insulation or Hi-C peak strength in mouse ES cells [52]. Further analyses are required to address the functional consequences of the PDS5-CTCF interaction. Moreover, this study detected a preferential interaction of CTCF with PDS5A, but the PEAP motif is present in both PDS5A and PDS5B. This situation is reminiscent of what happens with STAG1 and STAG2: while the region interacting with CTCF (CES) is present in both STAG proteins, a preferential interaction of STAG1 with CTCF has been described [13]. It is therefore possible that regions in the paralogs beyond those identified as critical reinforce or hinder their interaction with CTCF. The exclusive presence of PDS5 protein at CTCF cohesin sites support the idea that they contribute to arrest cohesin at CTCF sites by several mechanisms that include preventing access of NIPBL, promoting ESCO1-mediated SMC3 acetylation and providing an additional interaction surface for cohesin and CTCF.

Cohesin-mediated loops at CTCF convergent sites. Speculative model showing how a single cohesin complex could be arrested at the base of a chromatin loop with CTCF to motifs in convergent orientation. The N-terminal region of the CTCF molecule on the left would interact with PDS5 while the one on the right would bind the STAG/RAD21 interface. PDS5 binding to RAD21 would prevent the interaction with NIPBL, halting extrusion, while WAPL interactions with PDS5 and STAG/RAD21 would be also precluded, blocking release of the complex. Acetylation of SMC3 head (Ac) would strengthen the cohesin–PDS5 interaction
Methods
MEF isolation and culture
MEFs of the following genotypes were used in this study: Stag1 −/− [15], Stag2 f/Y; Cre-ERT2 [14], Pds5A ± , Pds5B ± , Pds5A f/f; Pds5B f/f; Cre-ERT2 [4] and Ctcf f/f [54]. Mice were housed in a pathogen-free animal facility following the animal care standards of the institution. All procedures have been revised and approved by the required authorities (Comunidad Autónoma de Madrid). Primary MEFs were isolated from E12.5 embryos and cultured in DMEM supplemented with 20% FBS at 37 ºC under 90% humidity and 5% CO2. Conditional knock out MEFs (Stag2 f/Y; Cre-ERT2 and Pds5A f/f; Pds5B f/f; Cre-ERT2) were cultured in medium with 1 μM 4-hydroxy tamoxifen for 4 and 5 days, respectively. For CTCF elimination, a clone of immortalized Ctcf f/f MEFs was infected with Adeno-Cre viruses (University of Iowa) at 250 pfu/cell in DMEM supplemented with 2% FBS. Medium was replaced after 24 h and cells were collected 9 days later for immunoblot and chromatin immunoprecipitation analyses.
Immunoblotting
Whole cell extracts for immunoblot were prepared by resuspension in Laemmli buffer at 10,000 cells/µl, sonication and boiling for 5 min at 95 ºC, fractionated in SDS-polyacrylamide gels and transferred to nitrocellulose membranes for 1 h at 100 V in transfer buffer I. Membranes were blocked in 5% skimmed milk in TBST, incubated with antibodies for 1–2 h in 1% BSA-TBST. Antibodies are listed in Additional file 2: Table S2. Horseradish peroxidase (HRP)-conjugated secondary antibodies (Amersham Biosciences) were used at 1:5000 dilution in blocking solution for 1 h at RT. ECL develo** reagent (Amersham Biosciences) was used.
Immunoprecipitation
Whole cell extracts for immunoprecipitation (Fig. 3, Additional file 1: Fig. S4), were prepared by lysing asynchronously growing MEFs in lysis buffer [0.5% NP-40 in TBS supplemented with 0.5 mM DTT, 0.1 mM PMSF and 1X complete protease inhibitor cocktail (Roche)] on ice for 30 min followed by sonication. Then NaCl was added to 0.3 M and the extract rotated for 30 min at 4 ºC. Salt concentration was then lowered to 0.1 M NaCl by dilution and glycerol added to 10% final concentration. Extracts were incubated with specific antibodies for 2 h at 4 ºC and rotated with 1/10 vol of protein A agarose beads for 1 h at 4 ºC. The beads were washed 6 times with 20 vol of lysis buffer and eluted in SDS-DTT gel loading buffer for 5 min at 95 ºC.
For immunoprecipitation reactions shown in Fig. 4, HeLa nuclear extracts were used. These were prepared in buffer B (20 mM K-Hepes, pH8, 0.1 M KCl, 2 mM MgCl2, 0.2 mM EDTA, 20% glycerol, 0.5 mM PMSF, 1 mM 2-mercaptoethanol) as described [55]. For the experiment shown in Fig. 4b, 25 µl of extract were incubated with 2.5 µl of IgG (control), 2.5 µg anti-SMC1, or 1.25 µg each anti-Pds5A and anti-PDS5B, for 2 h on ice and additional 2 h rotating at 4 ºC after adding 7.5 μl of protein A magnetic beads to the mixture. Beads were then recovered, washed with buffer B supplemented with 0.01% NP40, boiled and the supernatant was analyzed by immunoblotting. For the experiment in Fig. 4c, 100 µl of extract were incubated with 15 µg each PDS5A and PDS5B antibodies (PDS5-dep) or 30 µg of rabbit IgG (mock-dep) for 2 h on ice, 30 µl of protein A-sepharose beads were added to each mix and tubes were rotated overnight at 4 ºC. The supernatant was recovered, 1 µl was kept as input and to the rest we added 15 µg of anti-SMC1. After 2 h on ice, 25 µl of protein A magnetic beads (Millipore) were added and the tubes rotated for 2 h at 4 ºC. The supernatant (unbound) and immune complexes (bound) were then mixed with Laemmli buffer, boiled 5 min at 95 ºC and analyzed by immunoblotting.
Biochemical fractionation and salt extraction
Chromatin fractionation was performed as described [56]. Cells were resuspended at 2·107 cells/mL in buffer A (10 mM HEPES pH 7.9, 10 mM KCl, 1.5 mM MgCl2, 0.34 M sucrose, 10% glycerol, 1 mM DTT, 1 mM NaVO4, 0.5 mM NaF, 5 mM β-glycerophosphate, 0.1 mM PMSF), and incubated on ice for 5 min in the presence of 0.1% Triton X-100. Low-speed centrifugation (4 min/600 g/4 °C) allowed the separation of the cytosolic fraction (supernatant) and nuclei (pellet). Nuclei were washed and subjected to hypotonic lysis in buffer B (3 mM EDTA, 0.2 mM EGTA, 1 mM DTT, 1 mM NaVO4, 0.5 mM NaF, 5 mM β-glycerophosphate, 0.1 mM PMSF) 30 min on ice. Nucleoplasmic and chromatin fractions were separated after centrifugation (4 min/600 g/4 °C). Chromatin was resuspended in Laemmli buffer and sonicated twice for 15 s at 20% amplitude. For salt extraction experiments, chromatin fractions were either left untreated or treated with 0.5 M NaCl in modified buffer A (10 mM HEPES pH 7.9, 1.5 mM MgCl2, 0.34 M sucrose, 10% glycerol and supplemented as above) for 30 min on ice. Solubilized proteins were separated from insoluble chromatin by low-speed centrifugation (4 min/600 g/4 °C) and prepared for immunoblotting.
Immunofluorescence
Cells grown on coverslips were pre-extracted with 0.5% Triton X-100 in CSK buffer (10 mM Pipes pH 7.0, 100 mM NaCl, 3 mM MgCl2 and 300 mM sucrose) for 5 min before fixation in 2% paraformaldehyde for 15 min at room temperature. Coverslips were blocked with 3% BSA, 0.05% Tween-20 in PBS for 30 min. Primary and secondary antibodies were diluted in blocking solution and incubated for 1 h each. DNA was counterstained with 1 µg/ml DAPI. A Leica DM6000 microscope was used to obtain grayscale images, which were later analyzed using FIJI software.
Inverse fluorescence recovery after photobleaching (iFRAP)
One wild-type MEF clone was immortalized using SV40 large T antigen and used to generate RAD21-GFP, STAG1-GFP and STAG2-GFP expressing cell lines by CRISPR/Cas9-mediated homologous recombination, as described [57]. Donor plasmids containing the C-terminus of the targeted genes with in-frame GFP were generated by Gibson Assembly. sgRNA sequences were designed using “crispr.mit.edu” (Additional file 2: Table S3) and cloned in pX335 plasmids, that also encodes Cas9n-D10A. Plasmids were introduced in MEFs by electroporation with a Neon Transfection System (ThermoFisher) applying 2 pulses of 20 ms at 1400 V. Positive cells were selected through an Influx Cell Sorter (BD) based on the GFP signal over control cells. The resulting polyclonal population was characterized by immunofluorescence, immunoblot and immunoprecipitation (Additional file 1: Fig. S4) and used for iFRAP, selecting cells showing nuclear GFP signal. Cells were seeded in 8-well chambered coverslips (Ibidi) at 40,000 cells/cm2 48 h prior to performing the experiment. The next day media was changed to 0.1% FBS for 24 h. iFRAP was performed in a Leica TCS-SP5 (AOBS) confocal microscope from Germany Leica Microsystems using a 40x/1.2 NA HCX PL APO objective with immersion oil. Cells were kept in a climate chamber at 37 ºC with 5% CO2 during the experiment. Image acquisition used the HCSA software in LAS AF 2.7. Cells were photobleached with an argon laser and the recovery was monitored by live-cell imaging, Pictures were taken immediately before and after photobleaching as well as every 30 s during recovery. Videos were analyzed using FIJI software using the plug-in Turboreg (http://bigwww.wpfl.ch/thevenaz/turboreg) for image alignment. For each timepoint, the difference in intensity between the bleached and unbleached areas of the cell nucleus is calculated after background subtraction, normalization to initial fluorescence (i.e., t = 0 in the unbleached area) and to total cell intensity. Statistical analysis and curve fit (non-linear regression) were carried out with GraphPad Prism.
ChIP sequencing and analysis
Chromatin immunoprecipitation was performed in asynchronously growing MEFs as described [39] with antibodies listed in Additional file 2: Table S2. For SMC1 and STAG2 ChIPs in Ctcf f/f ± Cre, MEFs arrested in G0 were used and around 5% of sonicated chromatin from MCF10A cells was mixed with the mouse chromatin before addition of antibodies for calibration purposes. Around 5 ng of immunoprecipitated chromatin in each sample were used for library preparation. DNA libraries were applied to an Illumina flow cell for cluster generation and sequenced on an Illumina HiSeq2000. Alignment of reads to the reference mouse genome (mm10) was performed using ‘Bowtie2’ (version 2.4.2) under default settings [58]. Duplicates were removed using GATK4 (version 4.1.9.0) and peak calling was carried out using MACS2 (version 2.2.7.1) after setting the q value (FDR) to 0.05 and using the ‘–extsize’ argument with the values obtained in the ‘macs2 predictd’ step [59]. “CTCF” and “non-CTCF” cohesin positions in MEFs (Fig. 1A) were defined using called peaks generated as indicated above from ChIP-seq data for cohesin subunits obtained in this study and a previous study from our group [39] as well as CTCF ChIP-seq data from this study and two additional studies from the Peters’ group [32, 44]. “CTCF” and “non-CTCF” cohesin positions in different human cell types (Fig. 2) were defined in the same way, merging first called peaks for each cohesin subunit and then separating these “cohesin” peaks in two clusters according to the presence/absence of CTCF signal. Motif analysis (Additional file 1: Fig. S3) was performed using MEME-ChIP with standard parameters [60]. We considered all the motifs discovered by SPAMO with a P-value cut-off < 10−10.
For analysis of calibrated ChIP-seq, profiles for each antibody were normalized by coverage and then multiplied by the occupancy ratio (OR) = (WhIPm)/(WmIPh), where Wm and IPm are the number of reads mapped to the mouse genome from input (W) and immunoprecipitated (IP) fractions, and Wh and IPh are reads mapped to the human genome from the input and IP fractions used for calibrating [61]. When calibrated ChIP-seq was not available, normalization was done by RPKM. Mean read-density profiles and read-density heatmaps for different chromatin-binding proteins were generated with deepTools 3.5.0 [62]. For the data shown in Fig. 1d, we first obtained the ratio between WT and KO for CTCF and non-CTCF cohesin positions for each biological replicate pair. Then, we calculated the log2-fold change between CTCF and non-CTCF positions. Chromatin states used in Fig. 4 were generated using ChromHMM [63]. CTCF, H3K27ac, H3K4me3, H3K4me1, H3K27me3, POLII and input datasets were used to generate 8 or 15 hidden Markov model-states. In the end, we used the model with 8 states, but splitting the enhancer state in two based on the 15-state model. For the correlation of PolII with NIPBL and CTCF (Fig. 4f), active promoters were selected as those with an average signal for H3K4me3 in ± 2.5 Kb around TSS > 1. This corresponds to 13,290 TSSs out of the 24,388 total number of TSSs (used in the heatmaps of Fig. 4e).
ChIP-qPCR
For ChIP-qPCR, SYBR Green PCR Master Mix and an ABI Prism® 7900HT instrument (Applied Biosystems®) was used and reactions were performed in triplicate. Fold enrichment of cohesin-binding at a given position was calculated over the binding at a nearby position showing few reads in the browser (negative region). Chromosome coordinates of the validated peaks and the corresponding primers are listed in Additional file 2: Table S4.
RNA sequencing and analysis
Asynchronous MEFs (3 clones) were harvested and RNA was extracted using RNeasy kit from Qiagen. PolyA + RNA was purified with the Dynabeads mRNA purification kit (Invitrogen), randomly fragmented and converted to double-stranded cDNA and processed through subsequent enzymatic treatments of end-repair, dA-tailing and ligation to adapters as in Illumina’s ‘TruSeq RNA Sample Preparation Guide’ (Part # 15031047 Rev. D). Adapter-ligated library was completed by limited-cycle PCR with Illumina PE primers and applied to an Illumina flow cell for cluster generation (TruSeq cluster generation kit v5) and sequenced on HiSeq2000 following manufacturer’s protocols. Fastq files with 86-nt single-end sequenced reads were quality-checked with FastQC (S. Andrews, http://www.bioinformatics.babraham.ac.uk/projects/fastqc/) and aligned to the mouse genome with Nextpresso executing TopHat-2.0.0 using Bowtie 0.12.7 and Samtools 0.1.16 allowing two mismatches and five multi-hits [64]. Reads were mapped to mm10 genes using HTSeq [65].
Genomic data
Genomic data generated in this study have been deposited in GEO database (accession number GSE212151). A list with these and additional datasets used appears in Additional file 2: Table S1.
Availability of data and materials
NGS data have been deposited in GEO database (GSE212151). Materials such as custom-made antibodies will be distributed in reasonable quantities.
References
Nishiyama T. Cohesion and cohesin-dependent chromatin organization. Curr Opin Cell Biol. 2019;58:8–14.
Losada A, Yokochi T, Kobayashi R, Hirano T. Identification and characterization of SA/Scc3p subunits in the Xenopus and human cohesin complexes. J Cell Biol. 2000;150:405–16.
Watrin E, Schleiffer A, Tanaka K, Eisenhaber F, Nasmyth K, Peters JM. Human Scc4 is required for cohesin binding to chromatin, sister-chromatid cohesion, and mitotic progression. Curr Biol. 2006;16:863–74.
Carretero M, Ruiz-Torres M, Rodriguez-Corsino M, Barthelemy I, Losada A. Pds5B is required for cohesion establishment and Aurora B accumulation at centromeres. EMBO J. 2013;32:2938–49.
Morales C, Ruiz-Torres M, Rodriguez-Acebes S, Lafarga V, Rodríguez-Corsino M, Megias D, Cisneros DA, Peters J-M, Méndez J, Losada A. PDS5 proteins are required for proper cohesin dynamics and participate in replication fork protection. J Biol Chem. 2020;2895:146–57.
Nishiyama T, Ladurner R, Schmitz J, Kreidl E, Schleiffer A, Bhaskara V, Bando M, Shirahige K, Hyman AA, Mechtler K, et al. Sororin mediates sister chromatid cohesion by antagonizing Wapl. Cell. 2010;143:737–49.
Wutz G, Várnai C, Nagasaka K, Cisneros DA, Stocsits RR, Tang W, Schoenfelder S, Jessberger G, Muhar M, Hossain MJ, et al. Topologically associating domains and chromatin loops depend on cohesin and are regulated by CTCF, WAPL, and PDS5 proteins. EMBO J. 2017;36:3573–99.
Losada A, Yokochi T, Hirano T. Functional contribution of Pds5 to cohesin-mediated cohesion in human cells and Xenopus egg extracts. J Cell Sci. 2005;118:2133–41.
Minamino M, Ishibashi M, Nakato R, Akiyama K, Tanaka H, Kato Y, Negishi L, Hirota T, Sutani T, Bando M, et al. Esco1 Acetylates Cohesin via a Mechanism Different from that of Esco2. Curr Biol. 2015;25:1694–706.
Casa V, Gines MM, Gusmao EG, Slotman JA, Zirkel A, Josipovic N, Oole E, Van Ijcken WFJ, Houtsmuller AB, Papantonis A, et al. Redundant and specific roles of cohesin STAG subunits in chromatin loo** and transcriptional control. Genome Res. 2020;30:515–27.
Cuadrado A, Losada A. Specialized functions of cohesins STAG1 and STAG2 in 3D genome architecture. Curr Opin Genet Dev. 2020;61:9–16.
Viny AD, Bowman RL, Liu Y, Lavallée V-P, Eisman SE, **ao W, Durham BH, Navitski A, Park J, Braunstein S, et al. Cohesin members Stag1 and Stag2 display distinct roles in chromatin accessibility and topological control of HSC self-renewal and differentiation. Cell Stem Cell. 2019;25:682-696.e8.
Wutz G, Ladurner R, St Hilaire BG, Stocsits RR, Nagasaka K, Pignard B, Sanborn A, Tang W, Várnai C, Ivanov MP, et al. ESCO1 and CTCF enable formation of long chromatin loops by protecting cohesinSTAG1 from WAPL. Elife. 2020;9:e52091.
De Koninck M, Lapi E, Badía-Careaga C, Cossío I, Giménez-Llorente D, Rodríguez-Corsino M, Andrada E, Hidalgo A, Manzanares M, Real FX, et al. Essential roles of cohesin STAG2 in mouse embryonic development and adult tissue homeostasis. Cell Rep. 2020. https://doi.org/10.1016/j.celrep.2020.108014.
Remeseiro S, Cuadrado A, Carretero M, Martínez P, Drosopoulos WC, Cañamero M, Schildkraut CL, Blasco MA, Losada A. Cohesin-SA1 deficiency drives aneuploidy and tumourigenesis in mice due to impaired replication of telomeres. EMBO J. 2012;31:2076–89.
De Koninck M, Losada A. Cohesin mutations in cancer. Cold Spring Harb Perspect Med. 2016;6:a026476.
Yuan B, Neira J, Pehlivan D, Santiago-Sim T, Song X, Rosenfeld J, Posey JE, Patel V, ** W, Adam MP, et al. Clinical exome sequencing reveals locus heterogeneity and phenotypic variability of cohesinopathies. Genet Med. 2019;21:663–75.
Rao SS, Huang SC, St Hilaire BG, Engreitz JM, Perez EM, Kieffer-Kwon KR, Sanborn AL, Johnstone SE, Bascom GD, Bochkov ID, Huang X. Cohesin loss eliminates all loop domains. Cell. 2017;171(2):305–20.
Schwarzer W, Abdennur N, Goloborodko A, Pekowska A, Fudenberg G, Loe-Mie Y, Fonseca NA, Huber W, Haering CH, Mirny L, et al. Two independent modes of chromatin organization revealed by cohesin removal. Nature. 2017;551:51–6.
Fudenberg G, Imakaev M, Lu C, Goloborodko A, Abdennur N, Mirny LA. Formation of chromosomal domains by loop extrusion. Cell Rep. 2016;15:2038–49.
Haarhuis JHI, van der Weide RH, Blomen VA, Yáñez-Cuna JO, Amendola M, van Ruiten MS, Krijger PHL, Teunissen H, Medema RH, van Steensel B, et al. The cohesin release factor WAPL restricts chromatin loop extension. Cell. 2017;169:693-707.e14.
de Wit E, Vos ESM, Holwerda SJB, Valdes-Quezada C, Verstegen MJAM, Teunissen H, Splinter E, Wijchers PJ, Krijger PHL, de Laat W. CTCF binding polarity determines chromatin loo**. Mol Cell. 2015;60:676–84.
Parelho V, Hadjur S, Spivakov M, Leleu M, Sauer S, Gregson HC, Jarmuz A, Canzonetta C, Webster Z, Nesterova T, et al. Cohesins functionally associate with CTCF on mammalian chromosome arms. Cell. 2008;132:422–33.
Wendt KS, Yoshida K, Itoh T, Bando M, Koch B, Schirghuber E, Tsutsumi S, Nagae G, Ishihara K, Mishiro T, et al. Cohesin mediates transcriptional insulation by CCCTC-binding factor. Nature. 2008;451:796–801.
Hara K, Zheng G, Qu Q, Liu H, Ouyang Z, Chen Z, Tomchick DR, Yu H. Structure of cohesin subcomplex pinpoints direct shugoshin-Wapl antagonism in centromeric cohesion. Nat Struct Mol Biol. 2014;21:864–70.
Li Y, Haarhuis JHI, Cacciatore ÁS, Oldenkamp R, van Ruiten MS, Willems L, Teunissen H, Muir KW, de Wit E, Rowland BD, et al. The structural basis for cohesin–CTCF-anchored loops. Nature. 2020. https://doi.org/10.1038/s41586-019-1910-z.
van Ruiten MS, van Gent D, Sedeño Cacciatore Á, Fauster A, Willems L, Hekkelman ML, Hoekman L, Altelaar M, Haarhuis JHI, Brummelkamp TR, et al. The cohesin acetylation cycle controls chromatin loop length through a PDS5A brake mechanism. Nat Struct Mol Biol. 2022;29:586–91.
Davidson IF, Bauer B, Goetz D, Tang W, Wutz G, Peters J-M. DNA loop extrusion by human cohesin. Science. 2019;366:1338–45.
Kim Y, Shi Z, Zhang H, Finkelstein IJ, Yu H. Human cohesin compacts DNA by loop extrusion. Science. 2019. https://doi.org/10.1126/science.aaz4475.
Kikuchi S, Borek DM, Otwinowski Z, Tomchick DR, Yu H. Crystal structure of the cohesin loader Scc2 and insight into cohesinopathy. Proc Natl Acad Sci U S A. 2016;113:12444–9.
Petela NJ, Gligoris TG, Metson J, Lee BG, Voulgaris M, Hu B, Kikuchi S, Chapard C, Chen W, Rajendra E, et al. Scc2 is a potent activator of cohesin’s ATPase that promotes loading by binding Scc1 without Pds5. Mol Cell. 2018;70:1134–48.
Busslinger GA, Stocsits RR, Van Der Lelij P, Axelsson E, Tedeschi A, Galjart N, Peters JM. Cohesin is positioned in mammalian genomes by transcription, CTCF and Wapl. Nature. 2017;44:503–7.
Ivanov MP, Ladurner R, Poser I, Beveridge R, Rampler E, Hudecz O, Novatchkova M, Hériché J, Wutz G, van der Lelij P, et al. The replicative helicase MCM recruits cohesin acetyltransferase ESCO2 to mediate centromeric sister chromatid cohesion. EMBO J. 2018;37:e97150.
Rahman S, Jones MJ, Jallepalli PV. Cohesin recruits the Esco1 acetyltransferase genome wide to repress transcription and promote cohesion in somatic cells. Proc Natl Acad Sci U S A. 2015;112:11270–5.
Arruda NL, Carico ZM, Justice M, Liu YF, Zhou J, Stefan HC, Dowen JM. Distinct and overlap** roles of STAG1 and STAG2 in cohesin localization and gene expression in embryonic stem cells. Epigenetics Chromatin. 2020. https://doi.org/10.1186/s13072-020-00353-9.
Cuadrado A, Giménez-Llorente D, Kojic A, Rodríguez-Corsino M, Cuartero Y, Martín-Serrano G, Gómez-López G, Marti-Renom MA, Losada A. Specific contributions of Cohesin-SA1 and Cohesin-SA2 to TADs and Polycomb domains in Embryonic stem cells. Cell Rep. 2019;27:3500-3510.e4.
Kojic A, Cuadrado A, De Koninck M, Giménez-Llorente D, Rodríguez-Corsino M, Gómez-López G, Le Dily F, Marti-Renom MA, Losada A. Distinct roles of cohesin-SA1 and cohesin-SA2 in 3D chromosome organization. Nat Struct Mol Biol. 2018;25:496–504.
Richart L, Lapi E, Pancaldi V, Cuenca-Ardura M, Pau ECDS, Madrid-Mencía M, Neyret-Kahn H, Radvanyi F, Rodríguez JA, Cuartero Y, et al. STAG2 loss-of-function affects short-range genomic contacts and modulates the basal-luminal transcriptional program of bladder cancer cells. Nucleic Acids Res. 2021;49:11005–21.
Remeseiro S, Cuadrado A, Gómez-López G, Pisano DG, Losada A. A unique role of cohesin-SA1 in gene regulation and development. EMBO J. 2012;31:2090–102.
Surdez D, Zaidi S, Grossetête S, Laud-Duval K, Ferre AS, Mous L, Vourc’h, T., Tirode, F., Pierron, G., Raynal, V., et al. STAG2 mutations alter CTCF-anchored loop extrusion, reduce cis-regulatory interactions and EWSR1-FLI1 activity in Ewing sarcoma. Cancer Cell. 2021;39:810-826.e9.
Vian L, Pękowska A, Rao SSP, Kieffer-Kwon KR, Jung S, Baranello L, Huang SC, El Khattabi L, Dose M, Pruett N, et al. The energetics and physiological impact of cohesin extrusion. Cell. 2018;173:1165-1178.e20.
Zuin J, Franke V, van Ijcken WF, van der Sloot A, Krantz ID, van der Reijden MI, Nakato R, Lenhard B, Wendt KS. A cohesin-independent role for NIPBL at promoters provides insights in CdLS. PLoS Genet. 2014;10:e1004153.
Muñoz S, Minamino M, Casas-Delucchi CS, Patel H, Uhlmann F. A role for chromatin remodeling in cohesin loading onto chromosomes. Mol Cell. 2019;74:664-673.e5.
Tedeschi A, Wutz G, Huet S, Jaritz M, Wuensche A, Schirghuber E, Davidson IF, Tang W, Cisneros DA, Bhaskara V, et al. Wapl is an essential regulator of chromatin structure and chromosome segregation. Nature. 2013;501:564–8.
Pugacheva EM, Kubo N, Loukinov D, Tajmul M, Kang S, Kovalchuk AL, Strunnikov AV, Zentner GE, Ren B, Lobanenkov VV. CTCF mediates chromatin loo** via N-terminal domain-dependent cohesin retention. Proc Natl Acad Sci U S A. 2020;117:2020–31.
Liu Y, Dekker J. Biochemically distinct cohesin complexes mediate positioned loops between CTCF sites and dynamic loops within chromatin domains. BioRxiv. 2021. https://doi.org/10.1101/2021.08.24.457555.
Banigan EJ, Tang W, van den Berg AA, Stocsits RR, Wutz G, Brandão HB, Busslinger GA, Peters J-M, Mirny LA. Transcription shapes 3D chromatin organization by interacting with loop extrusion. BioRxiv. 2022. https://doi.org/10.1101/2022.01.07.475367.
Linares-Saldana R, Kim W, Bolar NA, Zhang H, Koch-Bojalad BA, Yoon S, Shah PP, Karnay A, Park DS, Luppino JM, et al. BRD4 orchestrates genome folding to promote neural crest differentiation. Nat Genet. 2021;53:1480–92.
Zhang S, Übelmesser N, Josipovic N, Forte G, Slotman JA, Chiang M, Gothe HJ, Gusmao EG, Becker C, Altmüller J, Houtsmuller AB. RNA polymerase II is required for spatial chromatin reorganization following exit from mitosis. Sci Adv. 2021. https://doi.org/10.1126/sciadv.abg8205.
Zhu Y, Denholtz M, Lu H, Murre C. Calcium signaling instructs NIPBL recruitment at active enhancers and promoters via distinct mechanisms to reconstruct genome compartmentalization. Genes Dev. 2021;35:65–81.
Bastié N, Chapard C, Dauban L, Gadal O, Beckouët F, Koszul R. Smc3 acetylation, Pds5 and Scc2 control the translocase activity that establishes cohesin-dependent chromatin loops. Nat Struct Mol Biol. 2022;29:575–85.
Nora EP, Caccianini L, Fudenberg G, So K, Kameswaran V, Nagle A, Uebersohn A, Hajj B, Saux AL, Coulon A, et al. Molecular basis of CTCF binding polarity in genome folding. Nat Commun. 2020. https://doi.org/10.1038/s41467-020-19283-x.
Ouyang Z, Zheng G, Tomchick DR, Luo X, Yu H. Structural basis and IP requirement for Pds5-dependent cohesin dynamics. Mol Cell. 2016;62:248–59.
Heath H, De Almeida CR, Sleutels F, Dingjan G, Van De Nobelen S, Jonkers I, Ling KW, Gribnau J, Renkawitz R, Grosveld F, et al. CTCF regulates cell cycle progression of αβ T cells in the thymus. EMBO J. 2008;27:2839–50.
Serrano A, Rodriguez-Corsino M, Losada A. Heterochromatin protein 1 (HP1) proteins do not drive pericentromeric cohesin enrichment in human cells. PLoS ONE. 2009;4: e5118.
Mendez J, Stillman B. Chromatin association of human origin recognition complex, cdc6, and minichromosome maintenance proteins during the cell cycle: assembly of prereplication complexes in late mitosis. Mol Cell Biol. 2000;20:8602–12.
Ladurner R, Kreidl E, Ivanov MP, Ekker H, Idarraga-Amado MH, Busslinger GA, Wutz G, Cisneros DA, Peters J. Sororin actively maintains sister chromatid cohesion. EMBO J. 2016;35:635–53.
Langmead B, Salzberg SL. Fast gapped-read alignment with Bowtie 2. Nat Methods. 2012;9:357–9.
Zhang Y, Liu T, Meyer CA, Eeckhoute J, Johnson DS, Bernstein BE, Nusbaum C, Myers RM, Brown M, Li W, et al. Model-based analysis of ChIP-Seq (MACS). Genome Biol. 2008;9:R137.
Machanick P, Bailey TL. MEME-ChIP: motif analysis of large DNA datasets. Bioinformatics. 2011;27:1696–7.
Hu B, Petela N, Kurze A, Chan KL, Chapard C, Nasmyth K. Biological chromodynamics: A general method for measuring protein occupancy across the genome by calibrating ChIP-seq. Nucleic Acids Res. 2015;43:e132.
Ramírez F, Ryan DP, Grüning B, Bhardwaj V, Kilpert F, Richter AS, Heyne S, Dündar F, Manke T. deepTools2: a next generation web server for deep-sequencing data analysis. Nucleic Acids Res. 2016;44:W160–5.
Ernst J, Kellis M. ChromHMM: automating chromatin-state discovery and characterization. Nat Methods. 2012;9:215–6.
Graña O, Rubio-Camarillo M, Fdez-Riverola F, Pisano DG, Glez-Peña D. Nextpresso: next generation sequencing expression analysis pipeline. Curr Bioinform. 2018;13:583–91.
Anders S, Pyl PT, Huber W. HTSeq–a Python framework to work with high-throughput sequencing data. Bioinformatics. 2015;31:166–9.
Acknowledgements
We thank Niels Galjart (Erasmus MC) for allowing us to use the Ctcf f/f allele generated in his group and Miguel Manzanares (CBMSO) for providing a clone of MEFs homozygous for this allele. We also acknowledge the contribution of Miriam Rupprecht (Msc student from University of Tübingen) to the characterization of GFP-tagged cohesin clones.
Funding
This work has been funded by the Spanish Ministry of Science, Innovation and Universities and FEDER funds (grants BFU2013-48481-R and BFU2016-79841-R to A.L.; BES-2014-069166 and BES-2012-055441 fellowships to M.D.K. and M.R-T) and project PID2019-106499RB-I00, funded by the Agencia Estatal de Investigación (AEI/10.13039/501100011033), Ministerio de Ciencia e Innovación. DG-Ll is currently supported by AECC (Spanish Association Against Cancer).
Author information
Authors and Affiliations
Contributions
AC, MDK, MR-T and MR-C performed experiments; DG-Ll and AK analyzed NGS data; AL designed and supervised the study and wrote the manuscript with help from the other authors. All authors read and approved the final manuscript.
Corresponding author
Ethics declarations
Ethics approval and consent to participate
All procedures involving animals have been revised and approved by the required authorities (Comunidad Autónoma de Madrid).
Competing interests
The authors declare no competing interests.
Additional information
Publisher's Note
Springer Nature remains neutral with regard to jurisdictional claims in published maps and institutional affiliations.
Supplementary Information
Additional file 1
: Figure. S1 Characterization of conditional KO MEFs. a-c. Immunoblot analyses of whole cell extracts of WT and Stag2 KO (a), Pds5 DKO (b) and Ctcf KO (c) MEFs used for ChIP analyses. Increasing number of WT cells (expressed as %) were loaded to quantitate the extent of depletions in the KOs. In b, the same membrane was incubated first with anti-PDS5B and then with anti-PDS5A. The asterisk indicates previous signal from PDS5B. In c, a scheme of the experimental set up used for CTCF depletion in quiescent MEFs is also included. Figure. S2 Distribution of cohesin subunits and regulators along the genome. Snapshots of the UCSC genome browser at several loci that contain neighboring CTCF and non-CTCF cohesin sites. Examples of non-CTCF cohesin positions that are bound by RNA polymerase II or not are shown in top and bottom rows, respectively. A track showing SMC1 in Stag2 KO cells is also included (in red). Figure. S3 Transcription factor motifs at non-CTCF cohesin sites. STREME analysis showing the most statistically significant motifs enriched in non-CTCF cohesin positions in different cell lines. Percentages next to p-values represent the fraction of positions containing each motif. Logos on the right correspond to transcription factor binding sites statistically associated with those motifs that are shared among different cell lines. Figure. S4 GFP-tagged cohesin subunits form complexes and bind to chromatin. a. Polyclonal populations of iMEFs expressing GFP-tagged versions of RAD21, STAG1 or STAG2 were pre-extracted before fixation and stained with SMC1 (red) and DAPI (blue). Cells showing the corresponding GFP-tagged protein bound to chromatin are encircled. These cells were used in iFRAP analyses shown in Fig. 3c. b. Immunoblot analyses of whole cell extracts of these iMEFs. c. Chromatin fractionation analyses confirm that the tagged proteins are bound to chromatin. d. Immunoprecipitation reactions with SMC1 antibodies (or IgG as negative control) show the incorporation of GFP-tagged proteins in to cohesin complexes. For RAD21-GFP iMEFs, see Morales et al. [5]. Figure. S5 PDS5 proteins and cohesin distribution. a. Matrix showing the correlation between the genome-wide distributions of the indicated proteins (called peaks). b. Heatmaps showing the distribution of SMC1 in MEFs lacking PDS5A or PDS5B. c. Snapshots of the genome browser showing ChIP-seq data for SMC1 in WT and Pds5 DKO MEFs in regions that were validated by ChIP-qPCR. Graphs represent fold enrichment of the ChIP signal in each region (r1 to r14) over a neighbor negative region (neg). Figure. S6 Distribution of cohesin subunits in non-CTCF and CTCF positions after depletion of regulators. Read density plots for the heatmaps shown in Fig. 5, separating the four clusters defined in Fig. 4. Cluster 1, non-CTCF cohesin positions; cluster 2, CTCF cohesin sites with high NIPBL and low PDS5; cluster 3, CTCF cohesin sites with high NIPBL, PDS5 and CTCF; cluster 4, CTCF cohesin with low NIPBL
Additional file 2:
Table S1. Genomic datasets. Table S2. Antibodies. Table S3. Primers for CRISPR. Table S4. Primers for ChIP-qPCR.
Additional file 3
: Movie S1. STAG1-GFP iFRAP.
Additional file 4
: Movie S2. STAG2-GFP iFRAP.
Additional file 5
: Movie S3. RAD21-GFP iFRAP.
Rights and permissions
Open Access This article is licensed under a Creative Commons Attribution 4.0 International License, which permits use, sharing, adaptation, distribution and reproduction in any medium or format, as long as you give appropriate credit to the original author(s) and the source, provide a link to the Creative Commons licence, and indicate if changes were made. The images or other third party material in this article are included in the article's Creative Commons licence, unless indicated otherwise in a credit line to the material. If material is not included in the article's Creative Commons licence and your intended use is not permitted by statutory regulation or exceeds the permitted use, you will need to obtain permission directly from the copyright holder. To view a copy of this licence, visit http://creativecommons.org/licenses/by/4.0/. The Creative Commons Public Domain Dedication waiver (http://creativecommons.org/publicdomain/zero/1.0/) applies to the data made available in this article, unless otherwise stated in a credit line to the data.
About this article

Cite this article
Cuadrado, A., Giménez-Llorente, D., De Koninck, M. et al. Contribution of variant subunits and associated factors to genome-wide distribution and dynamics of cohesin. Epigenetics & Chromatin 15, 37 (2022). https://doi.org/10.1186/s13072-022-00469-0
Received:
Accepted:
Published:
DOI: https://doi.org/10.1186/s13072-022-00469-0