Abstract
Deep learning shows great promise for medical image analysis but often lacks explainability, hindering its adoption in healthcare. Attribution techniques that explain model reasoning can potentially increase trust in deep learning among clinical stakeholders. In the literature, much of the research on attribution in medical imaging focuses on visual inspection rather than statistical quantitative analysis.
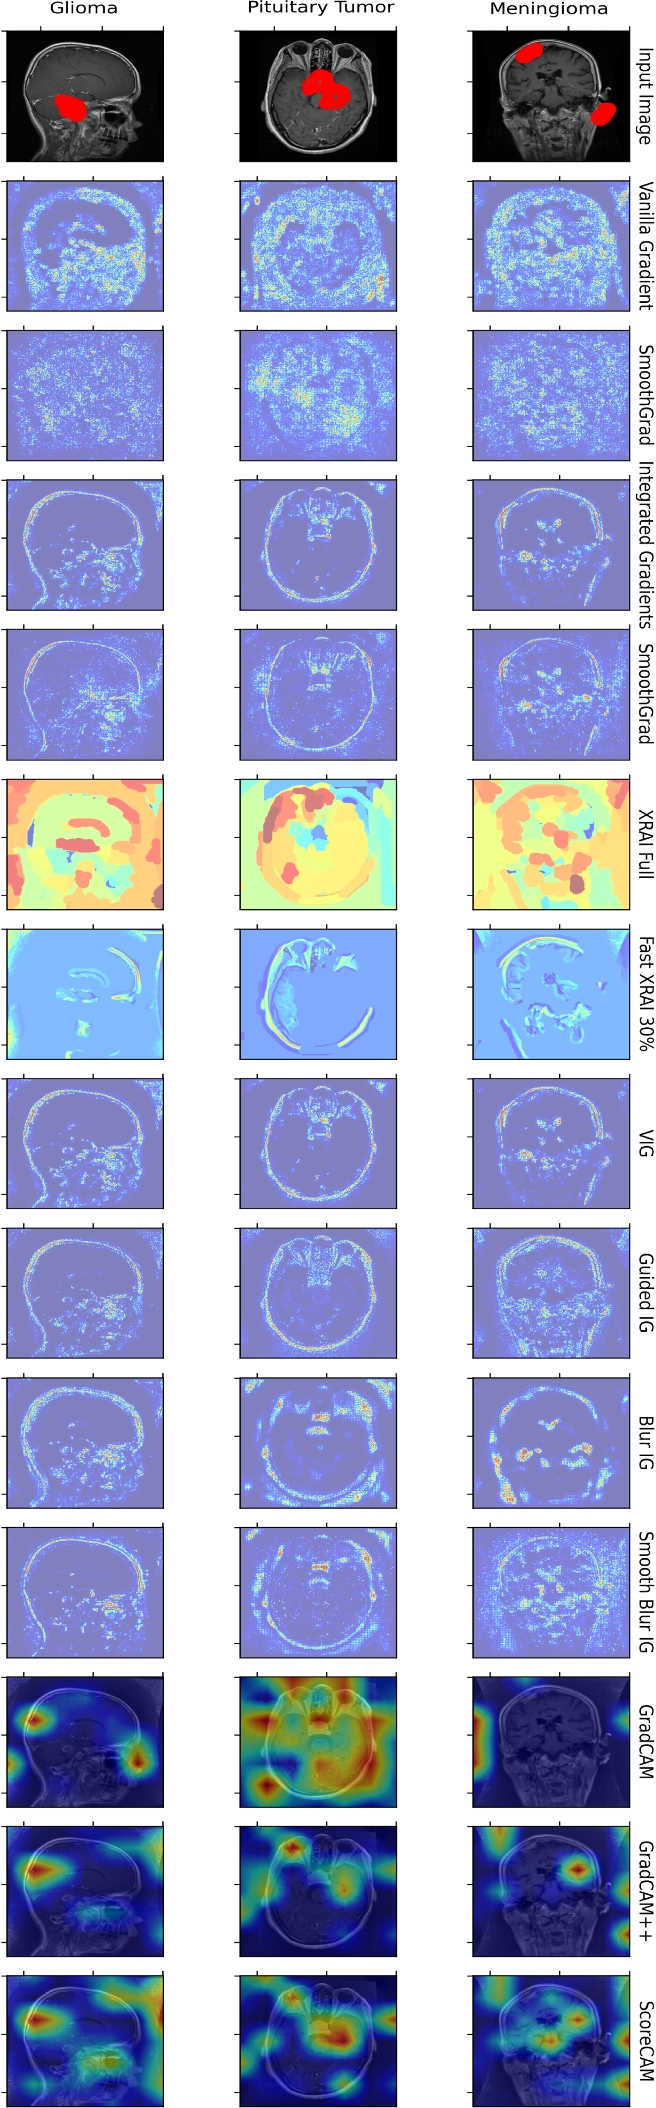
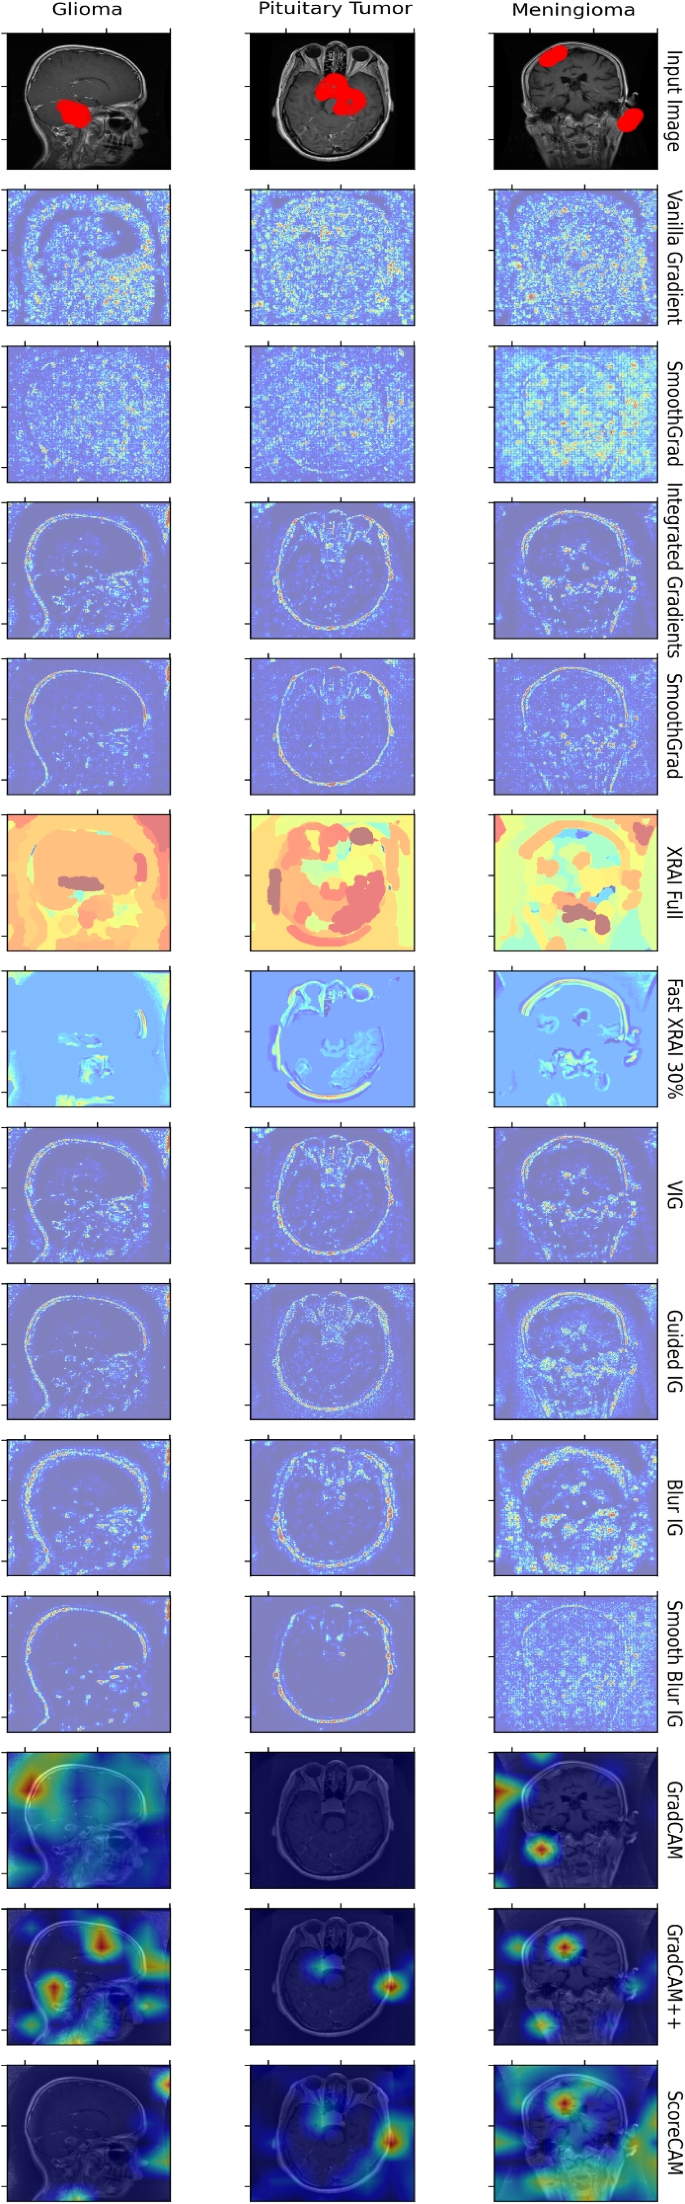
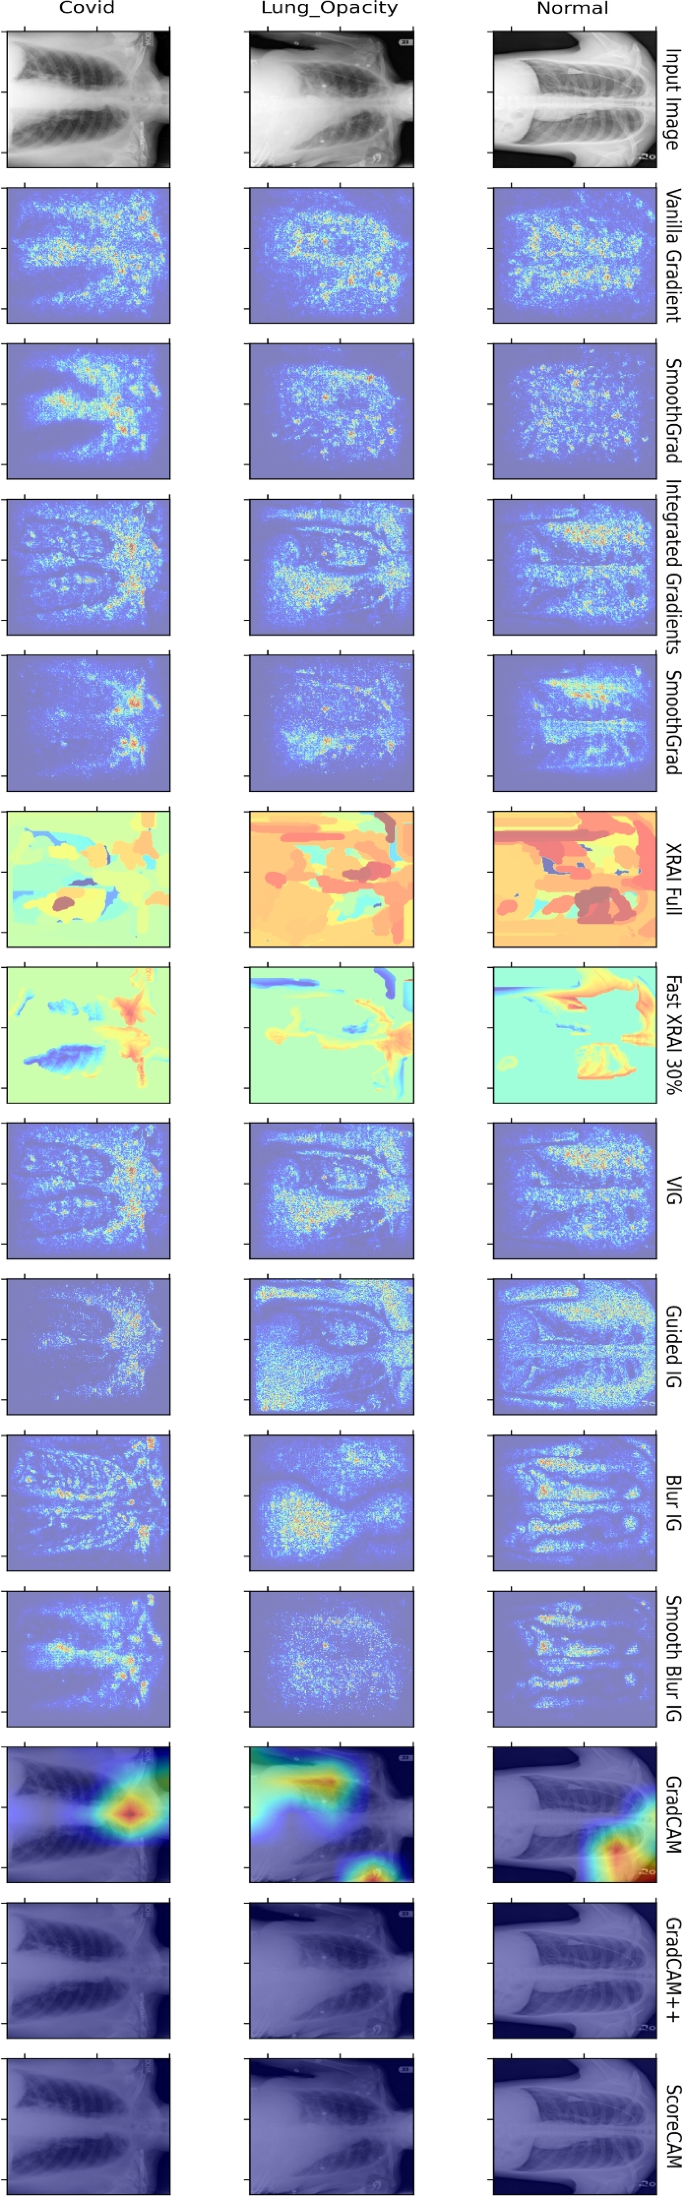
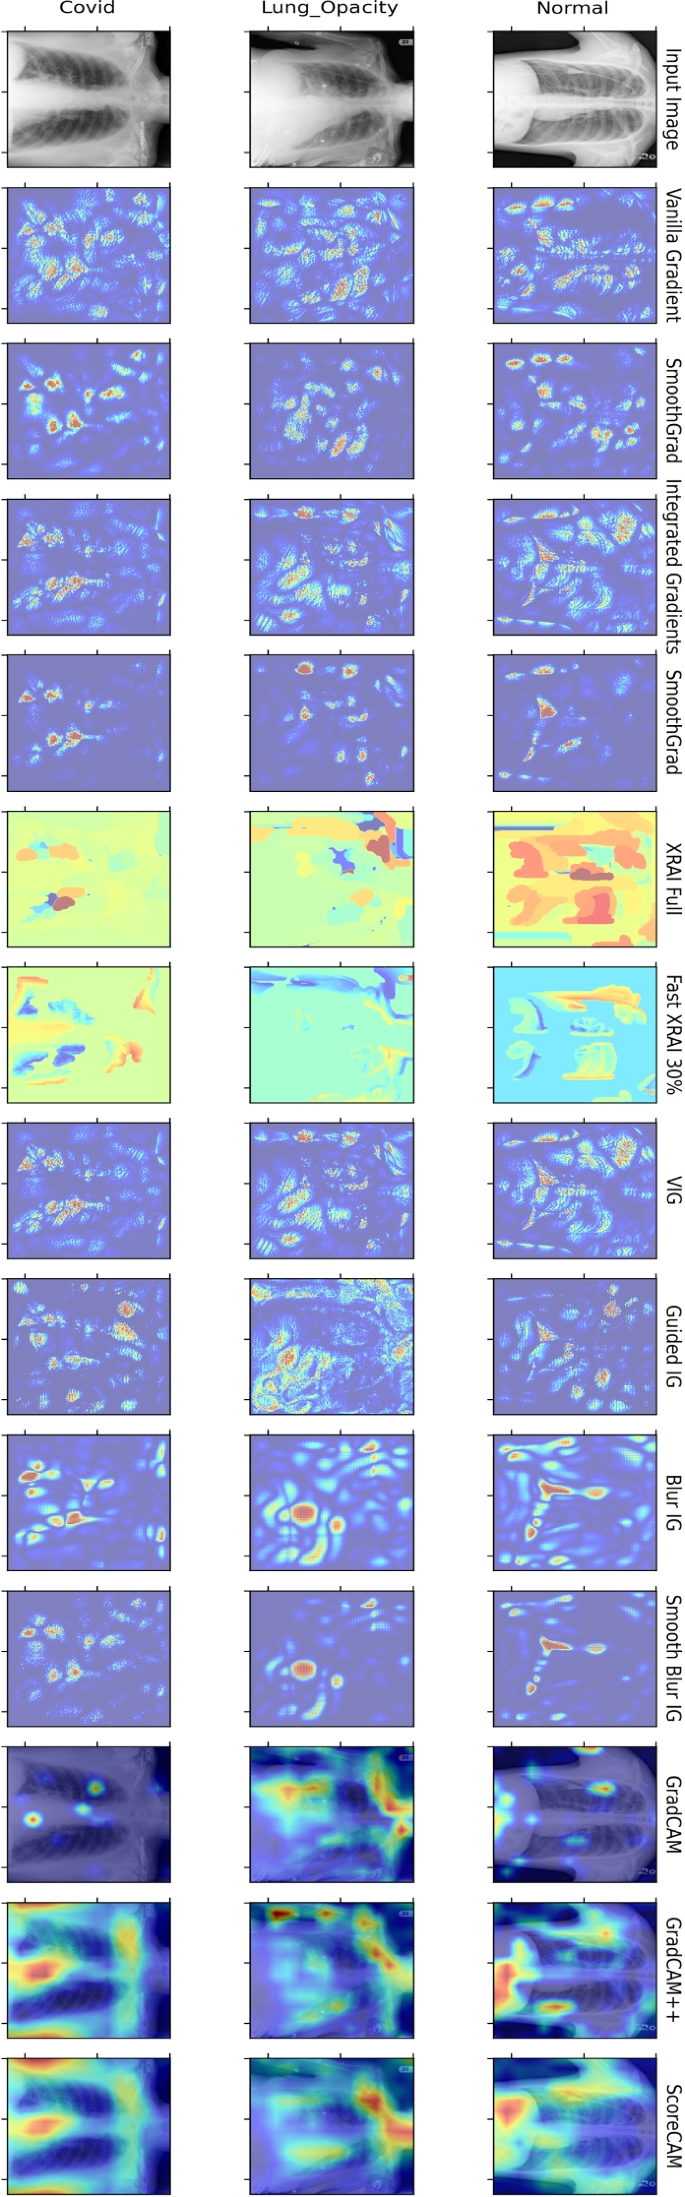
In this paper, we proposed an image-based saliency framework to enhance the explainability of deep learning models in medical image analysis. We use adaptive path-based gradient integration, gradient-free techniques, and class activation map** along with its derivatives to attribute predictions from brain tumor MRI and COVID-19 chest X-ray datasets made by recent deep convolutional neural network models.
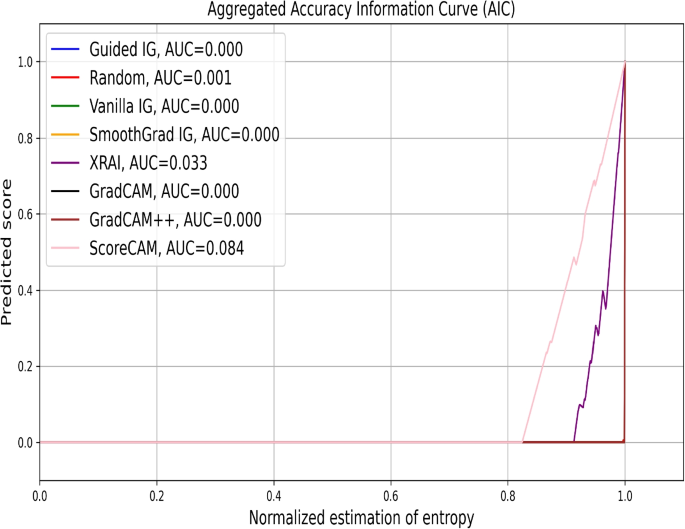
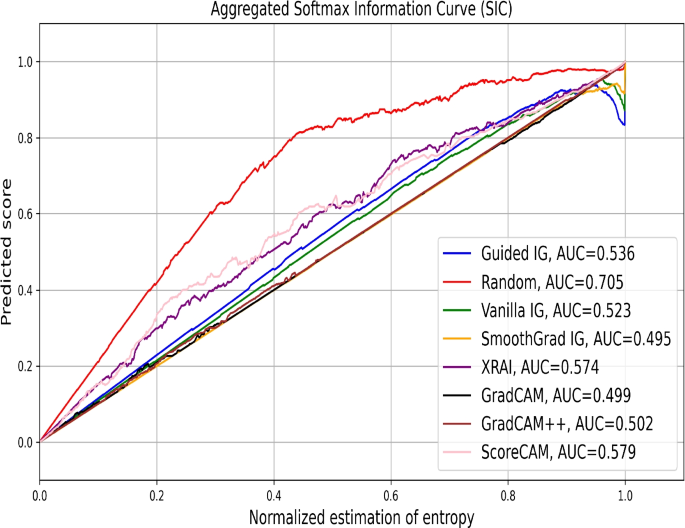
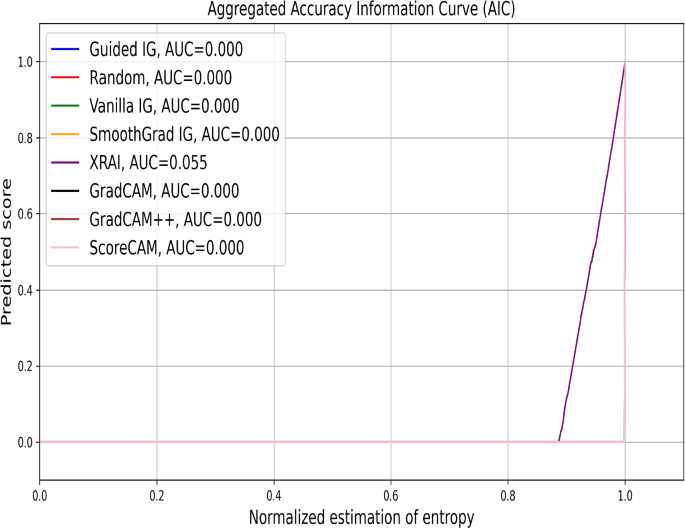
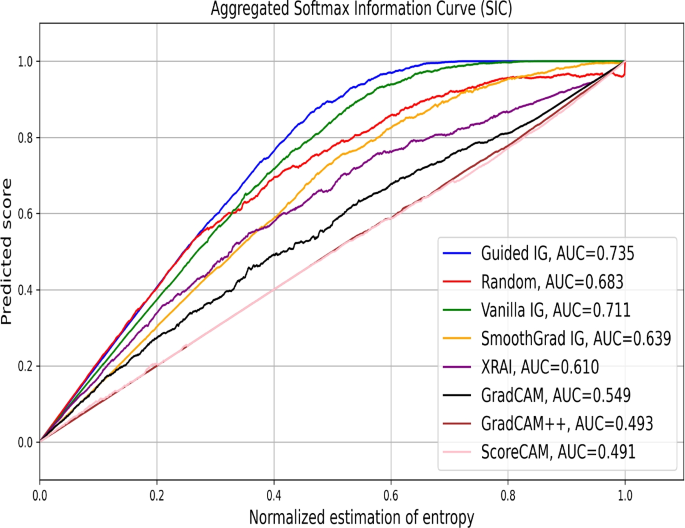
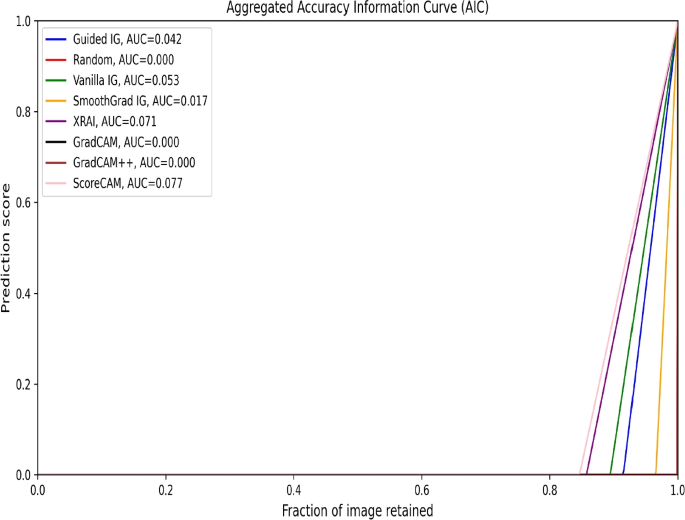
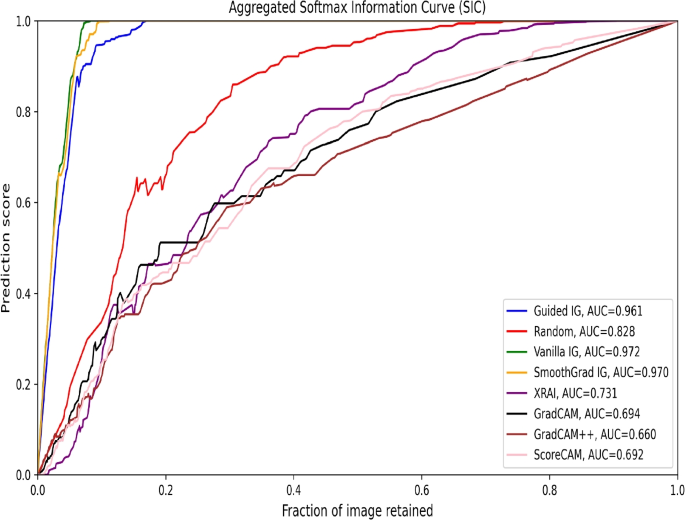
The proposed framework integrates qualitative and statistical quantitative assessments, employing Accuracy Information Curves (AICs) and Softmax Information Curves (SICs) to measure the effectiveness of saliency methods in retaining critical image information and their correlation with model predictions. Visual inspections indicate that methods such as ScoreCAM, XRAI, GradCAM, and GradCAM++ consistently produce focused and clinically interpretable attribution maps. These methods highlighted possible biomarkers, exposed model biases, and offered insights into the links between input features and predictions, demonstrating their ability to elucidate model reasoning on these datasets. Empirical evaluations reveal that ScoreCAM and XRAI are particularly effective in retaining relevant image regions, as reflected in their higher AUC values. However, SICs highlight variability, with instances of random saliency masks outperforming established methods, emphasizing the need for combining visual and empirical metrics for a comprehensive evaluation.
The results underscore the importance of selecting appropriate saliency methods for specific medical imaging tasks and suggest that combining qualitative and quantitative approaches can enhance the transparency, trustworthiness, and clinical adoption of deep learning models in healthcare. This study advances model explainability to increase trust in deep learning among healthcare stakeholders by revealing the rationale behind predictions. Future research should refine empirical metrics for stability and reliability, include more diverse imaging modalities, and focus on improving model explainability to support clinical decision-making.
Background
The field of medical image analysis has seen significant advancements in explainability methods for deep learning (DL) models, driven by the imperative for trustworthy artificial intelligence systems in healthcare [1]. Traditional medical imaging modalities like Computed Tomography (CT), Magnetic Resonance Imaging (MRI), Functional Magnetic Resonance Imaging (fMRI), Positron Emission Tomography (PET), Mammography, Ultrasound, and X-ray play a crucial role in disease detection and diagnosis, often relying on the expertise of radiologists and physicians [2]. However, the healthcare field faces a growing demand for skilled professionals, leading to potential fatigue and highlighting the need for computer-aided diagnostic (CAD) tools. The rapid advancements in DL architectures and compute have fueled significant progress in automated medical image analysis [3,4,5,6,13,14,15]. While CBMs are robust to noise and compression artifacts, their training is complex, particularly for the large and diverse datasets typical of medical imaging. Counterfactual explanation methods generate pseudo-realistic perturbations of input images to produce opposite predictions, aiming to identify influential features for the model’s original prediction. However, generating realistic perturbations for medical images, which often contain subtle anatomical details, is challenging and can lead to misleading explanations [16,17,18,19,20,21,22,23]. Unrealistic perturbations compromise the trustworthiness of these explanations. Another approach involves visualizing internal network representations of learned features in CNN kernels [24]. Interpreting these feature maps in the context of medical image analysis is difficult due to the abstract nature of the features learned by DL models [25, 26]. This abstraction challenges human experts in deriving clinically meaningful insights.
Attribution maps are visual representations that highlight regions of an image most relevant to the predictions made by a DL model. Serving as potent post-hoc explainability tools, these maps provide crucial insights into how models make decisions based on input images. Several studies have demonstrated the application of attribution maps in medical imaging tasks. For instance, Bohle et al. [27] utilized layer-wise relevance propagation to elucidate deep neural network decisions in MRI-based Alzheimer’s disease classification. Camalan et al. [28] employed a deep CNN-based Grad-CAM approach for classifying oral lesions in clinical photographs. Similarly, Kermany et al. [29] applied Grad-CAM for oral dysplasia classification. Shi et al. presented an explainable attention-based model for COVID-19 automatic diagnosis, showcasing the integration of attention mechanisms to improve explainability in radiographic imaging [30]. Another study by Shi et al. introduced an attention transfer deep neural network for COVID-19 automatic diagnosis, further enhancing the explainability and performance of diagnostic models [31]. Recently, Nhlapho et al. [32] presented an overview of select image-based attribution methods for brain tumor detection, though their approach lacked ground-truth segmentation masks and did not quantitatively evaluate the chosen saliency methods.
Building on these efforts, our research leverages both gradient-based and gradient-free image-based saliency methods. However, the deployment of attribution maps alone is insufficient for establishing comprehensive model explainability. A rigorous evaluation framework is essential. We propose a comprehensive evaluation framework that extends beyond qualitative assessment. This framework includes metrics specifically designed to evaluate image-based saliency methods. By incorporating performance information curves (PICs) such as Accuracy Information Curves (AICs) and Softmax Information Curves (SICs), we objectively assess the correlation between saliency map intensity and model predictions. This robust evaluation aims to enhance the transparency and trustworthiness of DL models in clinical settings. Given this context, this paper centers on How effective are state-of-the-art (SoTA) image-based saliency methods in aiding the explainability of DL models for medical image analysis tasks? By investigating this question, we aim to contribute to the broader effort of enhancing the trustworthiness, transparency, and reliability of DL applications in healthcare.
To this end, we leverage the proposed framework to systematically analyze model predictions on brain tumor MRI [33] and COVID-19 chest X-ray [34] datasets. Resulting attribution maps highlight the salient features within the input images that most significantly influence the model’s predictions. By evaluating these techniques both qualitatively and quantitatively across different SoTA DL architectures and the aforementioned medical imaging modalities, we aim to assess their effectiveness in promoting explainability. Our assessment is focused on several key aspects:
-
Clarity of Insights: Do these saliency methods provide clear non-spurious and explainable insights into the relationship between medical image features and model predictions? We achieve this assessment by comparing the highlighted features in the attribution maps with the known anatomical structures and disease signatures relevant to the specific medical imaging task (e.g., brain tumor location in MRI).
-
Biomarker Identification: Can these techniques aid in identifying potential biomarkers for disease detection or classification? We investigate whether the saliency methods consistently highlight specific image features that correlate with known or emerging disease biomarkers. This analysis can provide valuable insights into potential new avenues for clinical research.
-
Model Bias Detection: Do saliency methods help uncover potential biases within the DL used for medical image analysis? We explore whether the saliency maps reveal a consistent focus on irrelevant features or artifacts that might not be clinically meaningful. This analysis can help identify potential biases in the training data or model architecture that may require mitigation strategies.
-
Quantitative Effectiveness: How quantitatively effective are these methods in capturing the relationship between image features and model predictions? We explore this by employing PICs such as AICs and SICs. These metrics assess the correlation between the saliency map intensity and the model’s accuracy or class probabilities.
Contributions
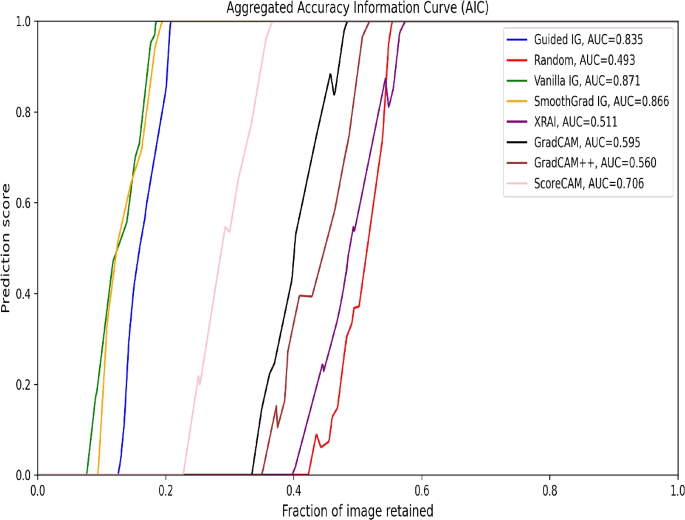
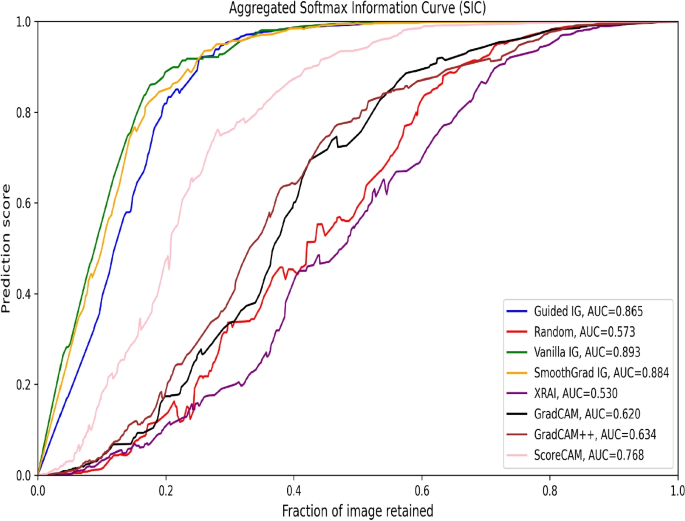
We proposed a comprehensive framework to evaluate SoTA image-based saliency methods applied to Deep Convolutional Neural Networks (CNNs) for medical image classification tasks. Our study included MRI and X-ray modalities, focusing on tasks such as brain tumor classification and COVID-19 detection within these respective imaging techniques. For a novel quantitative evaluation, beyond the visual inspection of saliency maps, we used AICs and SICs to measure the effectiveness of the saliency methods. AICs measure the relationship between the model’s predicted accuracy and the intensity of the saliency map. A strong correlation between high-intensity areas on the saliency map and high model accuracy indicates that the method effectively emphasizes relevant image features. Meanwhile, SICs examine the link between the saliency map and the model’s class probabilities (softmax outputs). An effective saliency method should highlight areas that guide the model toward the correct classification, corresponding to the disease’s localized region in the image.
To our knowledge, this study is the first empirical investigation that uses AICs and SICs to assess saliency methods in medical image analysis using DL. This offers a solid and objective framework for determining the efficacy of saliency methods in elucidating the decision-making mechanisms of DL models for classification and detection tasks in medical imaging.
Paper outline
The paper is organized as follows. Materials and methods section describes the materials and methods employed in this paper. Results section presents experimental results on two datasets. Conclusion section concludes and proposes future directions.
Materials and methods
This section introduces the deep CNN models used for conducting experiments. We also detail the training process for these models and present our proposed framework, which provides an in-depth explanation of image-based saliency methods and their direct applications to DL-based models in medical image analysis.
Datasets
We use two medical image data modalities to test the attribution framework. The choice of the two modalities depends on the availability of data. Other types of modalities are also applicable to the attribution framework. We leave this for future work.
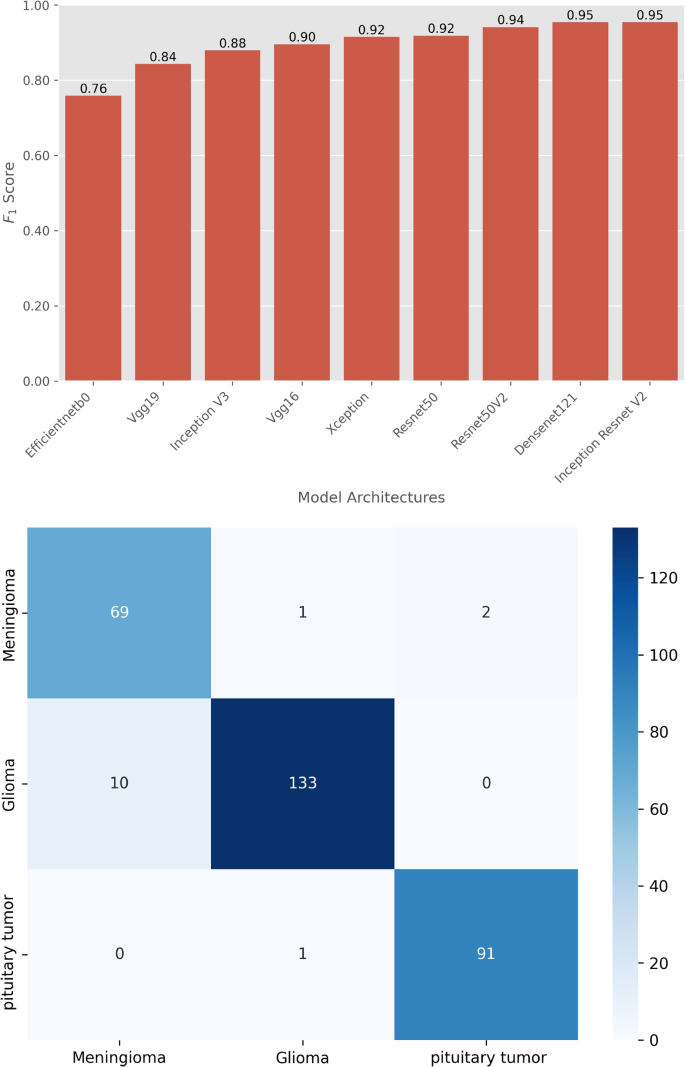
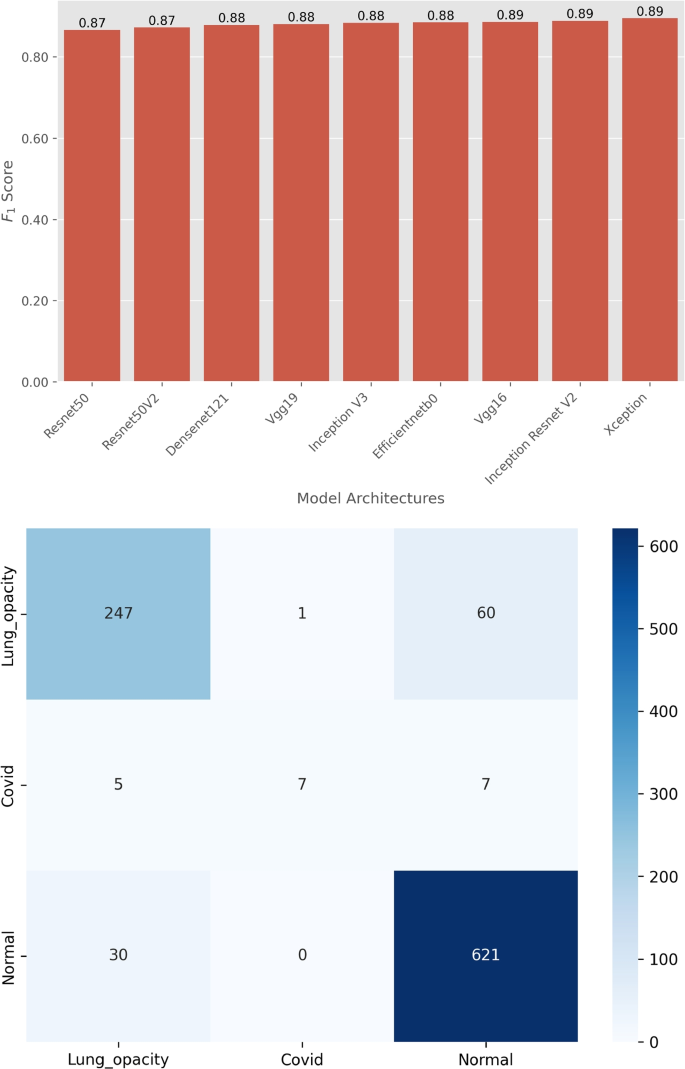
The brain tumors MRI dataset [33] is used. MRI data typically comprises a 3D tensor. However, the dataset provided in [33] is transformed from 3D tensors into 2D slices. Specifically, it includes contrast-enhanced MRI (CE-MRI) T1-weighted images, amounting to 3064 slices obtained from 233 patients. It includes 708 Meningiomas, 1426 Gliomas, and 930 Pituitary tumors. In each slice, the tumor boundary is manually delineated and verified by radiologists. We have plotted 16 random samples from the three classes with tumor borders depicted in red as shown in Fig. 1. These 2D slices of T1-weighted images train standard deep CNNs for a 3-class classification task into Glioma, Meningioma, and Pituitary tumors. The input to each model is a \(\mathbb {R}^{225\times 225\times 1}\) tensor that is a resized version of the original \(\mathbb {R}^{512\times 512}\) image slices primarily due to computational concerns. Unlike the brain cancer MRI dataset which comes with segmentation masks from experts in the field, the COVID-19 X-ray dataset [34] used in this work has no ground truth segmentation masks. This was chosen as an edge-case analysis because a vast majority of datasets do not have segmentation masks. This dataset was curated from multiple international COVID-19 X-ray testing facilities during several periods. The dataset is made up of an unbalanced percentage of the four classes in which we have 48.2 \(\%\) normal X-ray images, 28.4 \(\%\) cases with lung opacity, 17.1 \(\%\) of COVID-19 patients and \(6.4\%\) of patients with viral pneumonia of the 19,820 total images in the dataset. This unbalanced nature of the dataset comes with its classification challenges, which has prompted several researchers to implement DL methods to classify the dataset. Out of the four classes, for consistency with the other datasets used in this work, we choose to classify three classes (i.e., Normal, Lung Opacity, and COVID-19). For an in-depth discussion of works that deal with this dataset, we refer to [35]. Figure 2 shows 16 selected random samples. Table 1 summarizes those three datasets.
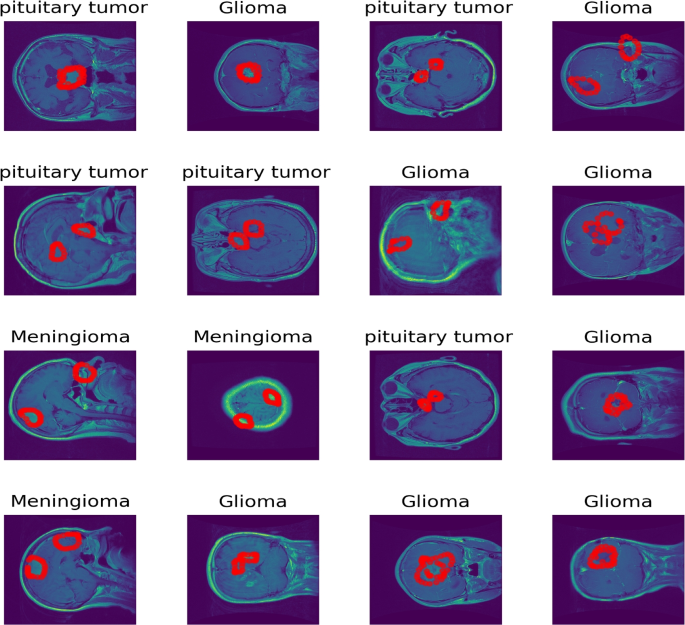
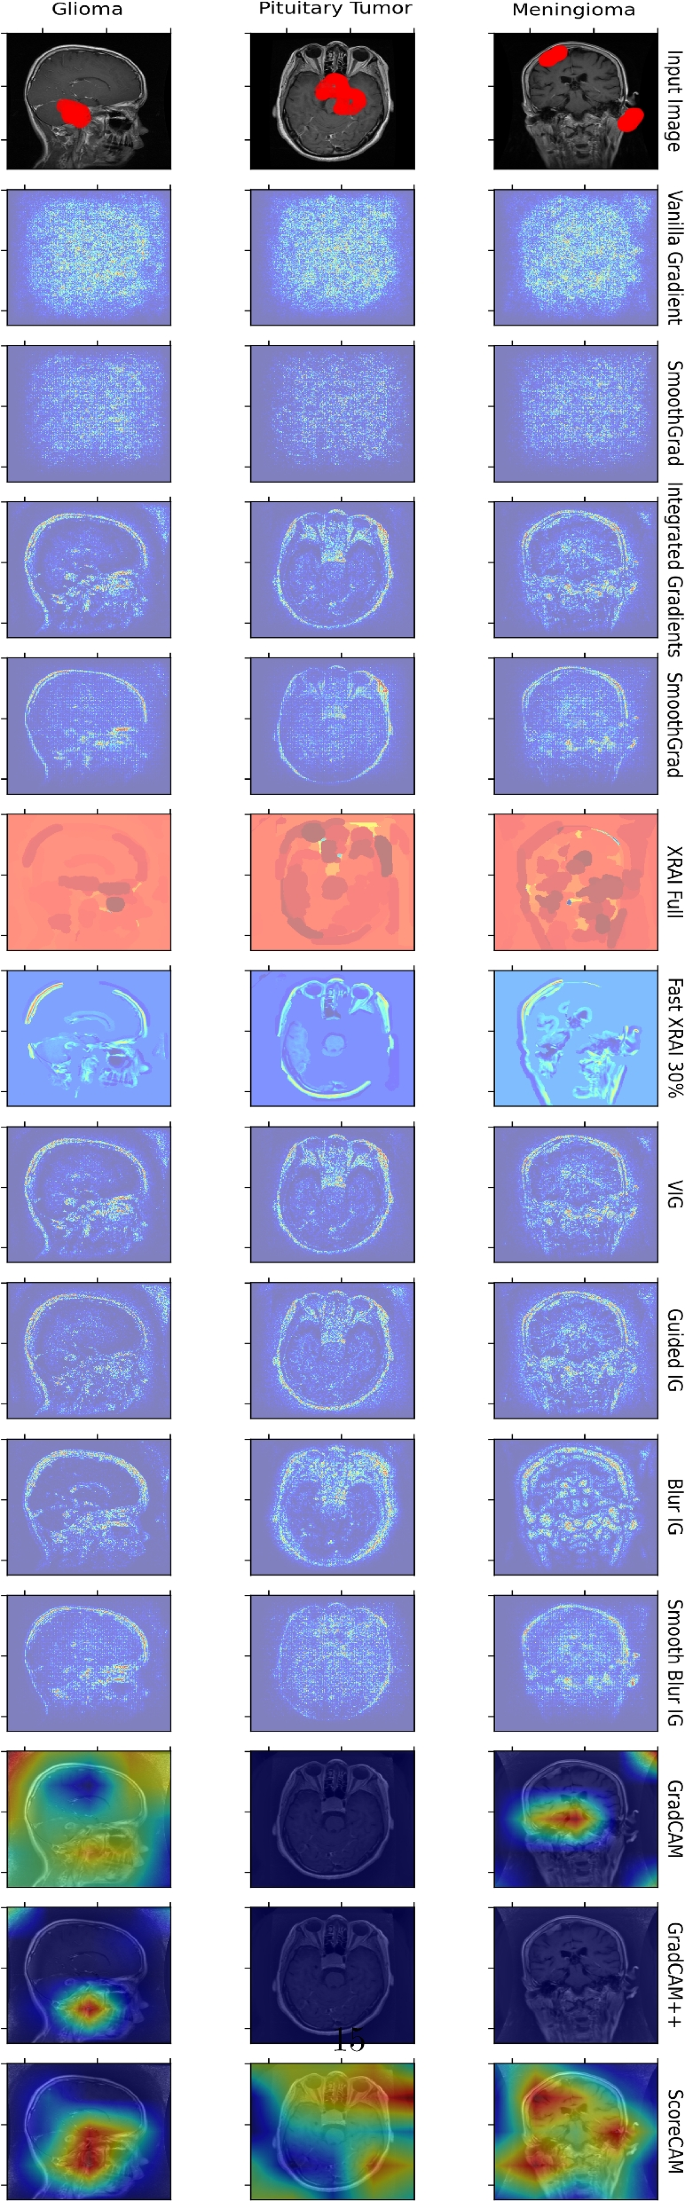
MRI Scans of Various Brain Tumors with Annotated Tumor Regions. This figure shows MRI images of different brain tumor types, with the tumor region boundaries highlighted in red. The tumor types include pituitary tumors, gliomas, and meningiomas. Each image presents a different view (axial, sagittal, or coronal) of the brain, illustrating the diversity in tumor appearance and location
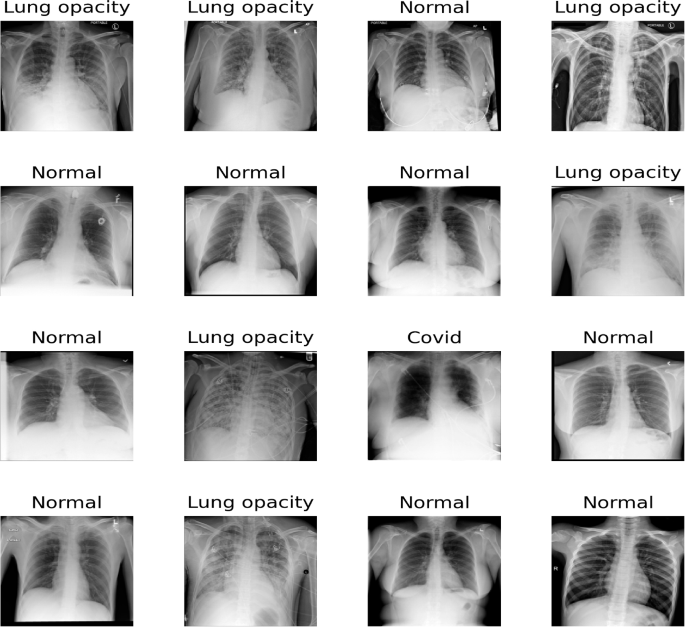
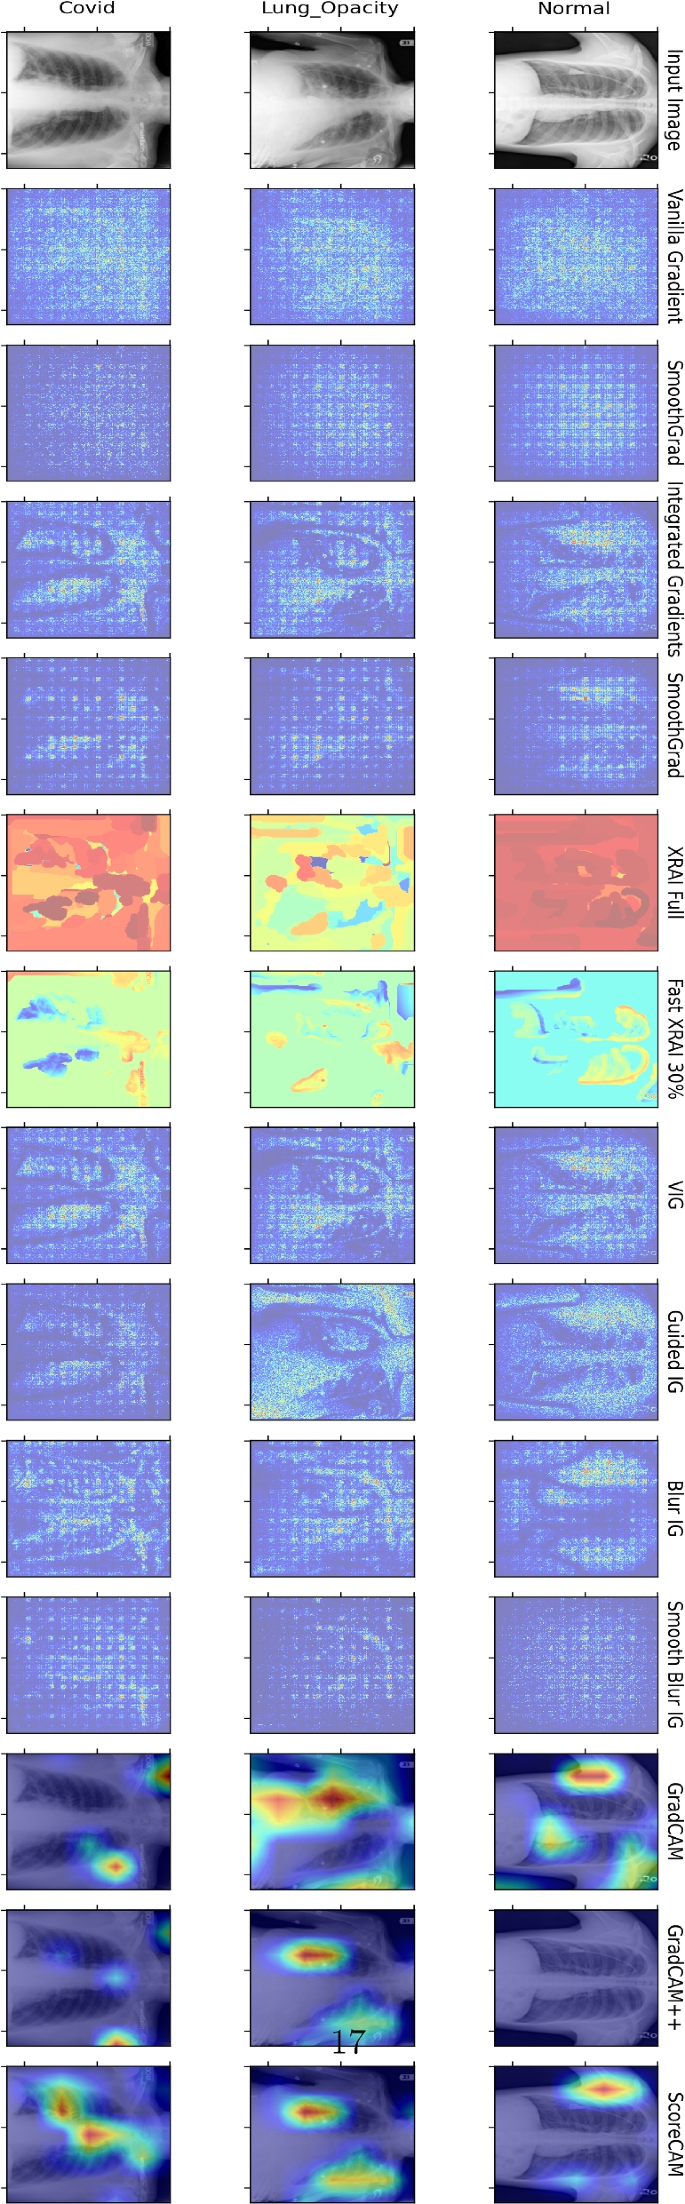
Sample chest X-ray images from the dataset used in this study, labeled with their respective conditions. The conditions include Normal, Lung opacity, and Covid. The dataset was curated from multiple international COVID-19 X-ray testing centers during several periods. The diversity in conditions showcases the varying features that the models need to identify for accurate classification
Deep learning architectures
We use 9 standard CNN architectures: Visual Geometric Group (VGG16 and VGG19 [\(h(\cdot )\) is utilized with an attribution operator \(A_h\) to attribute salient features \(\hat{\textbf{x}}\) of the input image. \(A_h\) is an operator that can be used with varied different architectures. This proposed framework is general and can be applied to any problem instances where explainability is vital
The saliency methods evaluated include both gradient-based and gradient-free techniques. Adaptive path-based integrated gradients (APMs), which are gradient-based, are useful in reducing noise in attribution maps, which is critical for medical imaging diagnostics. Gradient-free techniques do not rely on model gradients, making them suitable for non-differentiable models or scenarios where gradients are noisy. Class Activation Map** (CAM) and its derivatives are effective in highlighting high-level activations for visual localization, providing clear insights into decision-making processes. Each method’s distinct characteristics justify their inclusion and comparison in this study, aimed at enhancing diagnostic and patient outcomes in medical imaging.
The specific saliency methods employed in this study include several prominent techniques. Vanilla Gradient [40] computes the gradient of the output with respect to the input image, highlighting the most influential pixels for the target class prediction. Integrated Gradients (IG)[39], which are gradient-based, attribute the model’s prediction to its input features by integrating the gradients along the path from a baseline to the input image. SmoothGrad IG [\(A_h\), which could be any of the saliency methods, to attribute salient features \(\hat{\textbf{x}}\) of the input image. This operator \(A_h\) is versatile and can be applied to any problem where explainability is essential for building trust in the model’s inference mechanism.
Quantitative and empirical assessment of saliency methods
In this work, we adapted and applied empirical methods from Kapishnikov et al. (2021) [42] for evaluating saliency frameworks in the field of medical image analysis, making slight adjustments to the image entropy calculation. Our adaptation maintained the core approach of using saliency methods to attribute importance to regions within medical images while tailoring them to meet the specific demands of medical imaging.
Our method for estimating image entropy involves computing the Shannon entropy of the image histogram. We begin by deriving the histogram of the original image with 256 bins and density normalization, followed by using the entropy computation as shown in Equation 1. In contrast, their method estimates image entropy by determining the file size of the image after lossless compression and calculating the buffer length as a proxy for entropy. While both approaches aim to gauge the information content of an image, ours relies on pixel intensity distribution, while theirs assesses file size post-compression.
where, H(X) represents the entropy of the image X, \(p_i\) is the probability of occurrence of each intensity level i in the image histogram, and n is the total number of intensity levels (256 in our case).
Our approach provides a direct measure of the information content inherent in the pixel intensity distribution, capturing the relative importance of different intensity levels and offering a comprehensive understanding of the image’s complexity. In contrast, using file size post-compression as a proxy for entropy may not fully capture the nuances of the image’s content. By focusing on pixel intensity distribution, our approach offers a more intrinsic and nuanced measure of image information content, particularly crucial for tasks such as medical image analysis or pattern recognition.
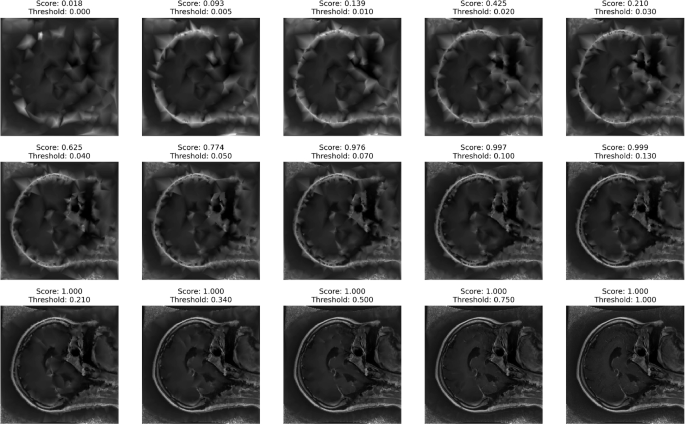
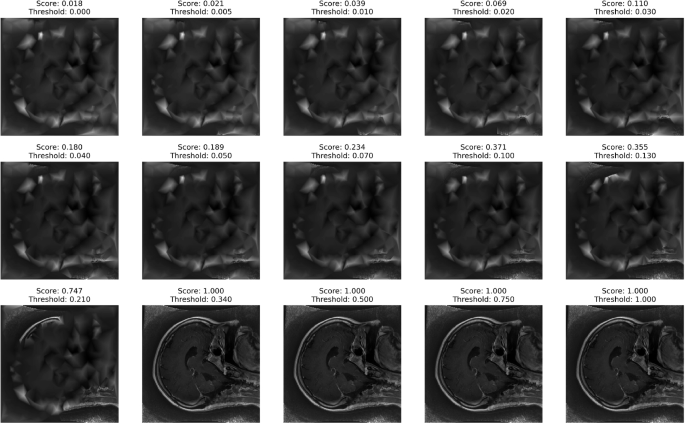
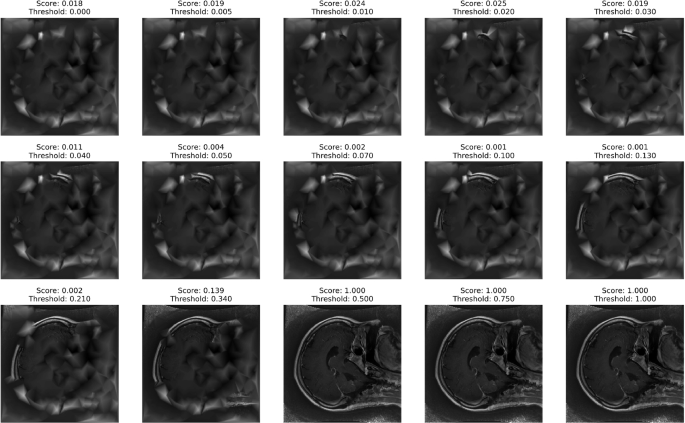
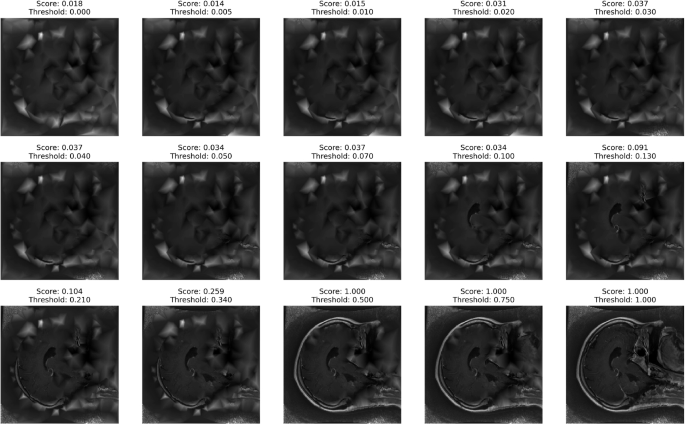
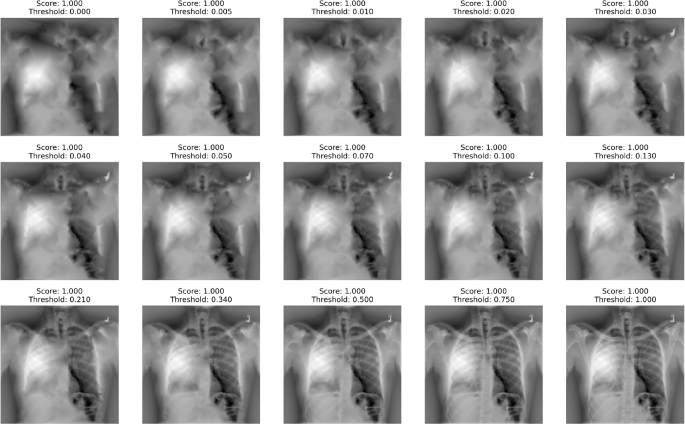
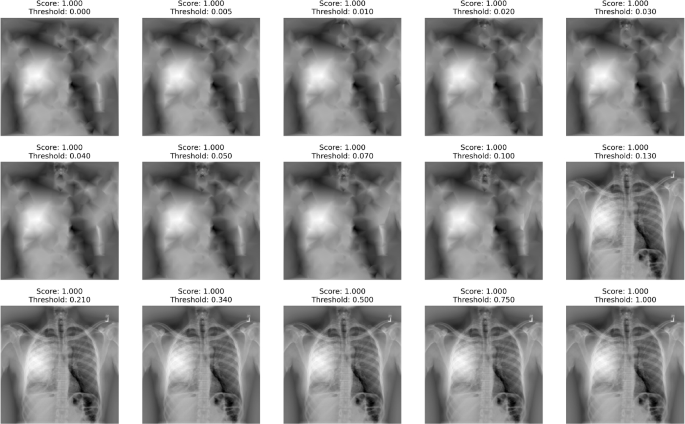
This evaluation framework entails initiating the process with a completely blurred version of the medical image and incrementally reintroducing pixels identified as significant by the saliency method. We then measure the resulting image’s entropy and conduct classification tasks to correlate the model’s performance, such as accuracy, with the calculated entropy or information level for each medical image, resulting in Performance Information Curves (PICs). Thus, two variants of PICs were introduced – Accuracy Information Curve (AIC) and Softmax Information Curve (SIC) – to provide a more nuanced evaluation of the saliency methods’ effectiveness.
Experimental setup
We conducted all experiments on Nvidia Quadro RTX 8000 hardware, leveraging its robust computational capabilities to handle the extensive DL training processes. For the implementation, we used the Keras API with the TensorFlow backend, enabling efficient and flexible development of the CNNs.