
Abstract
Dry eye disease (DED) is associated with ocular hyperosmolarity and inflammation. The marketed topical eye drops for DED treatment often lack bioavailability and precorneal residence time. In this study, we investigated catechol-functionalized polyzwitterion p(MPC-co-DMA), composed of 2-methacryloyloxyethyl phosphorylcholine (MPC) and dopamine methacrylamide (DMA) monomers, as potential topical nanotherapeutics for DED. The copolymers were synthesized via random free-radical copolymerization, producing different proportions of catecholic functionalization. All as-prepared polymer compositions displayed good ocular biocompatibility. At a feeding ratio of 1:1, p(MPC1-co-DMA1) can facilitate a robust mucoadhesion via Michael addition and/or Schiff base reaction, thus prolonging ocular residence time after 4 days of topical instillation. The hydration lubrication of MPC and radical-scavenging DMA endow the nano-agent to ease tear-film hyperosmolarity and corneal inflammation. A single dose of p(MPC1-co-DMA1) (1 mg/mL) after 4 days post-instillation can protect the cornea against reactive oxygen species, inhibiting cell apoptosis and the over-expression of pro-inflammatory factors (IL-6 and TNF-α). In clinical assessment, DED-induced rabbit eyes receiving p(MPC1-co-DMA1) could increase lacrimal fluid secretion by 5-fold higher than cyclosporine A. The catechol-functionalized polyzwitterion with enhanced lubricity, mucoadhesion, and anti-oxidation/anti-inflammation properties has shown high promise as a bioactive eye drop formulation for treating DED.
Graphical abstract

Introduction
Dry eye disease (DED) is a common multifactorial ocular condition classified as one of the most reasons for patients to seek eye care [1, 2]. By definition, the symptoms of DED patients include a decrease in tear film homeostasis and ocular surface inflammation [Therapeutic efficacy studies A DED-induced model (DED group) was produced by topical administering 0.15% BAC twice daily for 14 days. For the therapeutic efficacy tests, thirty-six dry-eye rabbits were divided into one control and five test groups, each of which had six animals. The control (Ctrl) group was topically treated with a single dose of 50 µL of artificial tear solution (ATS) alone (without any drugs or polymers), whereas the experimental groups received topical instillation with a single dose of 50 µL of ophthalmic solutions containing CsA, p(MPC), p(MPC1-co-DMA1), p(MPC3-co-DMA1), and p(MPC6-co-DMA1). A Pre group (healthy eyes) and a DED group (as-induced dry eyes) were also observed for comparison with Ctrl group and test groups. The therapeutic efficacy of p(MPC) and of different p(MPC-co-DMA) formulations was determined based on ophthalmic evaluations that were performed before and after topical administration. The bilateral eyes of 36 rabbits were then measured at predetermined time intervals during the following 4 days. Corneal fluorescein staining studies were used for clinical observations. The stained ocular surface was examined and graded using slit-lamp biomicroscopy (Topcon Optical, Tokyo, Japan) after topical application of 1% fluorescein sodium into the conjunctival sac. The intensity of fluorescence was then measured under cobalt blue light for slit-lamp analysis. The amount of fluorescence staining in the cornea was measured for three random areas on each rabbit eye using a standard four-point scale (0 = none, 1 = mild, 2 = moderate, and 3 = severe). The staining was measured in grades (n = 6) from 0 to 9. Details of other experimental procedures, including the synthesis of DMA, 3-(4,5-dimethylthiazol-2-yl)-5-(3-carboxymethoxyphenyl)-2-(4-sulfophenyl)-2 H-tetrazolium (MTS) test, live/dead assay, comet assay, corneal topographer assay, corneal endothelial cell density measurement, hematoxylin and eosin (H&E) study, terminal deoxynucleotidyl transferase dUTP nick end labeling (TUNEL) assay, DCFH-DA immunofluorescence staining, IL-6 and TNF-α immunofluorescence staining, Integrated Clinical Platform (I.C.P.) ocular surface analysis and Schirmer tear test are provided in Supporting Information. All results are reported as mean ± standard deviation (SD). The significance is measured using a one-way analysis of variance (p < 0.05).Statistical analysis
Results and discussion
Characterization studies
p(MPC-co-DMA) was synthesized and characterized as shown in Fig. 1a. The successful synthesis of DMA monomer was confirmed as shown in Figure S1. FTIR spectra of DMA monomer depicted the characteristic peak at 1650 cm− 1, which signifies the stretching vibration of C = O in amide group (Figure S2). The result suggested the amidation reaction and polymerizable unit had been conjugated with catechol motif. In addition, the peak at 3225 cm− 1 was assigned to -OH stretching vibration of catechol unit. The result indicates the availability of DMA for adhesive function. Prior to copolymerization, given that MPC monomer has low solubility in DMSO solvent, the successful p(MPC) synthesis was confirmed using NMR spectra analysis. As shown in Figure S3, the NMR spectrum of p(MPC) showed no proton signals of residual vinylic double bond at δ = 5.5 − 6.5 ppm, indicating that the resultant powder from our synthesis was in polymer configuration.
A series of copolymers with varying compositions were produced by using the feeding molar ratios of MPC and DMA of 1:1, 3:1, and 6:1. Figure 1b and Figure S4 display the 1H NMR spectra of various p(MPC-co-DMA) samples using D2O as the solvent. The signals at 6.79 and 6.93 ppm correspond to 3,4,6-trihydrophenyl groups of DMA. In addition, the peaks at 3.26, 3.71, 4.14 and 4.34 ppm are attributed to methylene groups and the methyl groups in MPC. The functional groups of all polymer compositions were further analyzed using FTIR spectra. Figure S5 showed the characteristic bands at 1244, 1170 and 1082 cm− 1, which are attributed to phosphate groups in MPC moiety. Additionally, the absorbance peak at 967 cm− 1 is assigned to the antisymmetric stretches of the C − N bonds in the N-(CH3)3 of MPC moiety. Notably, in various p(MPC-co-DMA) polymers, a novel peak at 1527 cm− 1 may represent the stretching vibration of C-N bond in amide motif of DMA. To this end, the NMR and FTIR spectra have confirmed the successful synthesis of the p(MPC-co-DMA) via free-radical copolymerization. For all of the polymer samples, the actual ratios of MPC to DMA are determined by dividing the integrated area of the aromatic protons of DMA (δ = 6.79 to 6.93 ppm) by the integrated area of the characteristic peaks for MPC (δ = 3.26 ppm). For feeding ratios of MPC to DMA of 1:1, 3:1, and 6:1, the respective ratios for the resultant samples is 2.77:1, 4.49:1 and 7.09:1 (Table S1). Accordingly, the highest DMA content is achieved at a value of 26.5 mol% for p(MPC1-co-DMA1). In nature, enriched catechol residues have been documented with values of 30 mol% in the interfacial mussel’s foot proteins (mfp-3 and mfp-5) [41]. Therefore, p(MPC1-co-DMA1) closely resembles a mussel’s foot protein in term of catechol content. The respective catechol content of p(MPC3-co-DMA1) and p(MPC6-co-DMA1) is 18.2 and 12.4 mol%. Figure 1c further confirms the higher catechol content in the copolymers at 1 wt% in the order of molar ratio 6:1 < 3:1 < 1:1, which is consistent with the molar ratio recorded using 1H NMR. In addition, the catechol content of copolymers quantified by UV-VIS (Fig. 1c, Figure S6 and Table S1) can support the data of NMR spectra (Fig. 1b and Table S1).
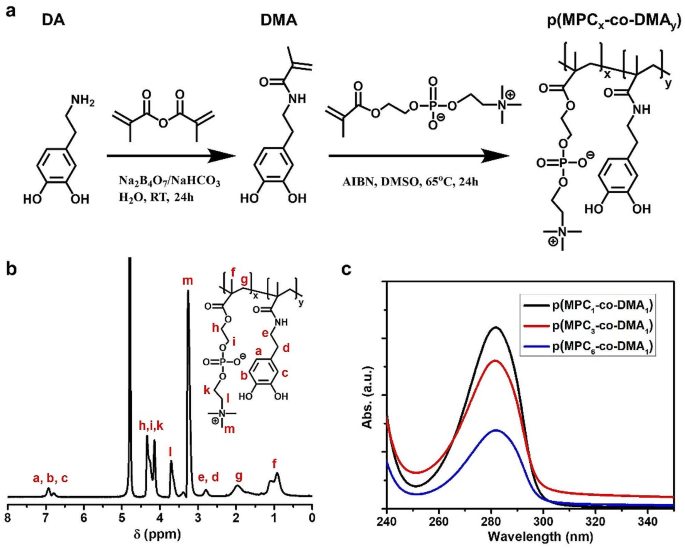
Synthesis routes and characterizations of copolymers. (a) The preparation of DMA monomer and p(MPC-co-DMA) copolymers. (b) 1H NMR spectrum of p(MPC1-co-DMA1) in D2O. (c) UV-VIS spectra of p(MPC-co-DMA) (1 wt%) with different compositions in PBS at pH 7.4
The number-average molecular weight (Mn) of the copolymers determined by GPC is shown in Figure S7 and Table S1. The length of the polymer chain decreases as MPC feeding mass increases, as shown in Experimental section. It is difficult to dissolve DMA homopolymers in organic solvents, and the polymers only demonstrate limited solubility in dimethylformamide [42]. Without sufficient protection, radical scavenging ability by catechol hinders the polymerization reaction because radicals are quenched by semi-quinone radicals, leading to the formation of intra- or inter-crosslinked structure [43, 44]. Therefore, the copolymers with greater MPC feeding content may easily form a long polymer chain. Zhang and colleagues also found that the solubility of copolymer at the molar ratio of 1:3 (ratio between MPC: DMA) was limited at 4 mg/mL [38]. In this study, our attempt to increase DMA content with feeding ratios 1:3 and 1:6 showed a sight of catechol oxidation (a darken color in the polymerization solution) as shown in Figure S8a. Additionally, the vinylic signals of DMA at δ = 5–6 ppm were still visible after the reaction, indicating the low polymerization efficacy of MPC: DMA feeding ratios at 1:3 and 1:6 (Figure S8b). Therefore, the highest DMA portion was only observed at 1:1 for this study.
Friction measurements
Lubricating agents can act as an osmoprotectant to ease dry eye discomfort by restoring the physiological osmolarity of tear film and decreasing the effect of hyperosmotic distress to corneal cells [45]. Therefore, the lubrication properties of mucin and synthesized polymers on silicon tubes were investigated. For the pristine silicon tube (Bare), the COF was constant at ∼ 2.5 for all three sliding cycles (Fig. 2). After mucin deposition, the COF value for the surface initially decreases to ∼ 0.57, and then gradually increases to ∼ 0.98 after the 2nd and 3rd cycles. The increase in COF tendency was also observed in other polymer coating substrates. Because a mucin layer was generated on coating surface via non-specific adsorption, the interfacial shear force between the coating and the silicon sheet could remove a portion of adsorbed mucin macromolecules after each sliding cycle. As a result, the stability of the lubrication that the mucin-bound surface provides is compromised. For a polymer-bound surface, the smoothness of the surfaces in which p(MPC) is deposited surfaces increases to give a COF of 0.46 to 0.66 after three cycles but surfaces on which p(MPC1-co-DMA1) is deposited experience only a slight change in COF from 0.36 to 0.37. The difference in COF values for the two polymer compositions probably reflects the functionality of DMA. Catechol has a high adhesive strength on a variety of surfaces [41], which could increase the stability of the coating against shear stress. A significantly lower COF value for p(MPC)- and p(MPC1-co-DMA1)-coated surfaces than for mucin-bound surfaces at the final sliding cycle (p < 0.05) indicates the enhanced lubrication properties of zwitterionic polymers. Considering the high dipole moment of zwitterionic pendants, the strong ionic-driven hydration shell surrounding quaternary amine N+(CH3)3 and phosphonate PO4− is not easily squeeze out under shear or compression, facilitating a greater degree of viscous dissipation than for “non-hydration” water [46, 47]. Therefore, the interfacial friction for surfaces on which MPC is deposited is lower than the friction for mucin-bound surfaces.
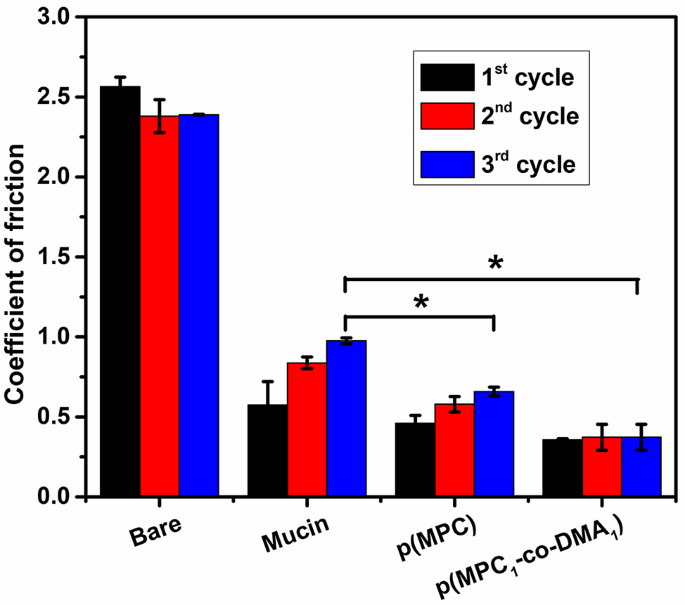
Hydration lubrication evaluation of as-prepared polymers. COF of silicon tube (Bare), Mucin-coated, p(MPC)-coated and p(MPC1-co-DMA1)-coated silicon tubes in DI water. The friction tests were performed in each sample at a normal load of 2 N and a sliding speed at 150 mm/mL after three sliding cycles. Values are mean ± SD (n = 3). *p < 0.05 vs. mucin
Mucoadhesive studies
Commercial porcine stomach mucin was used to study the mucoadhesive properties of p(MPC-co-DMA) copolymers. The interaction between catechol-containing copolymer and mucin was first measured using UV-VIS spectroscopy. 100 µL of copolymer solutions (10 mg/mL) were added to 1 mL of mucin solutions (1 mg/mL) to achieve a mass ratio of 1:1 in PBS buffer at pH 7.4. As shown in Figure S9a, the mucin solution exhibits a strong absorbance signal at 260 nm. There is no significant difference in the position of the absorbance peak for mucin and mucin-p(MPC). In contrast, UV-VIS demonstrated a slight red shift if mucin solution is mixed with catechol-functionalized polymer. The absorbance maxima for mucin shifts toward a lower wavelength region and there is an increase in the catechol content, which demonstrates that a mucin-catechol complex forms [34, 48, 49]. This behavior is also noted by other study, suggesting a change in peptide strands of mucin molecules and their hydrophobicity [48]. As a zwitterionic moiety, MPC segments of the copolymer resist non-specific interaction with biomacromolecules [50]. Hence, mucin-copolymer complex formation is solely contributed by DMA segments. As the catechol degree increases, more reactive sites are available for conjugation. Furthermore, copolymers separately recorded show no sign of catechol oxidation [51, 52], displaying only one absorbance peak centered at 280 nm in PBS buffer (Figure S9a). Hence, bidentate catecholic hydroxyls can induce strong hydrogen bonds [30, 49], allowing initial contact for mucin complexation.
Mucins play a vital role in the innate protection of the eyes [53]. Hence, the mucoadhesive properties of p(MPC-co-DMA) were further studied using a mucin-deposited substrate prior to in vitro and in vivo studies. Mucins were coated onto a plasma-treated silicon wafer by passive adsorption for 1 h. To verify the stability of the coating, WCA measurement was used to qualify the relative hydrophilicity after mucin deposition. Figure S9b shows that there is increased wetting of the surface of the silicon wafer so there is a significant reduction in the value of the WCA from 68° to 26.4°. Mucins exhibit a high binding affinity with water molecules [54]. This renders coated silicon surface with improved hydrophilicity. After deposition with mucin, copolymers were allowed to deposit on the substrates for 1 h. Interestingly, p(MPC1-co-DMA1) further induced wetting of mucin film (WCA at 23.2°), while a similar result was not observed in samples coated with other polymer compositions. Because zwitterions can exhibit superior wetting via ionic solvation [15], the decrease in the WCA implies the abundance of MPC segments on the mucin layer of p(MPC1-co-DMA1).
The surface elemental composition of the modified surface was investigated using XPS (Fig. 3). The characteristic phosphorus P2p signal at 133.8 eV is only attributed to the phosphate group of MPC [55]. Figure 3a shows that the signal is absent for the mucin layer. For different polymer compositions, only catechol-containing copolymers are immobilized on mucin-coated surfaces. The high-resolution spectra for the phosphorus to carbon ratio (P/C) also shows that there is an increase from 0.07 to 0.14 (Table S2), with increasing degree of catechol: p(MPC) < p(MPC6-co-DMA1) < p(MPC3-co-DMA1) < p(MPC1-co-DMA1). The N1s core-level spectra features a peak for mucin at 400.3 eV, which is associated with the primary and secondary amines at the N-terminus and peptide bonds in mucins (Fig. 3b) [53, 54]. After the copolymer deposition, a new N1s peak at 402.7 eV appears, which demonstrates the existence of the quaternary amine N+(CH3)3 in MPC. The presence of phosphorus and charged N+ are clear evidence that zwitterionic moieties are immobilized [58]. Moreover, introducing acrylamide CH-NH-CH section into DMA increases N elemental signals on mucin-deposited surface. As a result, the atomic ratio of nitrogen to carbon (N/C) is greater for samples on which a copolymer is deposited than for the mucin layer. These results demonstrate that DMA features an anchoring functionality.
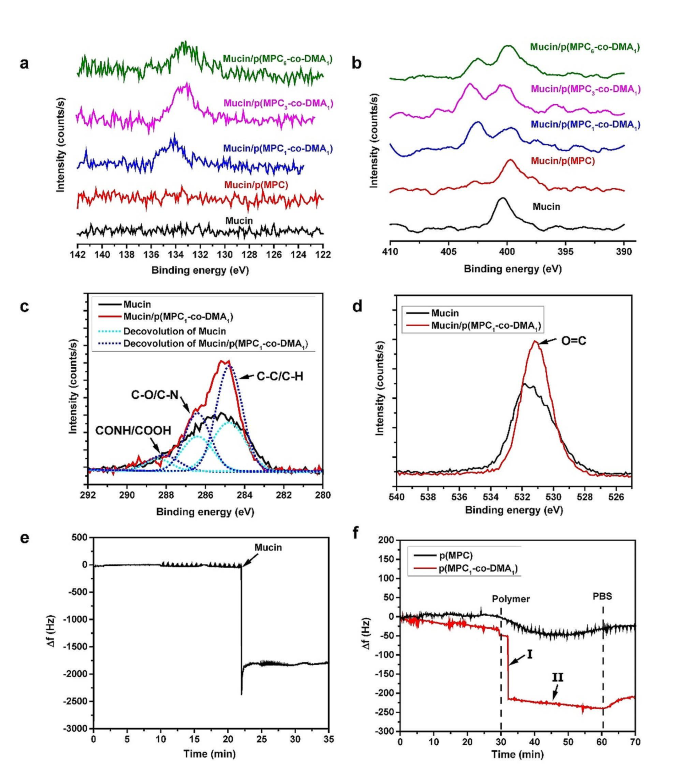
Mucoadhesion evaluation of as-prepared polymers. XPS spectra of the modified substrates: Core-level binding energy of elements: P2p (a), N1s (b), C1s (c), and O1s (d). Changes in frequency Δf with time were recorded with eQCM for mucin deposition (e) and the interaction between polymers on mucin layer (f)
.
Catechols can react with thiol and amine via Schiff base and Michael addition reactions [59]. Thiol-containing residues of mucins have been reported by other studies [9, 60]. However, the cysteine components of mucin vary between purification batches due to the variations in animals or purification efficiency [61]. Furthermore, cysteine is also not as abundant as amine residues [34]. Thus, the mucoadhesive properties of polymers are assumed to be most obvious between catechol and amine portions in mucins. To investigate this possibility, the core-level spectra of C1s and O1s were further analyzed in the mucin layer with and without deposition of p(MPC1-co-DMA1) (Fig. 3c and d). The C1s spectral signal for mucin layer shows three respective peak components for C-C/C-H, C-O/C-N, and CONH/COOH at 284.8, 286.4, and 288.2 eV (Fig. 3c) [56, 62]. In the p(MPC1-co-DMA1) spectrum, the peak intensities for C-C/C-H and C-O/C-N increase, which indicates the presence of the copolymer backbone and the tethered residues (acrylamide in DMA and acrylate in MPC) on mucin. In the O1s spectra, there is an increase in O = C for a binding energy of 531.2 eV in p(MPC1-co-DMA1) [63, 64], which shows that catechol moieties were oxidized (Fig. 3d). Interestingly, catechol moieties were in a reduced state as shown in UV-VIS spectra, which differs from the result observed in XPS. The oxygen-induced conversion of catechol to quinone can occur above pH 5; however, the process is rather dull, requiring days of monitoring [57]. Hence, it is likely that catechol-to-quinone conversion did not occur after hours under a physiological condition during UV-VIS measurement. Furthermore, amine-rich mucins may accelerate the oxidation of catechol residues by promoting Michael addition and Schiff base reactions, similar to the co-deposition between DA and polyethyleneimine in the work of Xu and colleagues [62].
Real-time measurement of p(MPC1-co-DMA1) adsorption on the mucin adlayer used eQCM to analyze adhesion behavior. The reduction in frequency shift (Δf) is associated with adsorbed mass on the sensor. Herein, we first examined the adlayer formation of mucin used in this study. Mucin (0.025 mg/mL) was injected and allowed to adsorb in the flow cell for 35 min, forming a mucin adlayer with a stable mass density, as shown in Fig. 3e. The adlayer was then rinsed with PBS for 30 min to remove loosely-bound mucin. The polymer compositions were then allowed to flow for 30 min before rinsing with PBS as shown in Fig. 3f. For p(MPC) homopolymer, there was a gradual decrease in Δf after injection, then a small increase and halt at a mass density of 21.6 ng/cm2. The main driving force for non-specific adsorption of p(MPC) is Van der Waal forces, which are common but relatively weak secondary bonds in close proximity [65]. After p(MPC1-co-DMA1), there was an abrupt decrease (phase I) followed by a steady decrease (phase II) in Δf. In phase I, the copolymer passively diffuses and is absorbs onto mucin adlayer, and the interaction between catechol and mucin provides anchoring sites to allow stable adhesion of the copolymer. In Phase II, the catechol groups that remain on the adsorbed copolymers also allow inter-chain interactions with free-floating chains, leading to an increase in the adsorbed mass density. As a result, the final mass load for the copolymer is 213.2 ng/cm2, which is approximately 10 times the value for p(MPC). To sum up, the adhesive mechanisms for catechol-functionalized polymers have three aspects: (1) catecholic functionalization promotes the immobilization of zwitterions on the mucin surface, as shown by the XPS spectra; (2) bidentate catecholic residues of the copolymer allow strong and instantaneous hydrogen bonding with the mucin layer; and (3) the catechol-amine adducts that gradually form between the mucin and the copolymer increase the mucoadhesive properties of the copolymers.
In vitro biocompatibility tests
Prior to the antioxidant and anti-inflammatory evaluation, the cytotoxicity of p(MPC) and p(MPC-co-DMA) is determined. The biocompatibility of all synthetic polymers is determined using a MTS assay and live/dead staining. For this work, SIRC cells from the cornea of normal rabbit was used. The mitochondrial dehydrogenase activity (MTS activity) for the Ctrl group was defined as 100%. The metabolic activities and viability levels of SIRC cells after exposure to polymer samples were depicted in Figure S10 and S11. After two days of incubation, all the polymer samples did not alter the cell morphology regardless of their concentration (ranging from 0.1 to 1 mg/mL) (Figure S10a and b). Quantitative data for MTS activity and live/dead assay also supported data from the microscopic images in that the values for metabolic activity and cell viability are 95% of the values for the Ctrl group (Figure S10 and S11). In addition to cell cytotoxicity, an alkaline comet assay was conducted to investigate the potential genotoxicity of the polymers. Figure S12 indicated intact nuclei with smooth edges in all samples. Moreover, the tail lengths of comet in all compositions showed no apparent difference with the Ctrl (0.9 ∼ 1.2 μm). The result shows that no DNA breakage was caused by the polymers [66, 67]. Overall, the synthetic polymers used in this study exhibited no harmful effect on SIRC cells. Therefore, the in vitro and in vivo studies were conducted and evaluated using the highest polymer concentration of 1 mg/mL.
Antioxidant and anti-inflammatory activity studies
An increase in the amount of ROS is a major factor of the DED etiology [68]. The over-expression of intracellular ROS on the ocular surface has various adverse outcomes, including DNA, lipids, protein damage and cell apoptosis [69]. To determine the antioxidant activity of the polymers, this study uses DPPH to determine the free radical scavenging ability for various p(MPC-co-DMA) groups. The results are shown in Fig. 4a and b. DPPH antioxidant solution has a maximum absorbance at 517 nm [70]. As the radical scavenging capability of antioxidant agent increases, the color of DPPH solution gradually changed from dark purple to light yellow [71]. Quantitatively, the respective radical inhibition percentages of p(MPC1-co-DMA1), p(MPC3-co-DMA1), and p(MPC6-co-DMA1) was 87.52 ± 5.36%, 60.14 ± 4.89% and 35.63 ± 4.94%. In contrast, the value of p(MPC) was similar to blank sample. These results highlighted that the antioxidant capability was closely associated with the degree of catechol groups within copolymers, which has obtained wide recognition in other literature [38, 44]. To support this assumption, we continued to conduct Folin-Ciocalteu assay to determine the polyphenol content of p(MPC-co-DMA). The color of a p(MPC1-co-DMA1) solution turned darker blue as shown in Fig. 4c, implying a higher level of polyphenols [72]. The polyphenol content at 85.7 ± 4.7 mg, 59.0 ± 5.0 mg, and 39.9 ± 3.9 mg for gallic acid equivalent (GAE)/g polymer decreases in the order (Fig. 4d): p(MPC1-co-DMA1) > p(MPC3-co-DMA1) > p(MPC6-co-DMA1).
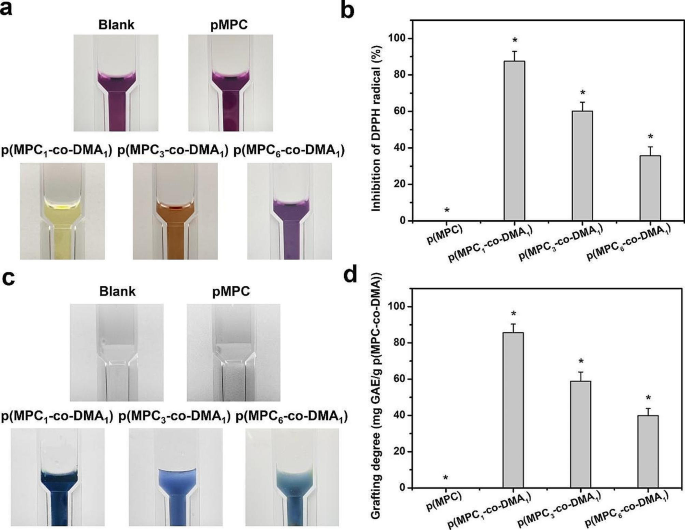
Anti-oxidation evaluation of as-prepared polymers. Photographs of the reaction of DPPH reagent (a) and Folin-Ciocalteu reagent (c) with the test samples including p(MPC), p(MPC1-co-DMA1), p(MPC3-co-DMA1) and p(MPC6-co-DMA1). DPPH scavenging activity (b) and total phenolics content (d) of the various samples were analyzed by UV-VIS spectrophotometry. Values are mean ± SD (n = 5). *p < 0.05 vs. all groups. The blank group: without p(MPC-co-DMA) sample
Cellular models of oxidative stress were adopted to assess the antioxidant capabilities of p(MPC-co-DMA) materials in vitro. DCFH-DA, which is a cell-permeable non-fluorescent probe, can be hydrolyzed to become non-permeable DCFH within cells. DCFH can be further oxidized by increased intracellular ROS (superoxide O2−), forming visible fluorescent signals as shown for HP group (Fig. 5a). The fluorescent signals from cells decrease significantly after two days of incubation with catechol-containing polymers. The greater the concentration of catechols in p(MPC1-co-DMA1), the more the ROS level reduces to the value for the Ctrl group (Fig. 5b). Catechol can quench free radicals by supplying hydrogen atoms from the phenolic hydroxyl residues, but catechol can also reduce other reactive agents through electron transfer, and the resulting phenoxyl radical can further interact with the second radical to form stable quinone structures [73]. The regulation of calcium has a crucial role in chemical signaling, thus the over-expression of intracellular calcium is considered a contributing factor leading to cell death [74, 75]. Therefore, further studies on intracellular calcium levels were conducted to verify cell survivability (Fig. 5c and d). The intracellular calcium level after H2O2 treatment decreased significantly when cells were co-incubated with p(MPC-co-DMA) copolymers in the order: Ctrl < p(MPC1-co-DMA1) < p(MPC3-co-DMA1) < p(MPC6-co-DMA1) < p(MPC) = HP. These results confirm that catechol-functionalized polymers inhibit ROS damage.
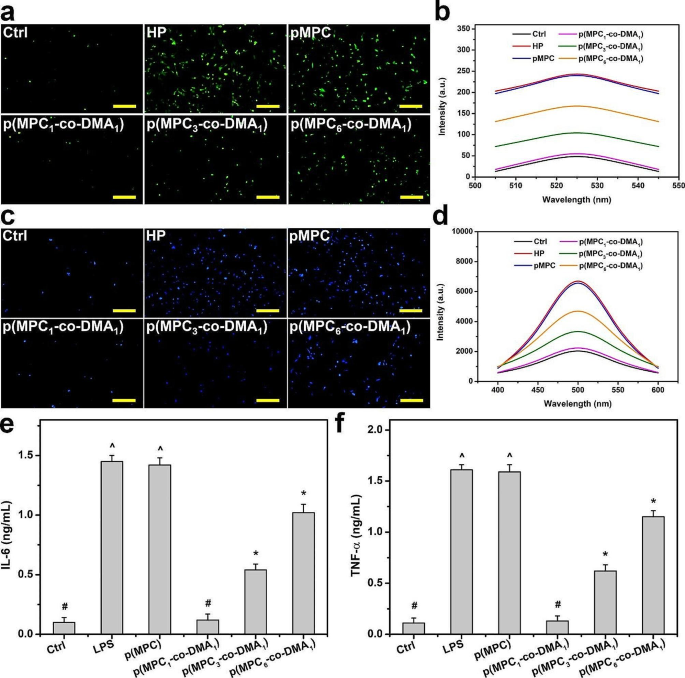
In vitro anti-oxidation and anti-inflammation of as-prepared polymers. (a) Representative fluorescent images and (b) intracellular levels of ROS measured by the fluorescence intensity of DCFH-DA of the SIRC cells after incubation with different samples for 24 h and further exposure to H2O2 for 24 h. (c) Representative fluorescent images of the SIRC cells and (d) intracellular levels of calcium measured by the fluorescence intensity of Fura-2, AM after incubation with different samples for 24 h and further exposure to H2O2 for 24 h. Levels of (e) IL-6 and (f) TNF-α from the p(MPC-co-DMA) samples (p(MPC), p(MPC1-co-DMA1), p(MPC3-co-DMA1) and p(MPC6-co-DMA1)). Scale bars: 100 μm. Values are mean ± SD (n = 5). *p < 0.05 vs. all groups; #p < 0.05 vs. LPS, p(MPC), p(MPC3-co-DMA1) and p(MPC6-co-DMA1) groups; ^p < 0.05 vs. Ctrl, p(MPC1-co-DMA1), p(MPC3-co-DMA1) and p(MPC6-co-DMA1) groups
Inflammation is an underlying factor for DED [69]. Hence, the pro-inflammatory factors (IL-6 and TNF-α) were further examined. Lipopolysaccharide-induced cells were also used as a disease control group (LPS) to mimic DED symptoms. As depicted in Fig. 5e and f, the expression of IL-6 and TNF-α decreases significantly (p < 0.05) for LPS groups that are subject to p(MPC-co-DMA) treatment. Moreover, p(MPC1-co-DMA1)-treated group exhibits the highest anti-inflammatory capability of the catechol-containing groups, which demonstrates their antioxidant capacity.
Corneal retention studies
In this study, the normal rabbit corneas were monitored under a slit lamp for h12 and 4 days post-instillation to validate any corneal injury caused by polymers. The rabbit eyes receiving topically instilled polymeric drops showed no signs of corneal redness, edema, or inflammation (Figure S13). Quantitatively, all observations of the modified Draize test resulted in scores of zero as shown in Table S3. Furthermore, intraocular pressure (IOP) value after polymer instillment remained comparable with Ctrl group, which confirmed the safety of the synthetic polymers (Figure S14).
The bio-adhesive properties of p(MPC-co-DMA) copolymers were further evaluated in vivo. In this investigation, the content of p(MPC-co-DMA) retained on the cornea was examined by SEM-EDS after h12 and 4 days of topical administration of nanotherapeutic formulations (Fig. 6a). No elemental phosphorous (red dot) was detected in the Ctrl group. The meibomian lipid layer is constituted by the structural organization of polar lipids (of which phospholipids are the most important) [76]. However, the precorneal tear film is not a part from corneal tissue. This result may explain the absence of phosphorus signal on ocular surface. Hence, the measurement for elemental phosphorous can only be attributed to phosphorylcholine pendants from MPC-containing polymers. For p(MPC) group, the phosphorus portion was ∼ 31% after h12 of treatment. In contrast, at least 50% of the total phosphorus signal, which corresponds to p(MPC-co-DMA), remained visible on the ocular surface (75%, 62%, and 53% for the feeding ratios of 1:1, 3:1 and 6:1, respectively). The results suggested the concentration of catechol significantly affect retention efficiency. Remarkably, phosphorus coverage of p(MPC1-co-DMA1) remained at about 46%, but the phosphorus coverage of p(MPC3-co-DMA1) and p(MPC6-co-DMA1) decreased significantly (23% and 8%, respectively), as shown in Fig. 6b. As demonstrated in the mucin model, the initial attachment of the copolymers was due to the presence of bidentate hydroxyls in reduced catechol. However, covalent solidification of amine-catechol adducts is essential for long-lasting mucoadhesion [34]. The abundant catechol residues within p(MPC1-co-DMA1) probaly promote an inter-chain interaction via phenol-phenol coupling [33], leading to heightened P retention percentage.
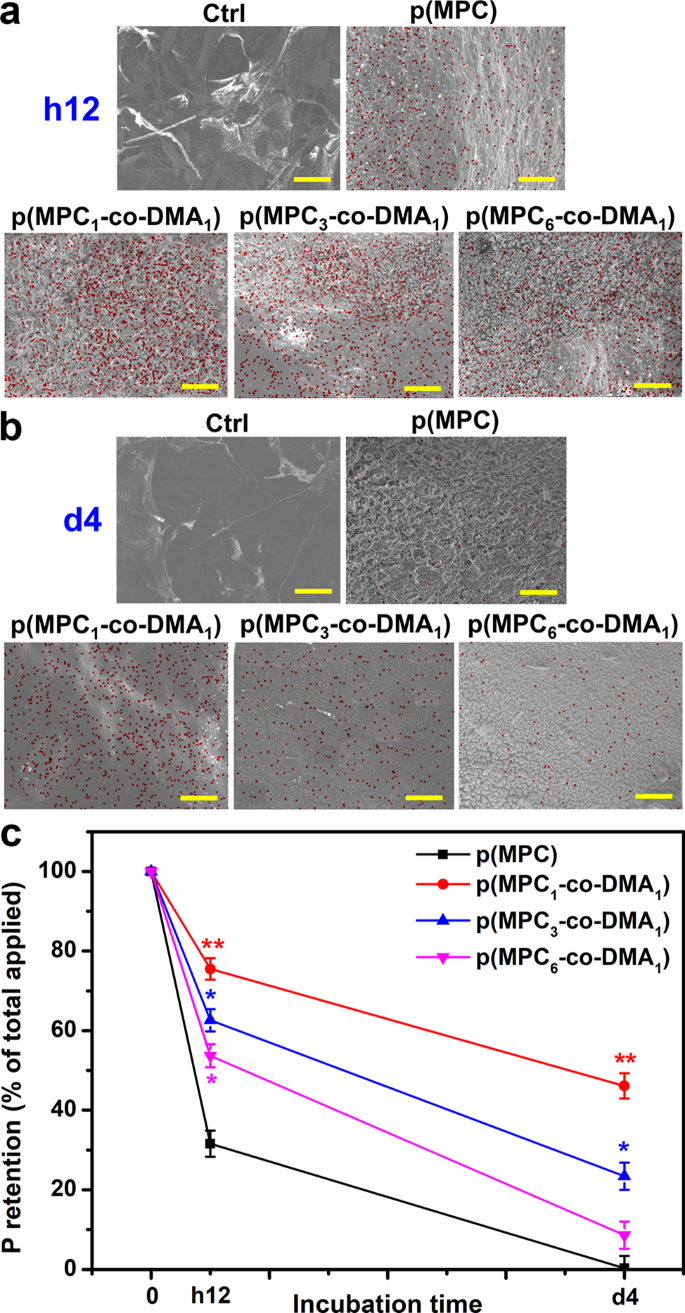
In vivo mucoadhesion assessment of nanoformulations. SEM images of healthy eyes at (a) h12 and (b) 4 days post-instillation of different formulations. EDS map** of phosphorus distribution for the corresponding healthy eyes. Scale bars: 10 μm. (c) Corneal retention of P was analyzed by ICP-OES with the various p(MPC-co-DMA) samples. Values are mean ± SD (n = 6). *p < 0.05 vs. p(MPC) group; **p < 0.005 vs. p(MPC) group
Therapeutic efficacy studies
The therapeutic effect of the synthetic polymer was investigated in BAC-induced DED model. BAC, which is a preservative used in many ophthalmic topical solutions, can accelerate tear film breakage and evaporation [77]. Rabbits with dry eyes exhibited corneal/conjunctival injury and insufficient tear secretion at the end of the induction phase, similar to those of DED patients. An examination of the ocular surface and tear film in a clinical ophthalmology exam can indicate the progression of dry eye diseases [78]. Clinical criteria for DED, including a fluorescein vital staining score of ≥ 3 and a Schirmer test value of ≤ 5 mm, were used to validate the recovery of rabbit eyes after treatment using different polymer compositions. For the untreated group (Ctrl group), the DED rabbits that receiving ATS alone exhibited the greatest fluorescent intensity for the experiment. An immunomodulatory agent (CsA) was used as a reference for comparison with the polymers. CsA can alleviate the symptoms of dry eye and the underlying inflammatory pathologic state [77]. However, CsA possesses low solubility and bioavailability [79], limiting its potential therapeutic effect for DED treatment. The CsA group only showed a reduction in the area of corneal fluorescein staining after h12 of administration (Fig. 7a). The short-term therapeutic action was also observed in homopolymer p(MPC). As shown in Fig. 7b, p(MPC) exhibited a reduction (p < 0.05) in fluorescein staining score after h12 of administration. The instillation of hydrophilic p(MPC) can replenish moisture on the ocular surface and stabilize the osmolarity of tear film [25], but did not adhere well and did not produce an anti-oxidative action to inhibit the progression of DED. Hence, without sufficient bioavailability and bio-adhesive mechanism, CsA and p(MPC) groups have similar scores to those for the untreated DED model (Ctrl) at 4 days postoperatively. In contrast, the positive fluorescent signals for p(MPC1-co-DMA1), p(MPC3-co-DMA1), and p(MPC6-co-DMA1) decreased linearly after h12 and 4 days postoperatively, signifying a gradual mitigation of corneal epithelial damage. Furthermore, there was a correlation between catechol concentration and the therapeutic effect of p(MPC-co-DMA). With the highest synergistic antioxidant/anti-inflammatory effect demonstrated in vitro, the fluorescein vital staining score in p(MPC1-co-DMA1)-treated groups reduced to ∼ 0 (p < 0.001), suggesting the most pronounced therapeutic effect.
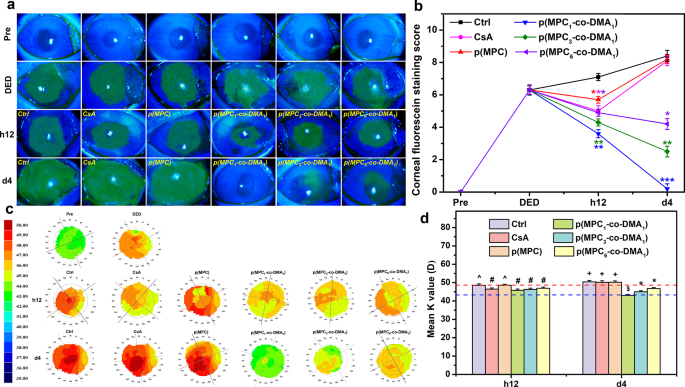
In vivo therapeutic effects of nanoformulations. (a) Corneal fluorescein staining images and (b) fluorescent staining scores of rabbit eyes at preoperation (Pre), after dry eye (DED) induction, and those with experimentally induced DED after topical administration of different formulations for h12 and 4 days. Dry eye animals receiving ATS without polymer and drug were control groups (Ctrl). *p < 0.05 vs. Ctrl group; **p < 0.005 vs. Ctrl group; ***p < 0.001 vs. Ctrl group. (c) Corneal topographic values and (d) mean K value from corneal topography of rabbit eyes after h12 and 4 days of topical instillation of different formulations. The blue and red dash lines represent the Pre and DED group values, respectively. Values are mean ± SD (n = 6). *p < 0.05 vs. all groups; +p < 0.05 vs. Pre, DED, CsA, p(MPC1-co-DMA1), p(MPC3-co-DMA1), and p(MPC6-co-DMA1) groups; #p < 0.05 vs. Pre, Ctrl, and p(MPC) groups; ^p < 0.05 vs. Pre, DED, p(MPC1-co-DMA1), p(MPC3-co-DMA1), and p(MPC6-co-DMA1) groups; $p < 0.05 vs. Pre, Ctrl, CsA, p(MPC), p(MPC3-co-DMA1), and p(MPC6-co-DMA1) groups
In ophthalmology, corneal imaging is used to detect and treat various ocular illnesses. In addition, corneal topography can be used to monitor changes in response to ocular disease progression. As shown in Fig. 7c and d, the green signal in Pre group is almost equally distributed, indicating a minimal corneal abnormality. On the contrary, DED and Ctrl groups displayed a heterogeneous distribution of green, yellow, orange, and bright red signals due to inflammation, suggesting a horizontal wavefront aberration. A comparison of the results for all the groups shows that the corneal topological map and curvature values for the p(MPC1-co-DMA1) group most resemble those for the Pre group and demonstrate the greatest therapeutic effect for DED.
DED-associated inflammation can accelerate corneal endothelial cell loss and change cellular morphology [80]. Hence, specular microscopic images and the endothelial cell density of rabbit eyes in response to topical instillation of the polymers were investigated at h12 and 4 days postoperatively. In the Pre group, healthy endothelial cells on Descemet’s membrane displayed a characteristic hexagonal shape and were closely packed together (Figure S15a). On the contrary, morphological abnormality of endothelial cells was detected in the DED model. The change in cellular morphology became more evident in Ctrl and p(MPC) groups, along with a significant reduction (p < 0.05) in endothelial cell density compared with DED group (Figure S15a and b). For other groups, because CsA and p(MPC-co-DMA) nanoformulations are bioactive (antioxidant/anti-inflammation), the exposure of DED-induced eyes to the polymers can inhibit the continuous deterioration of endothelial cell density after h12 of instillation. However, insufficient doses and the lack of retention mechanisms may hamper the bioavailability of CsA [12, 13], which limits its long-term therapeutic effect as depicted in Figure S15b. p(MPC-co-DMA) copolymers with their superior mucoadhesion and antioxidation can further prevent corneal endothelial damage at 4 days postoperatively. Our findings indicated that among all experimental groups, p(MPC1-co-DMA1) not only therapeutically promoted epithelial regeneration, but also efficiently preserved cell morphology and density of corneal endothelium during 4 days of clinical observation.
Tissue samples were taken at the endpoint (i.e., at 4 days postoperatively) to determine the histological changes in response to different treatments. The corneal epithelia for ATS-only treatment group (Ctrl group), CsA group, and p(MPC) group were thinner than that for the DED group (Fig. 8a). In contrast, p(MPC-co-DMA)-treated animals showed significantly higher tissue thicknesses (p < 0.05) among all groups (Fig. 8b). Interestingly, the corneal epithelial integrity for the p(MPC1-co-DMA1) group was evenly matching that for the Pre group. TUNEL assays were further conducted to analyze the genomic fragmentation and cell apoptosis in BAC-induced DED rabbits with topically administered medications after 4 days (Fig. 8c and d). For the DED group, the apoptotic corneal epithelial cells emitted an intense green fluorescence, indicating the relationship between inflammation and cellular apoptosis [72]. For the CsA and p(MPC) groups, the TUNEL-labeled apoptotic cells still displayed intense green dye of DNA fragments after a 4-day treatment. This strongly implies that CsA and p(MPC) were ineffective treatments for DED. However, the p(MPC-co-DMA) groups exhibited successful inhibition of cell apoptosis and there is a significant decrease (p < 0.05) in the number of apoptotic cells and in green fluorescence after 4 days of topical administration. The smaller signal for ROS fluorescence for the p(MPC-co-DMA) groups also shows that there is a cytoprotective effect against reactive species (Fig. 9a and b). Tear film hyper-osmolarity caused by desiccating environmental stress can up-regulate the secretion of these pro-inflammatory cytokines (e.g. IL-6 and TNF-α), subsequently triggering chronic immune-based inflammation cascade and ultimately leading to the disruption of corneal epithelial barrier [81]. As depicted in Fig. 9c and d and S16, the amounts of pro-inflammatory factors in corneal epithelial tissue after p(MPC-co-DMA) instillation decrease, compared to other nanoformulations. A combination of the hydration lubrication of MPC and the antioxidant action of DMA is effective in treating ocular dryness. Remarkably, all the indicators in histological studies of p(MPC1-co-DMA1)-treated group were comparable to that in the Pre group, which significantly supports the therapeutic efficacy of the polymer composition for DED. The results for protecting corneal cells from a hyperosmotic environment, mitigating cellular apoptosis/inflammation, and suppressing ROS production show the synergistic therapeutic effect of p(MPC-co-DMA).
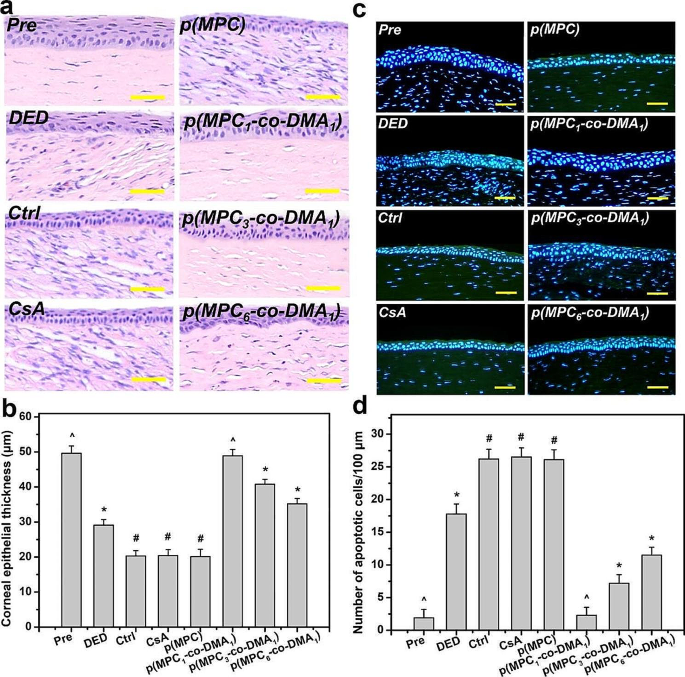
Histological assessment for corneal protection and anti-apoptosis capability. (a) Histological images of corneal epithelium, (b) corneal epithelial thickness, (c) relative TUNEL area of the cornea and (d) TUNEL staining mean fluorescence intensity of corneal epithelium in rabbit eyes at preoperation (Pre) and those with experimentally induced dry eye (DED) before and after 4 days of topical administration of various formulations. DED-induced animals receiving ATS without polymers and drug serve as control group (Ctrl). Scale bars: 50 μm. Values are mean ± SD (n = 6). *p < 0.05 vs. all groups; #p < 0.05 vs. Pre, DED, p(MPC1-co-DMA1), p(MPC3-co-DMA1), and p(MPC6-co-DMA1) groups; ^p < 0.05 vs. DED, Ctrl, CsA, p(MPC), p(MPC3-co-DMA1), and p(MPC6-co-DMA1) groups
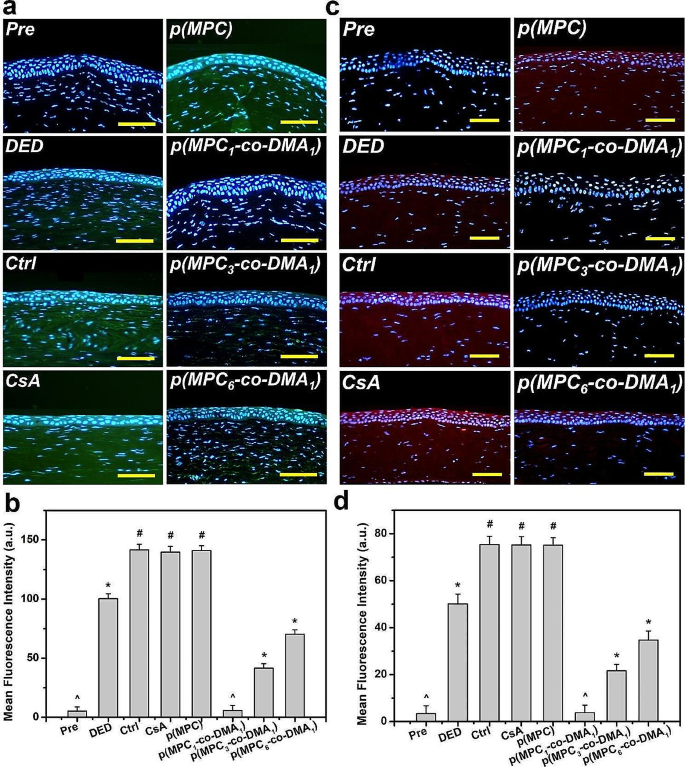
Histological assessment for antioxidation and anti-inflammation capability. (a) Fluorescence images and (b) mean fluorescence intensity of corneal epithelium in rabbit eyes and those with experimentally induced DED 4 days after various samples administration. DED animals receiving ATS without nanomaterials and drug served as control groups (Ctrl). Green fluorescence is DCFH-DA-positive staining. Scale bars: 100 μm. (c) IL-6 immunofluorescence staining images and (d) mean fluorescence intensity of corneal epithelium in rabbit eyes and those with experimentally induced DED 4 days after various samples administration. DED animals receiving ATS without nanomaterials and drug served as control groups (Ctrl). Red fluorescence is IL-6-specific antibody staining. Scale bars: 50 μm. Values are mean ± SD (n = 6). *p < 0.05 vs. all groups; #p < 0.05 vs. Pre, DED, p(MPC1-co-DMA1), p(MPC3-co-DMA1), and p(MPC6-co-DMA1) groups; ^p < 0.05 vs. DED, Ctrl, CsA, p(MPC), p(MPC3-co-DMA1), and p(MPC6-co-DMA1) groups
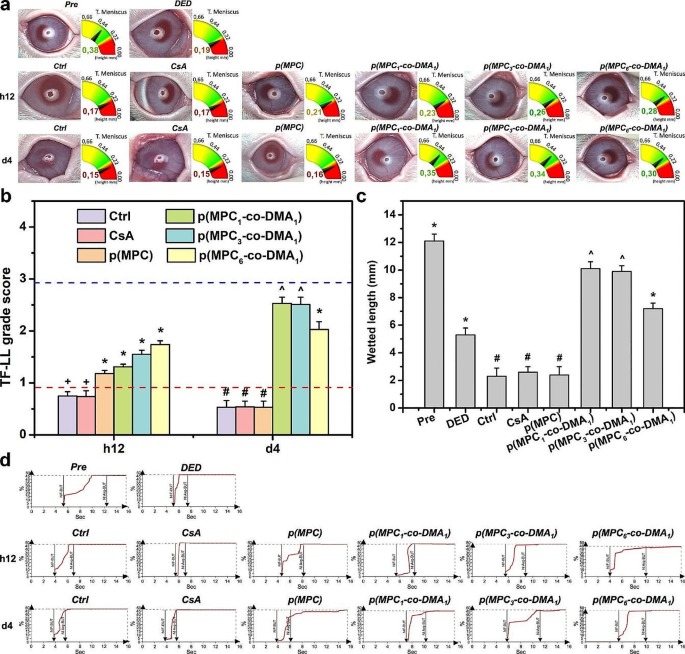
Clinical assessment of nanoformulations. (a) The images show tear meniscus height (TMH) measurement, lipid layer (TF-LL) pattern and (b) grading scale of interferometric patterns of Pre, DED, Ctrl, CsA, p(MPC), p(MPC1-co-DMA1), p(MPC3-co-DMA1), and p(MPC6-co-DMA1) groups at h12 and 4 days. The blue and red dash line represents the value of Pre and DED group, respectively. (c) The wetted length of the Schirmer paper strip for the rabbit eyes before drug administration (Pre) and those with experimentally induced DED 4 days after topical administration of CsA, p(MPC), p(MPC1-co-DMA1), p(MPC3-co-DMA1), and p(MPC6-co-DMA1). DED animals receiving artificial tear solution (ATS) without nanomaterial and drug serve as control groups (Ctrl). Values are mean ± SD (n = 6). *p < 0.05 vs. all groups; +p < 0.05 vs. Pre, DED, p(MPC), p(MPC1-co-DMA1), p(MPC3-co-DMA1), and p(MPC6-co-DMA1); #p < 0.05 vs. Pre, DED, p(MPC1-co-DMA1), p(MPC3-co-DMA1), and p(MPC6-co-DMA1); ^p < 0.05 vs. Pre, DED, Ctrl, CsA, p(MPC), and p(MPC6-co-DMA1). (d) The tear film first break-up time (NIF-BUT) and tear film average break-up time (NIAvg-BUT) measurements of Pre, DED, Ctrl, CsA, p(MPC), p(MPC1-co-DMA1), p(MPC3-co-DMA1), and p(MPC6-co-DMA1) groups at h12 and 4 days
The height of the tear meniscus and the lipid layer thickness for the tear film were measured using an ocular surface analyzer. The normal range for tear meniscus height is from 0.2 to 0.5 mm. For the DED group, the tear meniscus height in is less than 0.2 mm [82, 83]. As depicted in Fig. 10a, all polymer samples demonstrate an increase in tear volume after a h12 topical treatment. Nagai and colleagues showed that p(MPC) can enhance corneal water retention, increase tear volume, and prolong tear film break-up time without increasing the total mucin content in the tear film of a normal rabbit [25]. The tear meniscus height of p(MPC) and other copolymer groups were ≥ 0.21 mm (more prominent than Ctrl and CsA groups at 0.17 mm) at h12 postoperatively. p(MPC) is non-fouling but the zwitterionic polymer alleviates dry eye symptoms because of its lubricity, and supplements the meibomian lipid layer in precorneal tear film. Therefore, an increase in the tear film lipid layer (TF-LL) thickness supports this assumption (Fig. 10b). However, only catechol-functionalized polymers can extend the pharmacological effect after a 4-day treatment owing to their superior mucoadhesive and bioactive properties of DMA (Fig. 10c). All p(MPC-co-DMA) groups showed thickness ≥ 0.3 mm in the tear meniscus layer and were approaching the TF-LL score of 3 (Fig. 10a and b), suggesting the tear films were in the process of regeneration.
The tear film break-up time (BUT) is an index for direct clinical examination of the tear film, which refers to the time from the first complete blink to the appearance of the first dry spot on the tear film. The BUT index is short if it is less than 10 s, because there is insufficient tear secretion or an abnormality in the ocular surface. In clinical terms, the average rupture time for normal individuals is about 10 ∼ 13 s, but the average rupture time for DED patients is about 7 ∼ 8 s. After a h12 treatment, all formulations of MPC-containing polymer increase the average break-up time of tear film, indicating stabilization of tear osmolarity (Fig. 10d and Table S4). Remarkably, the interblink interval of rabbits extended significantly in all p(MPC-co-DMA) groups at 4 days postoperatively. This data confirms that catechol-functionalized polyzwitterion has a superior synergistic therapeutic effect, including hydration lubrication, supplementing of the lipid layer, mucoadhesion and anti-oxidation/anti-inflammation activity.
Conclusions
In summary, we have successfully developed an intrinsically therapeutic nanoformulation p(MPC-co-DMA) via random free-radical copolymerization to the alleviation DED. In general, p(MPC-co-DMA) has a dual therapeutic effect: MPC portion enhances lubrication, supplements lipid layer, and relieves hyperosmotic stress on the ocular surface; while DMA residues offers self-triggering antioxidant and anti-inflammation activity. Owing to catechol moieties, two mucoadhesive mechanisms of p(MPC-co-DMA) were detected: (1) Tethered catechol residues on the polymer chains of p(MPC-co-DMA) interact with mucins via strong hydrogen bonding and covalent conjugation with amine groups via Michael addition and/or a Schiff base reaction and (2) an inter-chain interaction between adsorbed polymers and free-floating polymers can occur via catechol-catechol coupling. As a result, the copolymers could enhance their retention time and therapeutic effect on the ocular surface. By increasing the catechol portion, p(MPC-co-DMA) showed an improvement in anti-inflammatory and antioxidant capabilities, thereby facilitating down-regulation of pro-inflammatory factors (i.e., IL-6 and TNF-α) and cytoprotection by quenching intracellular ROS production and mitigating cell apoptosis. In a rabbit model of DED, single topical instillation of p(MPC1-co-DMA1) depicted clear signs of tissue restoration at 4 days postoperatively, evidenced by elevating epithelial cell recovery and refraining the endothelial cell deterioration. In clinical assessment, the administration of p(MPC1-co-DMA1) can improve tear fluid production about 5 times compared with the commercial CsA group. These findings strongly imply the potential therapeutic effect of the nanoformulations based entirely on synthetic biomaterials for effective DED treatment.
Data availability
No datasets were generated or analysed during the current study.
References
Perez VL, Stern ME, Pflugfelder SC. Inflammatory basis for dry eye disease flares. Exp Eye Res. 2020;201:108294.
Bradley JL, Stillman IÖ, Pivneva I, Guerin A, Evans AM, Dana R. Dry eye disease ranking among common reasons for seeking eye care in a large US claims database. Clin Ophthalmol. 2019;13:225.
Li C, Song Y, Luan S, Wan P, Li N, Tang J, Han Y, **ong C, Wang Z. Research on the stability of a rabbit dry eye model induced by topical application of the preservative benzalkonium chloride. PLoS ONE. 2012;7:e33688.
Nguyen DD, Lai JY. Advancing the stimuli response of polymer-based drug delivery systems for ocular disease treatment. Polym Chem. 2020;11:6988–7008.
Stapleton F, Alves M, Bunya VY, Jalbert I, Lekhanont K, Malet F, Na KS, Schaumberg D, Uchino M, Vehof J. Tfos dews ii epidemiology report. Ocul Surf. 2017;15:334–65.
Salinas-Toro D, Cartes C, Segovia C, Alonso MJ, Soberon B, Sepulveda M, Zapata C, Yañez P, Traipe L, Goya C. High frequency of digital eye strain and dry eye disease in teleworkers during the coronavirus disease (2019) pandemic. Int J Occup Saf Ergon. 2022;28:1787–92.
Gayton JL. Etiology, prevalence, and treatment of dry eye disease. Clin Ophthalmol. 2009;3:405–12.
O’Neil EC, Henderson M, Massaro-Giordano M, Bunya VY. Advances in dry eye disease treatment. Curr Opin Ophthalmol. 2019;30:166.
Bayer IS. Recent advances in mucoadhesive interface materials, mucoadhesion characterization, and technologies. Adv Mater Interfaces. 2022;9:2200211.
Gote V, Sikder S, Sicotte J, Pal D. Ocular drug delivery: present innovations and future challenges. J Pharmacol Exp Ther. 2019;370:602–24.
Gaudana R, Jwala J, Boddu SH, Mitra AK. Recent perspectives in ocular drug delivery. Pharm Res. 2009;26:1197–216.
Sall K, Stevenson OD, Mundorf TK, Reis BL, CsA Phase 3 Study Group. Two multicenter, randomized studies of the efficacy and safety of cyclosporine ophthalmic emulsion in moderate to severe dry eye disease. J Ophthalmol. 2000;107:631–9.
Barber LD, Pflugfelder SC, Tauber J, Foulks GN. Phase III safety evaluation of cyclosporine 0.1% ophthalmic emulsion administered twice daily to dry eye disease patients for up to 3 years. J Ophthalmol. 2005;112:1790–4.
Erfani A, Seaberg J, Aichele CP, Ramsey JD. Interactions between biomolecules and zwitterionic moieties: a review. Biomacromolecules. 2020;21:2557–73.
Asha AB, Chen Y, Narain R. Bioinspired dopamine and zwitterionic polymers for non-fouling surface engineering. Chem Soc Rev. 2021;50:11668–83.
Banskota S, Yousefpour P, Kirmani N, Li X, Chilkoti A. Long circulating genetically encoded intrinsically disordered zwitterionic polypeptides for drug delivery. Biomaterials. 2019;192:475–85.
Li B, Yuan Z, Zhang P, Sinclair A, Jain P, Wu K, Tsao C, **e J, Hung HC, Lin X. Zwitterionic nanocages overcome the efficacy loss of biologic drugs. Adv Mater. 2018;30:1705728.
Zhao G, Dong X, Sun Y. Self-assembled curcumin–poly (carboxybetaine methacrylate) conjugates: potent nano-inhibitors against amyloid β-protein fibrillogenesis and cytotoxicity. Langmuir. 2018;35:1846–57.
Mengistu DH, Bohinc K, May S. Binding of DNA to zwitterionic lipid layers mediated by divalent cations. J Phys Chem B. 2009;113:12277–82.
Iwasaki Y, Ishihara K. Phosphorylcholine-containing polymers for biomedical applications. Anal Bioanal Chem. 2005;381:534–46.
Lin X, Fukazawa K, Ishihara K. Photoinduced inhibition of DNA unwinding in vitro with water-soluble polymers containing both phosphorylcholine and photoreactive groups. Acta Biomater. 2016;40:226–34.
Kang S, Lee M, Kang M, Noh M, Jeon J, Lee Y, Seo JH. Development of anti-biofouling interface on hydroxyapatite surface by coating zwitterionic MPC polymer containing calcium-binding moieties to prevent oral bacterial adhesion. Acta Biomater. 2016;40:70–7.
Ishihara K. Revolutionary advances in 2-methacryloyloxyethyl phosphorylcholine polymers as biomaterials. J Biomed Mater Res Part A. 2019;107:933–43.
Suzuki O. How the Japanese Society for Biomaterials established interdisciplinary studies in biomaterials science. J Biomed Mater Res Part A. 2019;107:917–29.
Nagai N, Sakurai S, Seiriki R, Minami M, Yamaguchi M, Deguchi S, Harata E. MPC Polymer promotes recovery from dry eye via stabilization of the ocular surface. Pharmaceutics. 2021;13:168.
Zheng Y, Yan Y, Zhao W, Wang H, Sun Y, Han J, Zhang H. Self-assembled nanospheres with enhanced interfacial lubrication for the treatment of osteoarthritis. ACS Appl Mater Interfaces. 2022;14:21773–86.
Lin W, Klein J. Hydration lubrication in biomedical applications: from cartilage to hydrogels. Acc Mater Res. 2022;3:213–23.
Kalasin S, Letteri R, Emrick T, Santore M. Adsorbed polyzwitterion copolymer layers designed for protein repellency and interfacial retention. Langmuir. 2017;33:13708–17.
Li Q, Cao Y, Wang P. Recent advances in hydrogels for the diagnosis and treatment of dry eye disease. Gels. 2022;8:816.
Li S, Lu Z, Huang Y, Wang Y, ** Q, Shentu X, Ye J, Yao K, Han H. Anti-oxidative and anti‐inflammatory micelles: break the dry eye vicious cycle. Adv Sci. 2022;9:2200435.
Han H, Li S, Xu M, Zhong Y, Fan W, Xu J, Zhou T, Ji J, Ye J, Yao K. Polymer-and lipid-based nanocarriers for ocular drug delivery: current status and future perspectives. Adv Drug Deliv Rev. 2023;196:114770.
Stern ME, Pflugfelder SC. Inflammation in dry eye. Ocul Surf. 2004;2:124–30.
Zhang W, Wang R, Sun Z, Zhu X, Zhao Q, Zhang T, Cholewinski A, Yang FK, Zhao B, Pinnaratip R. Catechol-functionalized hydrogels: biomimetic design, adhesion mechanism, and biomedical applications. Chem Soc Rev. 2020;49:433–64.
Kim K, Kim K, Ryu JH, Lee H. Chitosan-catechol: a polymer with long-lasting mucoadhesive properties. Biomaterials. 2015;52:161–70.
Tang Z, Miao Y, Zhao J, **ao H, Zhang M, Liu K, Zhang X, Huang L, Chen L, Wu H. Mussel-inspired biocompatible polydopamine/carboxymethyl cellulose/polyacrylic acid adhesive hydrogels with UV-shielding capacity. Cellulose. 2021;28:1527–40.
Liu Y, Ai K, Ji X, Askhatova D, Du R, Lu L, Shi J. Comprehensive insights into the multi-antioxidative mechanisms of melanin nanoparticles and their application to protect brain from injury in ischemic stroke. J Am Chem Soc. 2017;139:856–62.
Zhao H, Zeng Z, Liu L, Chen J, Zhou H, Huang L, Huang J, Xu H, Xu Y, Chen Z. Polydopamine nanoparticles for the treatment of acute inflammation-induced injury. Nanoscale. 2018;10:6981–91.
Zhao W, Wang H, Han Y, Wang H, Sun Y, Zhang H. Dopamine/phosphorylcholine copolymer as an efficient joint lubricant and ROS scavenger for the treatment of osteoarthritis. ACS Appl Mater Interfaces. 2020;12:51236–48.
Hodges RR, Dartt DA. Tear film mucins: front line defenders of the ocular surface; comparison with airway and gastrointestinal tract mucins. Exp Eye Res. 2013;117:62–78.
Oh S, Wilcox M, Pearson JP, Borrós S. Optimal design for studying mucoadhesive polymers interaction with gastric mucin using a quartz crystal microbalance with dissipation (QCM-D): comparison of two different mucin origins. Eur J Pharm Biopharm. 2015;96:477–83.
Ahn BK. Perspectives on mussel-inspired wet adhesion. J Am Chem Soc. 2017;139:10166–71.
Yang J, Keijsers J, Van Heek M, Stuiver A, Stuart MAC, Kamperman M. The effect of molecular composition and crosslinking on adhesion of a bio-inspired adhesive. Polym Chem. 2015;6:3121–30.
Burzio LA, Waite JH. Cross-linking in adhesive quinoproteins: studies with model decapeptides. Biochemistry. 2000;39:11147–53.
Hu J, Yang L, Yang P, Jiang S, Liu X, Li Y. Polydopamine free radical scavengers. Biomater Sci. 2020;8:4940–50.
Evangelista M, Koverech A, Messano M, Pescosolido N. Comparison of three lubricant eye drop solutions in dry eye patients. Optom Vis Sci. 2011;88:1439–44.
Ma L, Gaisinskaya-Kipnis A, Kampf N, Klein J. Origins of hydration lubrication. Nat Commun. 2015;6:6060.
Xu S, Nilles JM, Bowen KH Jr. Zwitterion formation in hydrated amino acid, dipole bound anions: how many water molecules are required? J Chem Phys. 2003;119:10696–701.
Pontremoli C, Barbero N, Viscardi G, Visentin S. Mucin–drugs interaction: the case of theophylline, prednisolone and cephalexin. Bioorg Med Chem. 2015;23:6581–6.
Hu S, Pei X, Duan L, Zhu Z, Liu Y, Chen J, Chen T, Ji P, Wan Q, Wang J. A mussel-inspired film for adhesion to wet buccal tissue and efficient buccal drug delivery. Nat Commun. 2021;12:1689.
Yusa SI, Oka D, Iwasaki Y, Ishihara K. pH-responsive association behavior of biocompatible random copolymers containing pendent phosphorylcholine and fatty acid. Langmuir. 2021;38:5119–27.
Zhang H, Zhao T, Newland B, Duffy P, Annaidh AN, O’Cearbhaill ED, Wang W. On-demand and negative-thermo-swelling tissue adhesive based on highly branched ambivalent PEG–catechol copolymers. J Mat Chem B. 2015;3:6420–8.
Lee H, Scherer NF, Messersmith PB. Single-molecule mechanics of mussel adhesion. Proc Natl Acad Sci U S A. 2006;103:12999–3003.
Dartt DA. Regulation of mucin and fluid secretion by conjunctival epithelial cells. Prog Retin Eye Res. 2002;21:555–76.
Crouzier T, Boettcher K, Geonnotti AR, Kavanaugh NL, Hirsch JB, Ribbeck K, Lieleg O. Modulating mucin hydration and lubrication by deglycosylation and polyethylene glycol binding. Adv Mater Interfaces. 2015;2:1500308.
Asha AB, Chen Y, Zhang H, Ghaemi S, Ishihara K, Liu Y, Narain R. Rapid mussel-inspired surface zwitteration for enhanced antifouling and antibacterial properties. Langmuir. 2018;35:1621–30.
Dague E, Le DTL, Zanna S, Marcus P, Loubiere P, Mercier-Bonin M. Probing in vitro interactions between Lactococcus lactis and mucins using AFM. Langmuir. 2010;26:11010–7.
Narkar AR, Cannon E, Yildirim-Alicea H, Ahn K. Catechol-functionalized chitosan: optimized preparation method and its interaction with Mucin. Langmuir. 2019;35:16013–23.
Asha AB, Peng YY, Cheng Q, Ishihara K, Liu Y, Narain R. Dopamine assisted self-cleaning, antifouling, and antibacterial coating via dynamic covalent interactions. ACS Appl Mater Interfaces. 2022;14:9557–69.
Ryu JH, Messersmith PB, Lee H. Polydopamine surface chemistry: a decade of discovery. ACS Appl Mater Interfaces. 2018;10:7523–40.
Sosnik A, Raskin MM. Polymeric micelles in mucosal drug delivery: challenges towards clinical translation. Biotechnol. Adv. 2015;33:1380–92.
Marczynski M, Käsdorf BT, Altaner B, Wenzler A, Gerland U, Lieleg O. Transient binding promotes molecule penetration into mucin hydrogels by enhancing molecular partitioning. Biomater Sci. 2018;6:3373–87.
Lv Y, Yang SJ, Du Y, Yang HC, Xu ZK. Co-deposition kinetics of polydopamine/polyethyleneimine coatings: effects of solution composition and substrate surface. Langmuir. 2018;34:13123–31.
Zangmeister RA, Morris TA, Tarlov MJ. Characterization of polydopamine thin films deposited at short times by autoxidation of dopamine. Langmuir. 2013;29:8619–28.
Zheng HT, Bui HL, Chakroborty S, Wang Y, Huang CJ. PEGylated metal-phenolic networks for antimicrobial and antifouling properties. Langmuir. 2019;35:8829–39.
Jhiang JS, Wu TH, Chou CJ, Chang Y, Huang CJ. Gel-like ionic complexes for antimicrobial, hemostatic and adhesive properties. J Mat Chem B. 2019;7:2878–87.
Luo LJ, Lin TY, Yao CH, Kuo PY, Matsusaki M, Harroun SG, Huang CC, Lai JY. Dual-functional gelatin-capped silver nanoparticles for antibacterial and antiangiogenic treatment of bacterial keratitis. J Colloid Interface Sci. 2019;536:112–26.
Lai JY, Luo LJ, Ma DHK. Effect of cross-linking density on the structures and properties of carbodiimide-treated gelatin matrices as limbal stem cell niches. Int J Mol Sci. 2018;19:3294.
** K, Ge Y, Ye Z, Pan X, Yan Y, Mao Z, Ye J. Anti-oxidative and mucin-compensating dual-functional nano eye drops for synergistic treatment of dry eye disease. Appl Mater Today. 2022;27:101411.
Lin PH, Jian HJ, Li YJ, Huang YF, Anand A, Huang CC, Lin HJ, Lai JY. Alleviation of dry eye syndrome with one dose of antioxidant, anti-inflammatory, and mucoadhesive lysine-carbonized nanogels. Acta Biomater. 2022;141:140–50.
Aygün A, Özdemir S, Gülcan M, Cellat K, Şen F. Synthesis and characterization of Reishi mushroom-mediated green synthesis of silver nanoparticles for the biochemical applications. J Pharm Biomed Anal. 2020;178:112970.
Das D, Nath BC, Phukon P, Dolui SK. Synthesis and evaluation of antioxidant and antibacterial behavior of CuO nanoparticles. Colloid Surf B-Biointerfaces. 2013;101:430–3.
Li YJ, Luo LJ, Harroun SG, Wei SC, Unnikrishnan B, Chang HT, Huang YF, Lai JY, Huang CC. Synergistically dual-functional nano eye-drops for simultaneous anti-inflammatory and anti-oxidative treatment of dry eye disease. Nanoscale. 2019;11:5580–94.
Zhang J, Fu Y, Yang P, Liu X, Li Y, Gu Z. ROS scavenging biopolymers for anti-inflammatory diseases: classification and formulation. Adv Mater Interfaces. 2020;7:2000632.
Wen X, Xu S, Liu H, Zhang Q, Liang H, Yang C, Wang H. Neurotoxicity induced by bupivacaine via T-type calcium channels in SH-SY5Y cells. PLoS ONE. 2013;8:e62942.
Zhivotovsky B, Orrenius S. Calcium and cell death mechanisms: a perspective from the cell death community. Cell Calcium. 2011;50:211–21.
McCulley JP, Shine WE. The lipid layer of tears: dependent on meibomian gland function. Exp Eye Res. 2004;78:361–5.
**ong C, Chen D, Liu J, Liu B, Li N, Zhou Y, Liang X, Ma P, Ye C, Ge J. A rabbit dry eye model induced by topical medication of a preservative benzalkonium chloride. Invest Ophthalmol Vis Sci. 2008;49:1850–6.
Milner MS, Beckman KA, Luchs JI, Allen QB, Awdeh RM, Berdahl J, Boland TS, Buznego C, Gira JP, Goldberg DF. Dysfunctional tear syndrome: dry eye disease and associated tear film disorders–new strategies for diagnosis and treatment. Curr Opin Ophthalmol. 2017;28:3.
Guo H, Lee C, Shah M, Janga SR, Edman MC, Klinngam W, Hamm-Alvarez SF, MacKay JA. A novel elastin-like polypeptide drug carrier for cyclosporine A improves tear flow in a mouse model of Sjögren’s syndrome. J Control Release. 2018;292:183–95.
Kheirkhah A, Satitpitakul V, Hamrah P, Dana R. Patients with dry eye disease and low subbasal nerve density are at high risk for an accelerated corneal endothelial cell loss. Cornea. 2017;36:196.
Yang S, Lee HJ, Kim DY, Shin S, Barabino S, Chung SH. The use of conjunctival staining to measure ocular surface inflammation in patients with dry eye. Cornea. 2019;38:698–705.
Miller WL, Doughty MJ, Narayanan S, Leach NE, Tran A, Gaume AL, Bergmanson JP. A comparison of tear volume (by tear meniscus height and phenol red thread test) and tear fluid osmolality measures in non-lens wearers and in contact lens wearers. Eye Contact Lens-Sci Clin Pra. 2004;30:132–7.
Koh S, Ikeda C, Watanabe S, Oie Y, Soma T, Watanabe H, Maeda N, Nishida K. Effect of non-invasive tear stability assessment on tear meniscus height. Acta Ophthalmol. 2015;93:e135–9.
Acknowledgements
The research was financially supported by grant MOST110-2221-E-182-001-MY3 from the National Science and Technology Council of Taiwan; grant CMRPD2N0121 from Chang Gung Memorial Hospital, Linkou; grant NHRI-EX113-11128EI from the National Health Research Institutes of Taiwan; and grant OMRPD2N0011 from Chang Gung University.
Ethics declarations
Conflict of interest
The authors declare no financial competing interests.
Additional information
Publisher’s Note
Springer Nature remains neutral with regard to jurisdictional claims in published maps and institutional affiliations.
Electronic supplementary material
Below is the link to the electronic supplementary material.
Rights and permissions
Open Access This article is licensed under a Creative Commons Attribution 4.0 International License, which permits use, sharing, adaptation, distribution and reproduction in any medium or format, as long as you give appropriate credit to the original author(s) and the source, provide a link to the Creative Commons licence, and indicate if changes were made. The images or other third party material in this article are included in the article’s Creative Commons licence, unless indicated otherwise in a credit line to the material. If material is not included in the article’s Creative Commons licence and your intended use is not permitted by statutory regulation or exceeds the permitted use, you will need to obtain permission directly from the copyright holder. To view a copy of this licence, visit http://creativecommons.org/licenses/by/4.0/. The Creative Commons Public Domain Dedication waiver (http://creativecommons.org/publicdomain/zero/1.0/) applies to the data made available in this article, unless otherwise stated in a credit line to the data.
About this article

Cite this article
Bui, H.L., Su, YH., Yang, CJ. et al. Mucoadhesive, antioxidant, and lubricant catechol-functionalized poly(phosphobetaine) as biomaterial nanotherapeutics for treating ocular dryness. J Nanobiotechnol 22, 160 (2024). https://doi.org/10.1186/s12951-024-02448-x
Received:
Accepted:
Published:
DOI: https://doi.org/10.1186/s12951-024-02448-x