
Abstract
Background
As the prolonged COVID-19 pandemic continues, severe seasonal Influenza (flu) may happen alongside COVID-19. This could cause a “twindemic”, in which there are additional burdens on health care resources and public safety compared to those occurring in the presence of a single infection. Amidst the raising trend of co-infections of the two diseases, forecasting both Influenza-like Illness (ILI) outbreaks and COVID-19 waves in a reliable and timely manner becomes more urgent than ever. Accurate and real-time joint prediction of the twindemic aids public health organizations and policymakers in adequate preparation and decision making. However, in the current pandemic, existing ILI and COVID-19 forecasting models face shortcomings under complex inter-disease dynamics, particularly due to the similarities in symptoms and healthcare-seeking patterns of the two diseases.
Methods
Inspired by the interconnection between ILI and COVID-19 activities, we combine related internet search and bi-disease time series information for the U.S. national level and state level forecasts. Our proposed ARGOX-Joint-Ensemble adopts a new ensemble framework that integrates ILI and COVID-19 disease forecasting models to pool the information between the two diseases and provide joint multi-resolution and multi-target predictions. Through a winner-takes-all ensemble fashion, our framework is able to adaptively select the most predictive COVID-19 or ILI signals.
Results
In the retrospective evaluation, our model steadily outperforms alternative benchmark methods, and remains competitive with other publicly available models in both point estimates and probabilistic predictions (including intervals).
Conclusions
The success of our approach illustrates that pooling information between the ILI and COVID-19 leads to improved forecasting models than individual models for either of the disease.
Plain language summary
Data from the internet enables the presence of infectious diseases such as influenza (flu) to be tracked and monitored. During the ongoing COVID-19 pandemic people will also be infected with flu, impacting health care providers. Predicting both COVID-19 and flu outbreaks in a timely manner enables health care providers and policymakers to prepare for the outbreaks. In this work, we develop a model to jointly predict cases of both COVID-19 and influenza-like illness that can be used at national and state levels in the USA. Our approach is more accurate than alternative similar approaches that predict cases of a single disease, showing the value of predicting the incidence of multiple diseases at the same time.
Introduction
The rising numbers of co-infections of COVID-19 and Influenza (flu)1,2 have raised serious concerns about the potential of a “twindemic” among the general public3. This is also evident in the remarkable similarity between epidemic trends of flu and COVID-19 (Fig. 1). The fast-develo** COVID-19 pandemic, coupled with a severe flu season, would overwhelm the already heavily-burdened health care systems, causing further inconceivable losses4. This calls for an urgent need to establish an accurate and robust bi-disease tracking/forecasting system to provide public health officials with reliable, timely information to make informed decisions to control and prevent the onset of a “twindemic”. To this end, we propose ARGOX-Joint-Ensemble, a principled framework that utilizes the connectivity between flu and COVID-19 to integrate previously proposed forecasting models and adapt to a new era where flu and COVID-19 co-evolve.
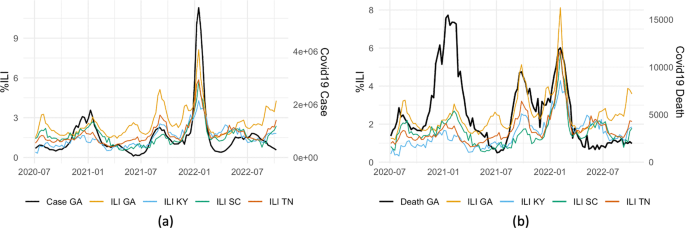
a COVID-19 real-time cases in GA (thick black curve) vs. lagged 1 week %ILI in GA (yellow curve) and the neighboring states; (b) COVID-19 real-time deaths in GA (thick black curve) and lagged 3 weeks %ILI in GA (yellow curve) and the neighboring states. The underlying data is found in Supplementary Data 1.
Accurate tracking of flu outbreaks and trends is important but non-trivial. In fact, flu affects 9-41 million people annually between 2010-2020 seasons in the United States, resulting in between 12 and 52 thousands of deaths5. For decades, the U.S. Centers for Disease Control and Prevention (CDC) monitors flu activities through Influenza-like Illness Surveillance Network (ILINet), which collects the number of outpatients with Influenza-like Illness (ILI) from thousands of healthcare providers and publishes the weekly ILI percentages (%ILI, i.e., the percentages of outpatients with ILI) at the national, regional levels (10 Health and Human Services (HHS) regions in the US), and state levels. However, due to the time required for data collection and administrative processing, the ILI reports from CDC lag behind real time by 1–2 weeks, and thus unable to provide most accurate and timely information on the disease development. Numerous ILI tracking approaches have therefore been proposed, utilizing statistical models6,7, mechanistic models such as compartmental models8,9,10,11, ensemble approaches12, and deep learning models13,14. Several approaches rely on external signals such as environmental conditions and weather reports15,16; social media, such as Twitter posts17,18 and Wikipedia article views19,20; search engine data, such as: Google21,22,23,24,25, Yahoo26, and Baidu internet searches27.
Similarly, many ILI forecasting approaches are adapted and modified to predict the newly emerged COVID-19 pandemic8,28. In particular, machine learning (data-driven) methods28,29,30 and compartmental models31,32,33 are the most popular and prevailing approaches for the publicly-available COVID-19 spread forecasts, according to the weekly forecast reports compiled by CDC34. Yet, they also do not capture the inter-correlation between the two diseases, which could be a crucial factor as both infectious diseases co-evolve.
Evidently, COVID-19 is very likely to circulate for a long period of time and co-evolve with ILI, especially when COVID-19 variants continue to evolve1. Hence, a unified robust forecasting framework for both diseases is eminently indispensable.
Despite the development in the methodology tracking individual diseases, joint tracking of flu and COVID-19 remains challenging. In the midst of the on-going COVID-19 pandemic, %ILI collected by CDC may get “contaminated” in the current season, due to symptomatic similarities with COVID-19 as well as various biological and demographic factors. On the other hand, ILI outbreaks can potentially assist COVID-19 cases and deaths predictions, due to the proximity between the two diseases. However, the inter-correlation between COVID-19 and ILI is latent and varies across geographical areas, which can be challenging to capture and utilize for forecasts.
Few attempts have been made to study the connection between COVID-19 and ILI trends, or to incorporate their simultaneous growths for forecasting, while considering the geographical dependence structure (at the state-level). Most of the existing works adapted ILI forecasting model framework and applied towards COVID-19 predictions, or vise-versa. For example, ref. 35 studies the ILI vaccination rates’ correlation with COVID-19 deaths, and states its potential prediction power of deaths’ trends. ref. 36 extends this study to identify association between vaccination rates and COVID-19 infection, deaths and hospitalization, as well as arguing for their forecasting potentials. ref. 37 uses incidence patterns from past flu seasons, COVID-19 time series information, and demographic covariates in a Generalized Linear Model to forecast next week’s county-level case counts, under mild assumptions on the similarity of the transmission mechanisms between COVID-19 and flu. ref. 38, on the other hand, explores seasonal similarities between historical flu seasons and current COVID-19 related signals using a deep clustering module (learn lower-dimensional representation of the signals and reconstruct for forecasting using attention), and produces 1 week ahead independent state-level ILI forecasts.
Inspired by the affinity between ILI and COVID-19’s growth trends (Fig. 1), we propose to leverage external COVID-related signals (confirmed cases), along with relevant public search information, for Influenza-like Illness (%ILI) forecasts, and vise-versa for COVID-19 cases and deaths predictions. Yet, to build a COVID-ILI joint prediction model with online search data, many challenges remain to be addressed. For example, the COVID-ILI co-evolution is a new phenomenon, with limited external signals, while relevant internet search information can be noisy and unstable; hence, it would be a great challenge to efficiently learn the model under data paucity and data instability.
Here we propose ARGOX-Joint-Ensemble, a principled way to integrate and adapt previously proposed flu and COVID-19 forecasting models to “unseen” scenarios where flu and COVID co-exist. In particular, we modified previously proposed forecasting models by incorporating COVID-19 signals for flu predictions and vise-versa for COVID-19 forecasts. We consolidated the models for two diseases through a spatial-temporal fashion to efficiently capture and incorporate COVID-ILI signals for state-level forecasts, while maintaining model features for national-level forecasts. Finally, we employ an ensemble approach to efficiently combine COVID and flu forecasting methods into one joint framework, which is able to effectively shift focuses between COVID and ILI signals for both diseases’ forecasts, and produce robust forecasts despite unstable search information signals as inputs. The ensemble framework is systematic and comprehensive. Each data-driven sub-model within the framework is intentionally straightforward and unified to prevent over-fitting. Numerical comparisons show that our method performs competitively with other publicly available single-disease forecasting methods. This study further emphasizes the general applicability and the predictive power of online search data for various tasks in disease surveillance.
Methods
Data acquisition and pre-processing
This paper focuses on the 50 states of the United States, plus Washington D.C for COVID-19 cases and deaths forecasting, while excluding Florida (whose ILI data is not available from CDC) and including New York City and Washington D.C. for %ILI forecasting. For COVID-19 cases and deaths forecasting, we use confirmed cases, confirmed deaths, confirmed new hospital admissions (hospitalization), ILI and Google search query frequencies as inputs. For %ILI forecasting, we use lagged %ILI, COVID-19 cases, and Google search query frequencies as inputs.
COVID-19 reporting data
We use reported COVID-19 confirmed cases and deaths of United States from New York Times (NYT)39 as features in our model. We also use COVID-19 confirmed new hospital admissions (hospitalization) released by U.S. Department of Health and Human Services (HHS)40 as features for our COVID-19 death forecasts. When comparing against other benchmark methods published in CDC COVID-19 Forecast Hub34, we use COVID-19 confirmed cases and deaths from JHU CSSE COVID-19 dataset41, a curated dataset used by the CDC at their official website, as the groundtruth. We do not use JHU COVID-19 dataset as input features in our model because JHU COVID-19 dataset retrospectively corrects past confirmed cases and deaths due to reporting error or changes in federal and state policies. NYT dataset, on the other hand, does not revise past data, which gives more realistic forecasts based on the real-time. All data sources are collected from January 21, 2020 to August 13, 2022.
CDC’s ILINet data
CDC releases a report of %ILI for the previous week every Friday, which contains the percent of outpatient visits with influenza-like illness for the whole nation, 10 HHS regions, 50 states (except Florida), Washington DC, and New York City (separated from New York State)42. CDC’s %ILI data for this study are collected from January 21, 2020 to August 13, 2022.
Google search data
The online search data used in this paper is obtained from Google Trends43, where one can obtain the search frequencies of a term of interest in a specific region, time frame, and time frequency by ty** in the search query on the website. With Google Trends API, we are able to obtain a daily time series of the search frequencies for the term of interest, including all searches that contain all of its words (un-normalized)43.
We use 23 highly correlated COVID-19 related Google search queries discovered in prior study44 (in daily frequency) for COVID-19 cases and deaths forecasts, while using ILI related queries (weekly frequency) from previous study22,24 for %ILI forecasts. We obtain the search queries for national, regional (summation from states) and state level. For COVID-19 forecasts, we follow the prior work’s data cleaning procedures44, and find the optimal lag of each Google search query from COVID-19 cases/deaths44 (shown in Table S3 in Supplementary Tables) as inputs to the forecasting models. Figure S1a and S2b (Supplementary Figures) show that the peak of COVID-19 search volume for query “loss of taste” ahead of the peak in reported cases and deaths, confirming strong connections between people’s search behaviors and COVID-19 trends.
%ILI data imputation
%ILI is weekly indexed while COVID-19 cases and deaths are daily indexed. As we propose a joint forecast framework for both COVID-19 cases/deaths and %ILI in this study, the discrepancy in time stamps between the two needs to be resolved. For this study, we impute daily %ILI as the same number as weekly %ILI, assuming the daily proportion of patients with ILI symptoms is consistent with the weekly number. Imputing daily data also enables larger training sets. We also included a sensitivity analysis in Table S10 (Supplementary Tables).
Forecasting methods
National level
We propose a joint framework for national level COVID-19 cases and deaths prediction, by additionally incorporating flu information in the previously proposed national COVID-19 forecast model44. Similarly, we also include COVID-19 cases information for %ILI predictions in the Influenza-like Illness forecast model22. Both of the COVID-19 and ILI models are based on the ARGO (AutoRegressive with exogenous GOogle search) method.
Specifically, motivated by the robust performance of ARGO method44 and the connection between COVID-19 cases/deaths and lagged %ILI (Fig. 1), we add lagged daily imputed %ILI information in the L1 penalized LASSO regression as extra exogenous variables to produce future 28 days’ COVID-19 cases and death predictions. That is, we use lagged cases, Google search and ILI information as exogenous variables for COVID-19 cases forecasts, and use lagged hospitalization, deaths, Google search and ILI information for COVID-19 death forecasts. Then, we aggregate the daily predictions into future 4 weeks ahead forecasts for reporting and evaluation, consistent with other publicly available benchmark methods. Meanwhile for ILI, we obtain accurate estimates of 1–2 weeks ahead national %ILI using the ARGO method22, by additionally incorporating national COVID-19 cases (weekly aggregated) as exogenous variables. Detailed regression formulations are included in the Supplementary Methods section “ARGO-Nat Prediction”. We denote this method as bi-disease “ARGO-Nat” method, where “Nat” means national-level.
State level
To handle the complicated disease dynamic when COVID-ILI co-evolves, we propose a new ensemble framework, “ARGOX-Joint-Ensemble”, which uses joint COVID-ILI information to guide previously proposed disease forecasting methods for unified COVID-19 and %ILI state-level forecasting.
A high-level illustration of our propose method is shown in Fig. 2, where ARGOX-Joint-Ensemble operates in 3 steps.

The top-to-bottom procedure of ARGOX-Joint-Ensemble is presented, starting with raw data input and ending with state-level forecasting outputs. The procedures to forecast COVID-19 cases/deaths are in color blue (left), and the procedures to forecast %ILI is in color red (right). Google: Google search data; NYT: New York Times published COVID-19 data.
In the first step, we gather the raw estimates of COVID-19 cases/deaths (left of Fig. 2) and raw estimates of %ILI (right of Fig. 2) in different geographical resolution. For COVID-19, our raw estimates for state m week τ cases/deaths yτ,m are \({\hat{y}}_{\tau ,m}^{GT}\), \({\hat{y}}_{\tau ,{r}_{m}}^{reg}\), \({\hat{y}}_{\tau }^{nat}\), and yτ−1,m, where rm is the region number for state m. Here, we denote GT and reg to be state/regional estimates with internet search information only, and nat to be national estimates (same as prior study44). Similarly, we obtain the raw estimates for state m weekly %ILI pτ,m: \({\hat{p}}_{\tau ,m}^{GT}\)24, \({\hat{p}}_{\tau ,{r}_{m}}^{reg}\)23, \({\hat{p}}_{\tau }^{nat}\)22, pτ−1,m.
In the second step, we fit two models separately using the raw estimates from step 1 as inputs. Motivated by the connection between lagged neighboring states’ %ILI and real-time COVID-19 trends (Fig. 1), we first propose the bi-disease “ARGOX-Local” method. For COVID-19 cases/deaths predictions, bi-disease ARGOX-Local incorporates neighboring state’s %ILI information; similarly for %ILI predictions, bi-disease ARGOX-Local includes neighboring state’s COVID-19 cases. Besides bi-disease ARGOX-Local, we also directly employ the previously proposed single-disease forecasting models for COVID-1944 and %ILI24 in the second step, since they have already demonstrated robust results prior to the newly emerged bi-disease dynamics.
In the third (last) step, we gather the two methods in step 2, to produce the final winner-takes-all ensemble predictions for future 4 weeks COVID-19 cases/deaths and future 2 weeks %ILI. Particularly, for a training period of (overlap**) 15 weeks, we evaluate both predictors (from two models in the second step) with mean squared error (MSE) and select the one with lowest MSE as the ensemble predictor for future weeks.
Implementation details about bi-disease ARGOX-Local, and the final ensemble step ARGOX-Joint-Ensemble, as well as the modifications on previously proposed single-disease forecasting models for COVID-1944 and %ILI24, are presented in the Supplementary Methods section “Newly Proposed Bi-disease ARGOX-Local”. Detailed ARGOX-Joint-Ensemble’s prediction interval calculation is also included in the Supplementary Methods section “ARGOX-Joint-Ensemble”.
Reporting summary
Further information on research design is available in the Nature Portfolio Reporting Summary linked to this article.
Results
In this section, we conduct retrospective estimation of the 1–4 weeks ahead COVID-19 cases and deaths, and 1-2 weeks ahead %ILI, at the US national and state level for the period of July 4, 2020 to August 13, 2022. We analyze our joint framework’s performances by conducting comparison analysis with our own methods, as well as with other publicly available methods from CDC Forecast Hub34,45,46,47,48,49,62. In addition, CDC FluSight is also investigating additional surveillance components to track seasonal influenza activities, including laboratory-confirmed influenza hospital admissions63. Therefore, considering alternative influenza activities’ indicators as forecasting targets and/or exogenous information in the model could be an important future direction.
In light of recurrent Influenza-like Illness waves and the prolonged COVID-19 pandemic, accurate joint-disease tracking of epidemic activity at different geographical levels has become more important than ever. Our ARGO-Nat and ARGOX-Joint-Ensemble provide high-precision national and state-level surveillance information, which would enable timely decision making and optimal resource reallocation in the face of a potential twindemic. The reliable estimations by our joint COVID-ILI framework give public more insights into both diseases and can serve as valuable resources for public health officials.
Data availability
The online search data sets that support the findings of this study are all publicly available. The Google search data is obtained from Google Trends43, and also deposited to Harvard Dataverse (https://doi.org/10.7910/DVN/PGNBAX)64. The downloading date of COVID-19 related Google search data is 2022-08-14 and the downloading date of %ILI related Google search data is 2022-09-11. The COVID-19 confirmed cases and deaths data are publicly available from JHU CSSE COVID-19 dataset41, while hospitalization data are publicly available from HHS40 and the official CDC Forecast Hub34. %ILI data are publicly available from CDC5.
The numerical data plotted in Fig. 1 is available in Supplementary Data 1.
Code availability
The code to reproduce the results shown in this study is available under https://zenodo.org/badge/latestdoi/47678721365.
References
Hassan, J. What is ‘flurona’? coronavirus and influenza co-infections reported as omicron surges. The Washington Post https://www.washingtonpost.com/health/2022/01/05/flurona-coronavirus-flu-symptoms (2022).
Swets, M. C. et al. Sars-cov-2 co-infection with influenza viruses, respiratory syncytial virus, or adenoviruses. Lancet 399, 1463–1464 (2022).
Berger, M. The world has avoided a ‘twindemic`, but as flu cases rise alongside covid, experts fear that could change. The Washington Post, (2022).
Rubin, R. What happens when covid-19 collides with flu season? JAMA 324, 923–925 (2020).
Center for Disease Control and Prevention. Disease burden of flus, (2021). https://www.cdc.gov/flu/about/burden/index.html, Last accessed on 2021-12-30.
Brooks, L. C., Farrow, D. C., Hyun, S., Tibshirani, R. J. & Rosenfeld, R. Nonmechanistic forecasts of seasonal influenza with iterative one-week-ahead distributions. PLoS Comput. Biol. 14, e1006134 (2018).
Osthus, D., Gattiker, J., Priedhorsky, R. & Del Valle, S. Y. Dynamic bayesian influenza forecasting in the united states with hierarchical discrepancy (with discussion). Bayesian Anal. 14, 261–312 (2019).
Shaman, J. & Karspeck, A. Forecasting seasonal outbreaks of influenza. Proc. Natl. Acad Sci. 109, 20425–20430 (2012).
Tizzoni, M. et al. Real-time numerical forecast of global epidemic spreading: case study of 2009 a/h1n1pdm. BMC Med. 10, 1–31 (2012).
Yang, W., Karspeck, A. & Shaman, J. Comparison of filtering methods for the modeling and retrospective forecasting of influenza epidemics. PLoS Comput. Biol. 10, e1003583 (2014).
Yang, W., Lipsitch, M. & Shaman, J. Inference of seasonal and pandemic influenza transmission dynamics. Proc. Natl. Acad. Sci. 112, 2723–2728 (2015).
Reich, N. G. et al. A collaborative multiyear, multimodel assessment of seasonal influenza forecasting in the united states. Proc. Natl. Acad. Sci. 116, 3146–3154 (2019).
Wang, L., Chen, J. & Marathe, M. Defsi: Deep learning based epidemic forecasting with synthetic information. In Proceedings of the AAAI Conference on Artificial Intelligence. volume 33, pages 9607–9612, (2019).
Venna, S. R. et al. A novel data-driven model for real-time influenza forecasting. IEEE Access 7, 7691–7701 (2018).
Shaman, J., Pitzer, V. E., Viboud, C. écile, Grenfell, B. T. & Lipsitch, M. Absolute humidity and the seasonal onset of influenza in the continental united states. PLoS Biol. 8, e1000316 (2010).
Tamerius, J. D. et al. Environmental predictors of seasonal influenza epidemics across temperate and tropical climates. PLoS Pathogens 9, e1003194 (2013).
Paul, M. J., Dredze, M. & Broniatowski, D. Twitter improves influenza forecasting. PLoS Currents, 6, (2014).
Signorini, A., Segre, A. M. & Polgreen, P. M. The use of twitter to track levels of disease activity and public concern in the us during the influenza a h1n1 pandemic. PloS one 6, e19467 (2011).
McIver, D. J. & Brownstein, J. S. Wikipedia usage estimates prevalence of influenza-like illness in the united states in near real-time. PLoS Comput. Biol. 10, e1003581 (2014).
Generous, N., Fairchild, G., Deshpande, A., Del Valle, S. Y. & Priedhorsky, R. Global disease monitoring and forecasting with wikipedia. PLoS Comput. Biol. 10, e1003892 (2014).
Ginsberg, J. et al. Detecting influenza epidemics using search engine query data. Nature 457, 1012–4 (2008).
Yang, S., Santillana, M. & Kou, S. C. Accurate estimation of influenza epidemics using google search data via argo. Proc Natl. Acad. Sci. 112, 14473–14478 (2015).
Ning, S. & Yang, S. Accurate regional influenza epidemics tracking using internet search data. Sci. Rep. 9, 5238 (2019).
Yang, S., Ning, S. & Kou, S. C. Use internet search data to accurately track state level influenza epidemics. Sci. Rep. 11(4023), (2021).
Dugas, A. F. et al. Influenza forecasting with google flu trends. PloS One 8, e56176 (2013).
Polgreen, P. M., Chen, Y., Pennock, D. M., Nelson, F. D. & Weinstein, R. A. Using internet searches for influenza surveillance. Clin. Infect. Dis. 47, 1443–1448 (2008).
Yuan, Q. et al. Monitoring influenza epidemics in china with search query from baidu. PloS One 8, e64323 (2013).
Jahja, M., Farrow, D., Rosenfeld, R. & Tibshirani, R. J. Kalman filter, sensor fusion, and constrained regression: Equivalences and insights. In H. Wallach, H. Larochelle, A. Beygelzimer, F. d’ Alché-Buc, E. Fox, and R. Garnett, editors, Advances in Neural Information Processing Systems, volume 32. Curran Associates, Inc., (2019).
Rodriguez, A. et al. Deepcovid: An operational deep learning-driven framework for explainable real-time covid-19 forecasting. In Proceedings of the AAAI Conference on Artificial Intelligence. Vol 35 (2021).
**, X., Wang, Y.-X. & Yan, X. Inter-series attention model for covid-19 forecasting. In Proceedings of the 2021 SIAM International Conference on Data Mining (SDM). https://doi.org/10.1137/1.9781611976700.56 (2021).
Chhatwal, J. et al. Pin68 covid-19 simulator: An interactive tool to inform covid-19 intervention policy decisions in the United States. Value Health 23, S556–S556 (2020).
Zou, D. et al. Epidemic model guided machine learning for COVID-19 forecasts in the united states. medRxiv. https://doi.org/10.1101/2020.05.24.20111989 (2020).
Yang, W. et al. Estimating the infection-fatality risk of sars-cov-2 in new york city during the spring 2020 pandemic wave: a model-based analysis. Lancet Infect. Dis. 21, 203–212 (2021).
Cramer E. Y. et al. The United States covid-19 forecast hub dataset. Sci Data 9, 462 (2022).
Arokiaraj M. C. Correlation of influenza vaccination and influenza incidence on covid-19 severity. Available at SSRN 3572814, (2020).
Wang, R., Liu, M. & Liu, J. The association between influenza vaccination and covid-19 and its outcomes: A systematic review and meta-analysis of observational studies. Vaccines 9, 529 (2021).
Huang, Y. & Chattopadhyay, I. Universal risk phenotype of us counties for flu-like transmission to improve county-specific covid-19 incidence forecasts. PLoS Comput. Biol. 17, e1009363 (2021).
Rodríguez A. et al. Steering a historical disease forecasting model under a pandemic: Case of flu and covid-19. In Proceedings of the AAAI Conference on Artificial Intelligence. volume 35, pages 4855–4863, (2021).
The New York Times. Coronavirus (covid-19) data in the united states, (2021). https://github.com/nytimes/COVID-19-data, Last accessed on 2021-04-03.
U.S. Department of Health and Human Services. Healthdata.gov covid-19 reported patient impact and hospital capacity by state timeseries. (2021). Last accessed on 2022-08-13. https://healthdata.gov/Hospital/COVID-19-Reported-Patient-Impact-and-Hospital-Capa/g62h-syeh
Dong, E., Du, H. & Gardner, L. An interactive web-based dashboard to track covid-19 in real time. Lancet Infect Dis, 20(5), (2020).
Center for Disease Control and Prevention. Flu activity & surveillance, (2022). https://www.cdc.gov/flu/weekly/overview.htm#ILINet, Last accessed on 2022-12-04.
Faq about google trends data. https://support.google.com/trends/answer/4365533?hl=en&ref_topic=6248052. Accessed: 2021-04-03.
Ma, S. & Yang, S. Covid-19 forecasts using internet search information in the united states. Sci. Rep. 12, 1–16 (2022).
Sheldon, D. & Gibson, C. Bayesian seird model, (2020). Accessed = 2021-04-03.
Borchering, R. K. et al. Modeling of future covid-19 cases, hospitalizations, and deaths, by vaccination rates and nonpharmaceutical intervention scenarios-united states, april–september 2021. Morb. Mortal. Wkly. Rep. 70, 719 (2021).
Castro, L, Fairchild, G, Michaud, I. & Osthus, D Coffee: Covid-19 forecasts using fast evaluations and estimation, (2020).
Lega, J. Parameter estimation from icc curves. J. Biol. Dyn. 15, 195–212 (2021).
Abbott, S et al. Estimating the time-varying reproduction number of sars-cov-2 using national and subnational case counts [version 1; peer review: awaiting peer review]. Wellcome Open Research, 5(112), (2020).
Srivastava, A., Xu, T. & Prasanna, V. K. Fast and accurate forecasting of covid-19 deaths using the sikj α model. ar**v preprint ar**v:2007.05180, (2020).
Adiga, A. et al. All models are useful: Bayesian ensembling for robust high resolution covid-19 forecasting. In Proceedings of the 27th ACM SIGKDD Conference on Knowledge Discovery & Data Mining. pages 2505–2513, (2021).
Yamana, T., Pei, S. & Shaman, J. Projection of covid-19 cases and deaths in the us as individual states re-open may 4. MedRxiv. https://doi.org/10.1101/2020.05.04.20090670 (2020).
Li, M. L. et al. Forecasting covid-19 and analyzing the effect of government interventions. Operations Research, (2022).
Karlen, D. Characterizing the spread of covid-19. ar**v preprint ar**v:2007.07156, (2020).
Bracher, J., Ray, E. L., Gneiting, T. & Reich, N. G. Evaluating epidemic forecasts in an interval format. PLoS Comput. Biol. 17, e1008618 (2021).
Pollett, S. et al. Recommended reporting items for epidemic forecasting and prediction research: The epiforge 2020 guidelines. PLoS Med. 18, e1003793 (2021).
Pormohammad, A. et al. Comparison of influenza type a and b with Covid-19: A global systematic review and meta-analysis on clinical, laboratory and radiographic findings. Rev. Med. Virol. 31, e2179 (2021).
Yang, S. et al. Using electronic health records and internet search information for accurate influenza forecasting. BMC Infect. Dis. 17, 1–9 (2017).
Santillana, M., Nguyen, A., Dredze, M., Paul, M. & Brownstein, J. Combining search, social media, and traditional data sources to improve influenza surveillance. PLoS Comput. Biol. 11, 08 (2015).
CNN. Rise in at-home testing means we could be undercounting covid-19 cases even more than before. (2022). Accessed: 2022-08-31. https://www.cnn.com/2022/04/18/health/covid-at-home-testing-data/index.html
Latour, C., Peracchi, F. & Spagnolo, G. Assessing alternative indicators for covid-19 policy evaluation, with a counterfactual for Sweden. PloS One 17, e0264769 (2022).
Chretien, J.-P., George, D., Shaman, J., Chitale, R. A. & McKenzie, F. E. Influenza forecasting in human populations: a sco** review. PloS One 9, e94130 (2014).
US Department of Health, Human Services, et al. Covid-19 guidance for hospital reporting and faqs for hospitals, hospital laboratory, and acute care facility data reporting. updated July, 29, (2020).
Ma S. Joint replication data for: Joint covid-19 and influenza-like illness forecasts in the united states using internet search information, (2022). https://doi.org/10.7910/DVN/PGNBAX, Harvard Dataverse, V2.
Ma S. Replication Code for: Joint COVID-19 and Influenza-like Illness Forecasts in the United States using Internet Search Information(Version 1.0.0) [Computer software], (2022). https://doi.org/10.5281/zenodo.7690172.
Acknowledgements
S.Y. is supported by the National Center for Advancing Translational Sciences of the National Institutes of Health under Award number UL1TR002378. The content is solely the responsibility of the authors and does not necessarily represent the official views of the National Institutes of Health.
Author information
Authors and Affiliations
Contributions
S.M., S.N. and S.Y. designed the research; S.M., S.N. and S.Y. performed the research; S.M. analyzed data; S.M., S.N. and S.Y. wrote the paper.
Corresponding author
Ethics declarations
Competing interests
The authors declare no competing interests.
Peer review
Peer review information
Communications Medicine thanks the anonymous reviewers for their contribution to the peer review of this work.
Additional information
Publisher’s note Springer Nature remains neutral with regard to jurisdictional claims in published maps and institutional affiliations.
Rights and permissions
Open Access This article is licensed under a Creative Commons Attribution 4.0 International License, which permits use, sharing, adaptation, distribution and reproduction in any medium or format, as long as you give appropriate credit to the original author(s) and the source, provide a link to the Creative Commons license, and indicate if changes were made. The images or other third party material in this article are included in the article’s Creative Commons license, unless indicated otherwise in a credit line to the material. If material is not included in the article’s Creative Commons license and your intended use is not permitted by statutory regulation or exceeds the permitted use, you will need to obtain permission directly from the copyright holder. To view a copy of this license, visit http://creativecommons.org/licenses/by/4.0/.
About this article

Cite this article
Ma, S., Ning, S. & Yang, S. Joint COVID-19 and influenza-like illness forecasts in the United States using internet search information. Commun Med 3, 39 (2023). https://doi.org/10.1038/s43856-023-00272-2
Received:
Accepted:
Published:
DOI: https://doi.org/10.1038/s43856-023-00272-2
- Springer Nature Limited