
Abstract
We provide the first whole genome sequences from three specimens of the mountain hare subspecies the heath hare (Lepus timidus sylvaticus), along with samples from two mountain hares (Lepus timidus timidus) and two brown hares (Lepus europaeus) from Sweden. The heath hare has a unique grey winter pelage as compared to other mountain hares (white) and brown hares (mostly brown), and face regional extinction, likely due to competitive exclusion from the non-native brown hare. Whole genome resequencing from the seven hare specimens were mapped to the Lepus timidus pseudoreference genome and used for detection of 11,363,883 polymorphic nucleotide positions. The data presented here could be useful for addressing local adaptations and conservation status of mountain hares and brown hares in Sweden, including unique subspecies.
Measurement(s) | whole genome sequencing |
Technology Type(s) | Illumina HiSeq X |
Factor Type(s) | Species |
Sample Characteristic - Organism | Lepus timidus • Lepus europaeus • Lepus timidus sylvaticus |
Sample Characteristic - Location | Sweden |
Background & Summary
Two morphologically distinct mountain hare subspecies are present in Sweden, the nominal subspecies (Lepus timidus timidus Linnaeus, 1758), with extensive arctic/subarctic Eurasian distribution, and the endemic heath hare (Lepus timidus sylvaticus Nilsson, 1831)1, a more temperate adapted subspecies that occur in southern Scandinavia and, presumably, west Estonia2. The most conspicuous difference is the colour of their winter pelage, which is white in the nominal mountain hare subspecies and grey in the heath hare.
The geographic distribution of the nominal subspecies has gradually receded northwards in Sweden. One possible reason for this is competition from the introduced brown hare (Lepus europaeus Pallas, 1778) in the mid-19th century3, but the retreat may also be driven by climate change induced camouflage mismatch or other habitat changes4,5,6. While the heath hare is better camouflaged in areas void of snow, it too might face local extinction due to habitat alteration and competition from brown hare, as indicated from a persistent decline in hunting harvest data7.
Earlier research has also shown interspecific gene flow (i.e., introgression) between the two species, Lepus timidus and Lepus europaeus8. Introgression may facilitate adaptation of the non-native brown hare to boreal prerequisites (e.g. seasonal shift to white winter pelage3,7, cold climate and/or pathogen resistance9). This two-species complex thus offers an excellent model system for exploring how rapid, human-induced ecological change affects species including, their behavioural, demographic and evolutionary interactions over time. In addition to the conservation challenges mentioned, both mountain hares and heath hares are culturally important game species in Sweden and declining populations cause concern.
The genomic data reported here can be used for addressing complex adaptive patterns, assess species interactions and as a resource for develo** monitoring tools for threatened populations. They also provide valuable insight into the subspecies differences and evolutionary histories. We have described 11,363,883 polymorphisms in whole genome resequencing data in order to detect differentiating markers and provide an example analysis screening of pigmentation genes that may influence winter pelage colour10. In addition to assessment of local adaptations of the two hare species, conservation status of the heath hare and develo** management tools, the genomic data reported may also be used for added value to the understanding of the nature of interactions between mountain hares and brown hare in other contacts zones throughout their distribution3,7,11,12,13. In combination with harvest data, pellet inventories and camera trap**, these genetic data with potential additions could be used to develop integrative monitoring tools for mountain hares and brown hares.
Methods
Sample collection and DNA extraction
Muscle tissue samples were obtained from seven hares shot from 2005–2017 during the regular hunting season in Sweden. The regular hunting season stretches from September 1 to February 15 for mountain hares in southern Sweden and to the last day of February in northern Sweden. The regular hunting season for brown hares is from September 1 to the last day of February across all of Sweden. The samples are representing two hare species and one hare sub-species (Table 1) in Sweden (Fig. 1A): two individuals of Lepus europaeus, two Lepus timidus timidus and three of Lepus timidus sylvaticus. All three L. t. sylvaticus (Le911, Le918 and Le919) samples were collected during January and February, when blue/light grey winter pelage confirm subspecies status (Table 1; Angerbjörn & Flux 1995). In addition, samples from one L. t. timidus (Le921) in sympatry with L. europaeus was collected in January, when the white winter pelage of this subspecies enable easy species determination. Samples from the final three specimens, one L. t. timidus (Le922) and two L. europaeus (LeA01 and LeV01), were collected in areas where the respective species occur in allopatry (details available in Table 1). Template DNA was extracted using the QIAsymphony DNA Mini Kit following the manufacturer’s instructions.
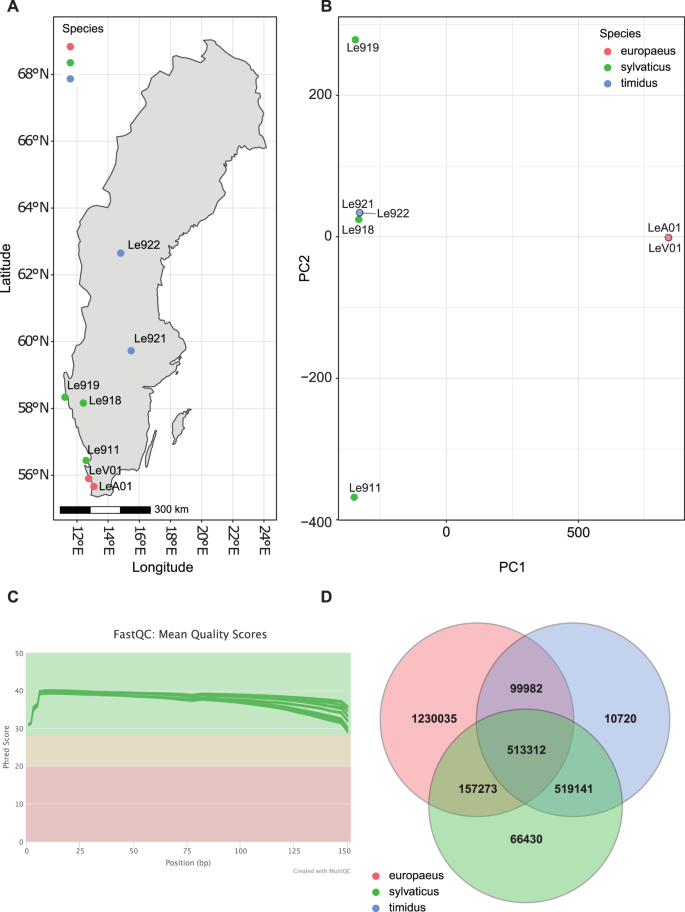
(A) Map of sample locations for brown hares (L. europaeus; red), heath hares (L. timidus sylvaticus; green) and mountain hares (L. t. timidus; blue). (B) Principal Component Analysis of variants. Overlap** points are outlined in black. (C) Phred quality scores across all base for each individual sequencing library. Note, a phred score of Q30 is equivalent to 1 incorrect base in 1000 or 99.9% accuracy in the base call. (D) Venn diagram of shared and unique variants by species.
Library preparation and sequencing
The seven samples were sequenced over four lanes on a single flowcell on the Illumina HiSeqX. A single Illumina TruSeq PCR free library (Illumina, USA) was prepared for each hare sample at the SciLifeLab in Stockholm, Sweden (National Genomics Infrastructure Stockholm, Sweden). The target insert size of the libraries was 350 bp. The samples were then pooled in equimolar ratios and sequenced over 4 lanes on the Illumina HiSeqX platform using the 2 × 151 Hiseq X SBS chemistry. The Bcl to FastQ conversion was performed using bcl2fastq_v2.19.1.403 of the Illumina software package CASAVA.
Bioinformatics
Quality of the raw sequencing reads14 was assessed using FastQC version 0.11.915 (Fig. 1C). Adapter sequences were then removed from the raw sequencing reads using cutadapt version 2.1016 followed by further read quality checks. The trimmed reads were then mapped to the psedudoreference Lepus timidus genome17 (NCBI accession: GCA_009760805.1) with the Burrows Wheeler Aligner, BWA version 0.7.1718 using default the settings for the bwa mem algorithm. Each individual was sequenced over different lanes of sequencing, therefore all files for each individual were used as input during the Picard version 2.21.4 markduplicates19 step resulting in a single bam file per individual with PCR and optical duplicates removed. Variants were called across the genome in 100,000 bp regions using freebayes version 1.3.133 to the estimated divergence time of Lepus europaeus and Lepus timidus.
Validation
Technical validation of the sequencing quality was performed using FastQC, followed by compilation of the data with MultiQC34. To validate the origin of the datasets we used two methods, firstly the confirmation of the winter phenotype and second confirmation of the phylogenetic relationship and their ancestry coefficients. The phylogenetic relationship was assessed based on the mitochondrial genome as described above including other hare species and then using the genome wide variants from the closed analysis. The ancestry coefficients were determined using Poppr version 2.9.335 based on the DAPC method.
Usage example
To further illustrate a potential use of the dataset, we performed an example analysis of SNPs in 59 known pigmentation genes10, which could be used to understand the genetics of pelage color (Fig. 3). First, rabbit or mouse reference sequences were downloaded for each gene contained in Table 2 of Hoekstra, (2006) from the NCBI database. These genes were then mapped onto the psedudoreference Lepus timidus genome using the minimap236 splice aware transcript algorithm. We then counted the number of SNPs overlap** the pelage color gene regions identified based on the map** with BEDtools37 and present this data(Fig. 3).
Data Records
Sequencing data
The sequencing was successful and resulted in a total of 3.24 billion reads. The sequencing read quality was high with an average phred value greater than Q30 (Fig. 1C). The average map** rate of the reads to the pseudoreference Lepus timidus genome is 93.59% with an average of 79.9% of reads map** as proper pairs (Table 3). The raw sequencing data14 can be accessed from the NCBI short read archive under project accession and individual accession numbers can be found in Table 1.
Variant calling and filtering
Variant calling was performed using a parallel version of the freebayes software on the CSC Puhti server (Table 2) (CSC – IT Center for Science, Finland). Freebayes is a haplotype-aware variant caller and identified a total of 78,968,182 variants across the genome. After the application of various filters (Table 2) we recovered 11,363,883 high quality variants (Table 4) spread across the entire pseudoreference genome.
Mitochondrial genome assemblies
We assembled near complete mitochondrial genome sequences for each individual. The mitochondrial genome assemblies range from 16,648 bp to 17,612 bps in length, with four individuals producing circular contigs (LeA01, LE911, LE919 and LE921). All mitochondrial genes are present for each individual. The alignment of the mitochondrial genomes produced in this study are included as part of the Dryad dataset in the phylip format23.
Technical Validation
The PCA analysis (Fig. 1B) and complot (Fig. 2C) of the filtered SNP dataset further confirms the different species grou**s. A similar grou** pattern has been observed in Lepus species sampled throughout Finland38, where the genetic diversity of the L. europaeus is small, likely due to a founder effect resulting in tight clustering of these samples, with more broad clustering of the L. timidus samples (Fig. 1B). Interspecific introgression may also influence the observed patterns38. Of the 11,363,883 high quality variants, 1,230,035 were unique to the L. europaeus and 596,291 to L. timidus (Fig. 1C).
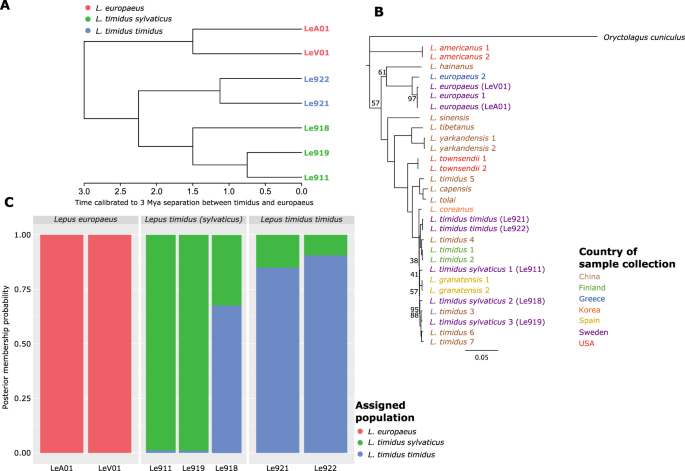
(A) Ultrametricised phylogenetic tree based on the genome wide single nucleotide variants of the samples. Node support <100 is reported. The phylogeny is calibrated to an estimated three million year separation between L. europaeus and L. timidus41. (B) Maximum likelihood tree of whole mitochondrial genomes of several Lepus species. The tree is rooted on Oryctolagus cuniculus. Tip labels are coloured based on the country of sample collection. Node support <100 is reported. (C) Complot analysis of the hare populations, showing the posterior membership probability of each hare sample. Note the differentiation between the two mountain hare subspecies.
To confirm the relationship of the hare samples, we generated a maximum likelihood (ML) phylogenetic tree based on the whole genome SNPs (Fig. 2A). The phylogenetic clustering of these samples confirms the origin of the samples, as the first branch separates the Lepus europaeus and Lepus timidus, followed by the separation of the L. timidus and the subspecies L. timidus sylvaticus. The sub-species creates a further split between the sample from the mainland and the two collected on the islands in the southwest of Sweden. Similarly, the phylogeny based on the mitochondrial genomes (Fig. 2B), first shows a split between the L. europaeus and L. timidus samples. Then the L. timidus timidus and L. timidus sylvaticus samples were further split. Interestingly, with the inclusion of other L. timidus genomes from the far East, the L. timidus sylvaticus clustered with these samples. The observed differences between whole genome and mitochondrial genome data may be influenced by introgressive patterns as well as different means of inheritance.
Usage Notes
The genomic data described could be used to assess adaptations of hares in, for example, pigmentation, cold durability and pathogen resistance in local, regional or a wide range of distributions. A particular value is to develop an integrated monitoring tool for assessing the conservation status of the heath hare in southern and central Sweden. This could be done by integrating genetic data, harvest data, pellet inventories and camera trap**. In addition to general conservation, the long-term preservation of the heath hare, as well as understanding of the nature of interactions between mountain hares and brown hares, is important from a resource perspective as hares are a game species in Sweden and elsewhere and, as such, a source of meat and recreation.
Despite the small sample set, the data indicates a notable number of private alleles in the two mountain hare subspecies (Fig. 1D). The resulting divergence between the two clades (Fig. 2A,B) is clearly visible in the phylogenies and in ancestry complot analysis (Fig. 2C), which support that the subspecies represent biological entities beyond a single gene winter pelage colour difference39. Furthermore, these private alleles could be used to examine the diversification of hares and their subspecies through the use of SNP panels. The subspecies split in Fig. 2A may have persisted in sympatry since the end of the last glacial maximum40, although the timing needs further validation40. The mechanisms maintaining the genetic division warrant further studies and raise an interesting question about the bona fide subspecies status of the heath hare.
To illustrate an example of how this genomic data could be integrated with future analyses we counted the number of variants found in known pigmentation genes. Although, the sample size for this analysis is too small in itself to provide any conclusions, we were able to identify a number of variants within and around genes (Fig. 3) with known effects on pigmentation10,39. If integrated with a larger dataset, we trust that the genomic data provided here will provide a valuable resource for population genetics, conservation biology and evolutionary studies on hares.
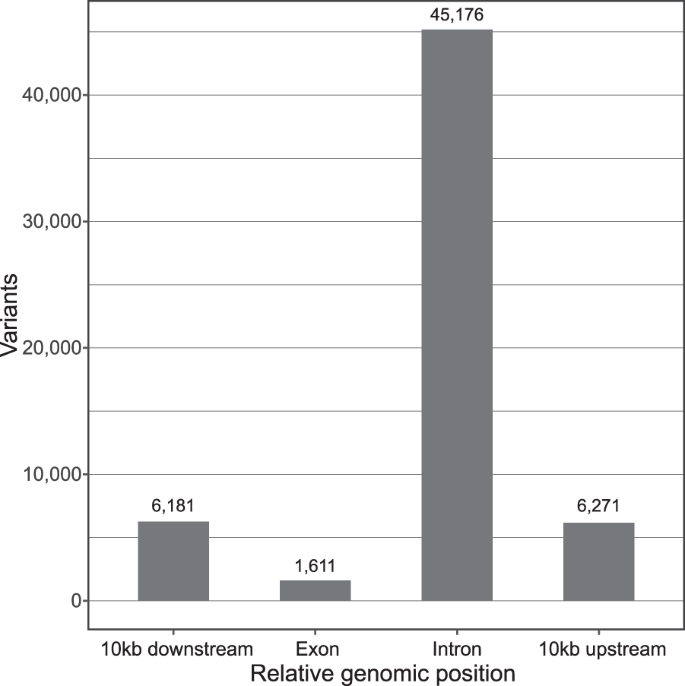
The number of Single Nucleotide Variants in and around known genes responsible for coat colour in mice.
Code availability
All programs and commands used to present this data are contained in Table 2.
References
Angerbjörn, A. & Flux, J. E. C. Lepus timidus. Mamm. Species 1–11, https://doi.org/10.2307/3504302 (1995).
Bergengren, A. On genetics, evolution and history of distribution of the heath-hare, a distinct population of the Arctic hare, Lepus timidus Lin. Swed. Wildl. (Viltrevy) 6, 381–460 (1969).
Thulin, C.-G. The distribution of mountain hares Lepus timidus in Europe: a challenge from brown hares L. europaeus? Mamm. Rev. 33, 29–42 (2003).
Mills, L. S. et al. Camouflage mismatch in seasonal coat color due to decreased snow duration. Proc. Nat.Acad. Sci. 110, 7360–7365 (2013).
Zimova, M. et al. Lack of phenological shift leads to increased camouflage mismatch in mountain hares. Proc.Royal Soc. B: Biol. Sci. 287, 20201786 (2020).
Levänen, R., Kunnasranta, M. & Pohjoismäki, J. Mitochondrial DNA introgression at the northern edge of the brown hare (Lepus europaeus) range. Ann Zool Fennici 55, 15–24 (2018).
Thulin, C.-G., Winiger, A., Tallian, A. G. & Kindberg, J. Hunting harvest data in Sweden indicate precipitous decline in the native mountain hare subspecies Lepus timidus sylvaticus (heath hare). J. Nat. Conserv. 64, 126069 (2021).
Thulin, C.-G., Jaarola, M. & Tegelström, H. The occurrence of mountain hare mitochondrial DNA in wild brown hares. Mol. Ecol. 6, 463–467 (1997).
Pohjoismäki, J. L. O., Michell, C., Levänen, R. & Smith, S. Hybridization with mountain hares increases the functional allelic repertoire in brown hares. Sci. Rep. 11, 15771 (2021).
Hoekstra, H. E. Genetics, development and evolution of adaptive pigmentation in vertebrates. Heredity (Edinb) 97, 222–234 (2006).
Hamill, R. M., Doyle, D. & Duke, E. J. Spatial patterns of genetic diversity across European subspecies of the mountain hare, Lepus timidus L. Heredity (Edinb) 97, 355–365 (2006).
Leach, K., Montgomery, W. I. & Reid, N. Biogeography, macroecology and species’ traits mediate competitive interactions in the order Lagomorpha. Mamm. Rev. 45, 88–102 (2015).
Marques, J. P. et al. Data Descriptor: Mountain hare transcriptome and diagnostic markers as resources to monitor hybridization with European hares. Sci. Data 4, 1–11 (2017).
NCBI Sequence Read Archive https://identifiers.org/insdc.sra:SRP358660 (2022).
Andrews, S. FastQC: a quality control tool for high throughput sequence data. Babraham Bioinformatics. Preprint at http://www.bioinformatics.babraham.ac.uk/projects/fastqc (2010).
Martin, M. Cutadapt removes adapter sequences from high-throughput sequencing reads. EMBnet.journal 17, 10–12 (2011).
Marques, J. P. et al. An annotated draft genome of the mountain hare (Lepus timidus). Genome Biol. Evol. 12, 3656–3662 (2020).
Li, H. & Durbin, R. Fast and accurate short read alignment with Burrows-Wheeler transform. Bioinformatics 25, 1754–1760 (2009).
Broad Institute. Picard toolkit. Broad Institute, GitHub repository. Preprint at https://broadinstitute.github.io/picard/ (2019).
Garrison, E. & Marth, G. Haplotype-based variant detection from short-read sequencing. ar**v 1207.3907 (2012).
Danecek, P. et al. The variant call format and VCFtools. Bioinformatics 27, 2156–2158 (2011).
Browning, S. R. & Browning, B. L. Rapid and accurate haplotype phasing and missing-data inference for whole-genome association studies by use of localized haplotype clustering. Am. J. Hum. Genet. 81, 1084–1097 (2007).
Michell, C. T., Pohjoismäki, J. L. O., Spong, G. & Thulin, C.-G. Mountain- and brown hare genetic polymorphisms to survey local adaptations and conservation status of the heath hare (Lepus timidus sylvaticus, Nilsson 1831), Dryad, https://doi.org/10.5061/dryad.3bk3j9kmp (2022).
Khan, A. & Mathelier, A. Intervene: a tool for intersection and visualization of multiple gene or genomic region sets. BMC Bioinformatics 18, 287 (2017).
R Core Team. R: A language and environment for statistical computing. R Foundation for Statistical Computing, Vienna, Austria. http://www.R-project.org/.
Jombart, T. & Ahmed, I. adegenet 1.3-1: new tools for the analysis of genome-wide SNP data. Bioinformatics 27, 3070–3071 (2011).
Jombart, T. adegenet: a R package for the multivariate analysis of genetic markers. Bioinformatics 24, 1403–1405 (2008).
Dierckxsens, N., Mardulyn, P. & Smits, G. NOVOPlasty: De novo assembly of organelle genomes from whole genome data. Nucleic Acids Res. 45 (2017).
Katoh, K. & Standley, D. M. MAFFT multiple sequence alignment software version 7: Improvements in performance and usability. Mol. Biol. Evol. 30 (2013).
Trifinopoulos, J., Nguyen, L. T., von Haeseler, A. & Minh, B. Q. W-IQ-TREE: a fast online phylogenetic tool for maximum likelihood analysis. Nucleic Acids Res. 44 (2016).
Kalyaanamoorthy, S., Minh, B. Q., Wong, T. K. F., von Haeseler, A. & Jermiin, L. S. ModelFinder: fast model selection for accurate phylogenetic estimates. Nat. Methods 14, 587–589 (2017).
Stamatakis, A. RaxML version 8: a tool for phylogenetic analysis and post-analysis of large phylogenies. Bioinformatics 30, 1312–1313 (2014).
Paradis, E. & Schliep, K. ape 5.0: an environment for modern phylogenetics and evolutionary analyses in R. Bioinformatics 35, 526–528 (2019).
Ewels, P., Magnusson, M., Lundin, S. & Käller, M. MultiQC: summarize analysis results for multiple tools and samples in a single report. Bioinformatics 32, 3047–3048 (2016).
Kamvar, Z. N., Tabima, J. F. & Grünwald, N. J. Poppr: an R package for genetic analysis of populations with clonal, partially clonal, and/or sexual reproduction. PeerJ 2, e281 (2014).
Li, H. Minimap2: Pairwise alignment for nucleotide sequences. Bioinformatics 34, 3094–3100 (2018).
Quinlan, A. R. & Hall, I. M. BEDTools: a flexible suite of utilities for comparing genomic features. Bioinformatics 26, 841–842 (2010).
Levänen, R., Thulin, C.-G., Spong, G. & Pohjoismäki, J. L. O. Widespread introgression of mountain hare genes into Fennoscandian brown hare populations. PloS One 13, e0191790 (2018).
Giska, I. et al. The evolutionary pathways for local adaptation in mountain hares. Mol. Ecol. 31, 1487–1503 (2022).
Thulin, C.-G., Isaksson, M. & Tegelström, H. The origin of Scandinavian mountain hares (Lepus timidus). Gibier Faune Savage/Game and Wildlife 14, 463–475 (1997).
Ferreira, M. S. et al. The legacy of recurrent introgression during the radiation of hares. Syst. Biol. 70, 593–607 (2021).
Acknowledgements
C.-G.T. acknowledge financial support from the Swedish Environmental Protection Agency (project numbers 802-0216-15 and NV-05813-21), and assistance with collection samples from harvested hares from Bo Gunnarsson, Anders Friberg, Martin Hahne and Jonas Malmsten.
Author information
Authors and Affiliations
Contributions
Craig T. Michell: Bioinformatic methodology, investigation, formal analysis, visualization and writing (original draft, review and editing). Jaakko L. O. Pohjoismäki: Design of bioinformatics pipeline, investigation, supervision and writing (review and editing). Göran Spong: Conceptualization, methodology, investigation and writing (review and editing). Carl-Gustaf Thulin: Conceptualization, experimental design and writing (original draft, review and editing).
Corresponding authors
Ethics declarations
Competing interests
The authors declare no competing interests.
Additional information
Publisher’s note Springer Nature remains neutral with regard to jurisdictional claims in published maps and institutional affiliations.
Rights and permissions
Open Access This article is licensed under a Creative Commons Attribution 4.0 International License, which permits use, sharing, adaptation, distribution and reproduction in any medium or format, as long as you give appropriate credit to the original author(s) and the source, provide a link to the Creative Commons license, and indicate if changes were made. The images or other third party material in this article are included in the article’s Creative Commons license, unless indicated otherwise in a credit line to the material. If material is not included in the article’s Creative Commons license and your intended use is not permitted by statutory regulation or exceeds the permitted use, you will need to obtain permission directly from the copyright holder. To view a copy of this license, visit http://creativecommons.org/licenses/by/4.0/.
About this article

Cite this article
Michell, C.T., Pohjoismäki, J.L.O., Spong, G. et al. Mountain- and brown hare genetic polymorphisms to survey local adaptations and conservation status of the heath hare (Lepus timidus sylvaticus, Nilsson 1831). Sci Data 9, 667 (2022). https://doi.org/10.1038/s41597-022-01794-5
Received:
Accepted:
Published:
DOI: https://doi.org/10.1038/s41597-022-01794-5
- Springer Nature Limited