

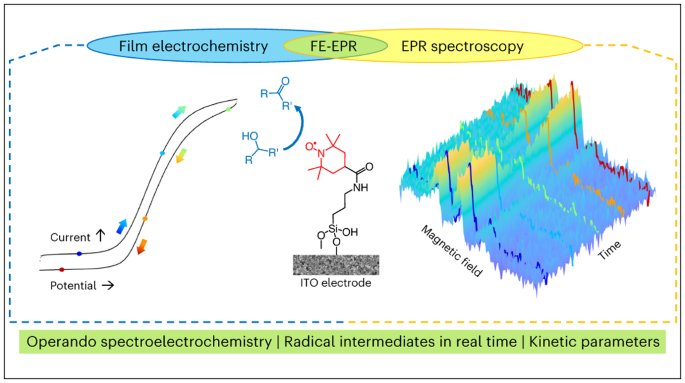
Abstract
The development of surface-immobilized molecular redox catalysts is an emerging research field with promising applications in sustainable chemistry. In electrocatalysis, paramagnetic species are often key intermediates in the mechanistic cycle but are inherently difficult to detect and follow by conventional in situ techniques. We report a new method, operando film-electrochemical electron paramagnetic resonance spectroscopy (FE-EPR), which enables mechanistic studies of surface-immobilized electrocatalysts. This technique enables radicals formed during redox reactions to be followed in real time under flow conditions, at room temperature and in aqueous solution. Detailed insight into surface-immobilized catalysts, as exemplified here through alcohol oxidation catalysis by a surface-immobilized nitroxide, is possible by detecting active-site paramagnetic species sensitively and quantitatively operando, thereby enabling resolution of the reaction kinetics. Our finding that the surface electron-transfer rate, which is of the same order of magnitude as the rate of catalysis (accessible from operando FE-EPR), limits catalytic efficiency has implications for the future design of better surface-immobilized catalysts.
Main
Electron paramagnetic resonance (EPR) spectroscopy is used to investigate both homogeneous and heterogeneous catalysis1,2,3 and helps to guide the development of new catalysts. Although homogeneous catalysts are commonly employed in organic synthesis laboratories due to their high activity, heterogeneous catalysts are attractive as they are more easily recyclable and economic, and dominate in 80% of industrial processes4,5. The need for sustainable, efficient and selective chemical processes is driving the ‘heterogenization’ of homogeneous redox catalysts (Fig. 1), combining the advantages of both catalyst types to develop electrocatalysts for a future net-zero chemical industry4,5,6,7. Electrocatalysis has applications in fuel cells, hydrogenation, CO2 reduction3a and Supplementary Video 1 present an example CV scan measured at 5 mV s−1, with a selected set of corresponding EPR spectra shown in Fig. 3b (the complete set is shown in Extended Data Fig. 3). Double integration of the STEMPO radical EPR spectra from the forward and reverse scans, plotted as a function of potential (Fig. 3c), allow deduction of the reduction potential of the reversible STEMPO•/STEMPO+ redox couple (E(non-catalytic, FE-EPR) = +830 mV) by fitting the data to the Nernst equation with the number of electrons transferred (n) equal to 1. The surface electron-transfer rate constant (ks) was determined from Laviron analysis (ks = 0.77 s−1; Supplementary Fig. 4) and agrees with previous work27. The potential derived from EPR measurements was in close agreement with that obtained from the CV scan (Fig. 3 and Supplementary Table 1), demonstrating the excellent performance of the FE-EPR in situ set-up. Multiphysics simulations (COMSOL Multiphysics; Supplementary Section 9) of the FE-EPR data in Fig. 3 enabled us to build a more complete model of electron transfer based on asymmetric Marcus–Hush–Chidsey theory, incorporating intermolecular interactions47,48 (Extended Data Fig. 4), which is fully consistent with the experimental data obtained from FE-EPR experiments across the entire range of scan rates used.

a, CV scan recorded at 5 mV s−1, simultaneously with EPR measurements, in the FE-EPR cell placed inside the EPR cavity. The scan direction is indicated with arrows. Peak separation, 19 mV, E(non-catalytic, CV) = +830 mV. b, EPR spectra at the potentials highlighted on the CV scan in a during the forward (blue) and reverse (red) CV scans (Extended Data Fig. 3 presents a complete set of EPR spectra). c, Double integrals of the EPR spectra (normalised to the maximum data point) plotted against potential and fitted with a 1e− Nernst equation during forward (blue, Eforward(non-catalytic, FE-EPR) = +831 mV) and reverse (red, Ereverse(non-catalytic, FE-EPR) = +830 mV) CV scans. Grey open circles are from all EPR spectra collected (Extended Data Fig. 3), and coloured circles correspond to the EPR data shown in b.
FE-EPR of STEMPO under catalysis
Having successfully established in situ FE-EPR under non-catalytic conditions, we proceeded to investigate STEMPO as an ideal model catalyst, given that nitroxide-catalysed alcohol oxidation has been investigated in detail in solution34 (Extended Data Fig. 5 and Supplementary Section 4) and less extensively in the surface-immobilized form27,35,49,50,51. The surface-immobilized reaction with the substrate 4-methylbenzyl alcohol (MBA) proceeds via a catalytic electrochemical–chemical mechanism (EC′) (based on a catalytic CV scan, Fig. 4a), consistent with previous studies carried out both in solution and when surface-immobilized34,52,53,54. Interestingly, it has been shown using in situ Raman and vibrational spectroscopy that the mechanism of a Co catalyst is different on a surface25 than in solution55, highlighting that not all aspects of solution-based alcohol oxidation by nitroxides will necessarily translate to the surface-immobilized case.

a, CV scan from the FE-EPR cell placed inside the EPR cavity, recorded at 5 mV s−1 with 20 mM MBA in 8 ml of buffer solution, pH 8.0, in air and under flow conditions. b, EPR spectra at the potentials highlighted on the CV scan in a during forward (green) and reverse (yellow) CV scans (Extended Data Fig. 6 provides a complete set of EPR spectra). c, Double integrals of the EPR spectra (normalised to the maximum data point) plotted against potential and fitted with the Nernst equation (apparent number of electrons transferred, napp = 0.3) during the forward (green, Eforward (catalytic, FE-EPR) = +859 mV) and reverse (yellow, Ereverse(catalytic, FE-EPR) = +902 mV) CV scans. Grey open circles are from all EPR spectra collected (Extended Data Fig. 6), and the coloured circles correspond to the EPR data shown in b. d, Catalytic CV scans from operando FECV-EPR experiments with different concentrations of MBA. e, Double integrals of the EPR spectra from c, plotted against potential and fitted with the Nernst equation during the forward CV scan (Supplementary Section 5).
The simultaneously recorded EPR spectra (Fig. 4b; Extended Data Fig. 6 provides a complete set) show the gradual disappearance of STEMPO• as it is transformed to STEMPO+ in the forward scan, then its reappearance in the reverse scan. The flow conditions (Fig. 2a) ensure that mass transport of the MBA is sufficiently high not to be rate-limiting, with minimal substrate depletion at the electrode surface (Supplementary Fig. 26). The same EPR spectrum was regenerated in the reverse scan, suggesting chemical reversibility by reforming a radical species, after catalysis, that is structurally the same as the one present before catalysis, and providing evidence that STEMPO• is a catalytic intermediate. In solution-based studies, TEMPO• has not been detected directly during catalysis due to a lack of suitable techniques, although a radical has been inferred56; this showcases the sensitivity and time resolution possible with FE-EPR. Although FE-EPR is blind to diamagnetic intermediates, in this case STEMPOH and STEMPO+, it has the advantage of being able to selectively detect very low concentrations of key paramagnetic surface-immobilized active-site species (TEMPO•) that are very difficult to access with other SEC methods. In surface-immobilized electrocatalysis, this selectivity is particularly advantageous, given the size and complexity of the system.
Fitting of the double-integral EPR data in Fig. 4c with the Nernst equation provides directly observable metrics from FE-EPR to describe the catalytic system. Under catalysis, the apparent n (napp) decreases successively with increased substrate concentration (napp = 0.3 for 20 mM MBA; Supplementary Table 2) in both the forward and reverse scans. Concomitantly, the catalytic potential (Ecat) becomes more positive with increasing substrate concentration (Fig. 4e and Supplementary Table 2). Similar trends were observed under anaerobic conditions and with the secondary alcohol glycerol as substrate (Supplementary Section 5). Ecatalytic from FE-EPR (Ecatalytic, FE-EPR) and the electrochemistry alone (Ecatalytic, CV) are in near-perfect agreement (Supplementary Table 2) in this case, where ideal sigmoidal catalytic CV scans57 are observed. However, it is noteworthy that FE-EPR provides this useful parameter even when electrochemical data alone cannot.
A set of rate equations was assembled for the possible processes that are taking place (equations (1) to (6)). These form the basis of kinetic investigations where the rates of some components of this scheme can be directly accessed by FE-EPR and used in combination with Multiphysics simulations for mechanistic determinations (see Methods and Supplementary Information section 9):
The observed trend in napp and Ecatalytic can be explained as arising from relatively slow electron transfer, occurring at a comparable rate to catalysis (Extended Data Fig. 7 and Supplementary Section 9). When the rate constant for chemical catalysis (kcat) was fixed and ks was decreased, napp from the modelled STEMPO• concentrations decreased. At high ks (greater than the critical scan rate and higher than kcat), varying ks had little effect on the wave shape. This behaviour is indicative of the interplay between ks and kcat in the STEMPO system, which must be of similar magnitudes (Extended Data Fig. 7), unlike in diffusion-controlled systems due to the surface-immobilized nature of the electron transfer. Although, in contrast to their homogeneous counterparts, immobilization removes diffusional components, a high ks is essential for the performance of surface-immobilized catalysts and necessitates kinetic and mechanistic consideration. Thus, to deconvolute ks and kcat, a direct experimental measurement of kcat is required, highlighting the need to observe surface-immobilized catalysts directly.
Operando FE-EPR provides kinetic resolution
With chronoamperometry-based FE-EPR (FEamp-EPR), kcat can be determined directly from operando measurements (Fig. 5), avoiding the assumptions of foot-of-the-wave analysis (Supplementary Section 10). The STEMPO• EPR signal is monitored at open-circuit potential (OCP) following a high-potential step to generate STEMPO+ exclusively. Online product detection showed that MBA was selectively oxidized to 4-methylbenzaldehyde (Faradaic efficiency of 96%, from HPLC; Supplementary Section 8). In the absence of substrate, the STEMPO• signal intensity returned to its initial levels, with a radical regeneration rate of 7.3 µM s−1 (Fig. 5a). Regeneration of STEMPO• was also observed under anaerobic conditions at the same rate at pH 8.0 and 7.3. STEMPO• regeneration was faster in the presence of MBA and increased with substrate concentration, including under anaerobic conditions. A similar trend was observed with glycerol (Extended Data Fig. 8 and Supplementary Section 6).

The potential was held at +0.6 V such that only the EPR-active species (STEMPO•) was present, and then stepped to +1.1 V such that EPR-silent (STEMPO+) was generated exclusively. The current was monitored at OCP over time and the experiment was performed with and without substrate. EPR spectra were recorded throughout the chronoamperometry-OCP measurement. a, Double integrals of EPR spectra showing regeneration of STEMPO• in the absence of substrate (black dots) and in the presence of 1 mM (red dots) and 5 mM (blue dots) MBA after potential steps at +0.6 V and +1.1 V versus SHE, for 100 s each. b, STEMPO• regeneration rates as a function of substrate concentration (14, 92, 137 and 162 µM s−1 for 1, 5, 10 and 20 mM MBA, respectively; the colours of the data points match the data in a and in Supplementary Figure 14), deduced from a first-order relaxation fit of the variation of STEMPO• concentration over time, as quantified from the EPR data. The solid line shows a fit using the Michaelis–Menten model with Michaelis–Menten constant KM = 6.8 ± 1.3 and rate constant for chemical catalysis kcat = 0.22 s−1 (see main text). Extended Data Fig. 8 provides results with glycerol as the substrate at pH 8.0 and Extended Data Fig. 9 the corresponding data for MBA at pH 7.3 (also Supplementary Section 6).
Regeneration of the nitroxide at OCP under catalytic conditions provides direct evidence for the formation of STEMPO• as an active-site species during catalysis. The rate of STEMPO• regeneration as a function of MBA or glycerol concentration fits the Michaelis–Menten model (Fig. 5b and Extended Data Fig. 8b). The Michaelis–Menten model, which is a specific case of the more general substrate saturation model (Supplementary Section 7), is based on the formation of an enzyme–substrate (catalyst–substrate) complex58, with binding affinity equal to the inverse of the Michaelis–Menten constant, KM. The Michaelis–Menten model, which is extensively used to characterize enzyme–substrate interactions, has rarely been applied to molecular catalysts59,60,61, but parallels can also be drawn with the Langmuir–Hinshelwood mechanism describing the surface saturation of heterogeneous catalysis62. Quantification of the catalyst–substrate association kinetics is then straightforward. The KM values determined from FE-EPR for STEMPO+–MBA and STEMPO+–glycerol associations are 6.8 ± 1.3 and 1.8 ± 0.9 mM, respectively. The higher binding affinity for glycerol is expected given its three -OH groups (compared to one in MBA). The catalytic rates, kcat, are 0.22 s−1 for MBA and 0.06 s−1 for glycerol at pH 8.0, as quantified from EPR (Supplementary Fig. 10 and Supplementary Table 3). Although oxoammonium-alcohol adduct formation has been studied extensively in solution31,34,63,64,65,66, the substrate binding affinity is rarely quantified67.
kcat is pH-dependent and can be directly observed by FE-EPR, with higher pH increasing kcat and lower pH decreasing kcat (0.09 s−1 at pH 7.3; Extended Data Fig. 9). The pH dependence, which has been extensively studied for different nitroxides in solution under non-catalytic conditions68, alludes to the formation of an oxoammonium hydroxide adduct54, as the rate equation dictates a linear increase with [OH−] (equation (4)), and a less than logarithmic dependence of the directly measured kcat on pH is observed. This indicates a pKa for the formation of the oxoammonium hydroxide adduct of 7.1 (equation (3)), substantially lower than that for solution TEMPO (pKa > 12)69. This can be due to a structural effect from the presence of the silatrane linker54 or due to the effect of surface immobilization on pKa values25,70. The formation of the oxoammonium-hydroxide adduct is consistent with the previously observed plateau in catalytic activity at pH 10 (ref. 27) and can be used to accurately describe the FE-EPR data at OCP for all substrate concentrations and pH with Multiphysics modelling (Supplementary Section 9). STEMPO• is regenerated at OCP, providing evidence of a surface comproportionation reaction (Extended Data Fig. 10 and equation (5)), which would require current to flow. This is consistent with the presence of intermolecular interactions required to describe the non-turnover case. However, comproportionation does not exclude STEMPO• regeneration by Proton coupled electron transfer (PCET), as the non-turnover signal for the STEMPOH/STEMPO• redox couple that has been observed (with ks = 5.7 s−1) is pH-dependent (E0 = 0.386 − 0.059 × pH V versus standard hydrogen electrode (SHE); Supplementary Fig. 23). It is important to emphasize that the rate-determining step is determined by kcat (equation (4)), with comproportionation or PCET steps only influencing the regeneration of STEMPO• and its concentration in the catalytic cycle.
With the availability of a measure for kcat, our electrochemical model can fully explain all trends in the extant FE-EPR data with comparable current magnitudes and wave shapes, coupled to comparable trends with substrate concentration in the EPR-observed STEMPO• concentration (Extended Data Fig. 10). The direct measure of ks, kcat, the order of reactions (as deduced from kcat at pH 8.0 versus pH 7.3) and catalytic site concentrations can be used to fix the rates of some reactions in the catalytic cycle (Supplementary Tables 3 and 6). Different mechanisms for components of the cycle that are not yet accessible directly from experiments (namely possible reactions following the rate-determining step) were then tested with our Multiphysics model. The mechanism of STEMPO• regeneration after the catalytic intermediate is debated in solution-based reactions, with both comproportionation71 and PCET constituting possible pathways34 (Extended Data Fig. 10 and Supplementary Section 9), and insight into the surface-immobilized process is lacking. However, unlike in solution-phase catalysis, there is no requirement for STEMPOH to diffuse to the electrode to enable a PCET pathway. Using the experimentally determined ks and kcat, the observed STEMPO• concentrations under catalysis are more consistent with PCET being the dominant regeneration mechanism (Extended Data Fig. 10). Although this does not preclude a comproportionation mechanism alongside PCET, the PCET pathway is substantially faster in the surface-immobilized case.
Figure 6 summarizes the key findings from operando FE-EPR, made possible by (1) detecting a key active-site species (STEMPO•) during catalysis (Figs. 4 and 5) and (2) determining the timescales on which it is regenerated (Fig. 5). The combined structural information and kinetic resolution have led to a complete electrochemical model that can be interrogated to provide mechanistic insight. Although our investigations were dedicated to a surface-immobilized catalyst, the extensive body of work on solution-based nitroxides mediating alcohol oxidation (Extended Data Fig. 5 and Supplementary Section 4) provided inspiration and guided the elucidation of the mechanism, while omitting the challenges related to surface-immobilized catalysis resolved within. Thus, although further investigations of alcohol oxidation by surface-immobilized TEMPO will provide insights into the detailed mechanism, the kinetic resolution provided by operando FE-EPR made possible by detecting active-site catalytic intermediates has revealed the need to improve ks.

The mechanism of alcohol oxidation by surface-bound oxoammonium (yellow) is an EC′ mechanism described by the Michaelis–Menten model, with kcat and KM accessible from operando FE-EPR through the quantitative detection of the key STEMPO• catalytic intermediate. ks (also obtainable from electrochemistry alone) is slow, and the exact value is dependent on the electrode and experimental conditions, leading to napp < 1 (Extended Data Fig. 7). The [Catalyst–Substrate] = [TEMPO+–RCH2OH] adduct formation is characterized by the Michaelis–Menten constant KM. Regeneration of the STEMPO• catalyst in the steps following the rate-determining step (kcat) occurs via PCET and/or comproportionation (main text and equations (1) to (6)). Rate constants and KM are given for the substrate MBA at pH 8.0 (Extended Data Figs. 8 and 9 present values for glycerol at pH 8.0 and MBA at pH 7.3, respectively).
Conclusion
The reported operando FE-EPR set-up enables the identification and kinetic resolution of paramagnetic intermediates formed by surface-immobilized redox catalysts. This economical, easy-to-replicate and user-friendly set-up has several advantages: (1) it is compatible with the widespread super-high-Q EPR cavities, (2) operation is possible at room temperature, with an aqueous solution and under flow conditions, and (3) a ‘true’ reference electrode (with a stable potential) can be used. These advantages make CV-based SEC measurements (FECV-EPR) with excellent potential control possible. Besides exhibiting an electrochemical response on par with ‘pure’ electrochemical set-ups, our SEC experiments enable direct visualization of the electronic state of the catalyst (STEMPO) through in situ EPR measurements both under catalytic and non-catalytic conditions. Operando FE-EPR has enabled the measurement of essential kinetic parameters in this model surface-immobilized electrocatalytic reaction.
By using the experimentally determinable kinetic parameters from FE-EPR (ks, kcat and KM), our electrochemical model could explain the observed trends in the catalytic wave shapes with increasing substrate concentrations (decreasing n and increasing Ecatalytic, as determined reliably with FECV-EPR). This has revealed that the interplay between electron transfer and catalysis is key to the efficiency of the nitroxide catalyst. Although fast electron transfer is often assumed for small-molecular systems on surfaces, this is not the case, and the effect on the concentrations of catalytic intermediates within the catalytic cycle could be resolved. In the future, this experimental insight, combined with Multiphysics modelling to test and compare mechanistic hypotheses to the experimental data, could be extended to include the full toolkit of available electrochemical and EPR techniques. Freeze-quenching16,19 will open the prospect of investigating fast-relaxing radicals formed during catalytic reactions at any applied potential and using pulse EPR. Through the possibility to observe, identify and quantify low-concentration key paramagnetic active-site species and the ensuing kinetic resolution, operando FE-EPR has the potential to contribute to the rational design of catalysts by tuning immobilization strategies and local environments to achieve the transition to sustainable chemistry
Methods
Materials
All chemicals were purchased at analytical grade and used without further purification from Sigma-Aldrich. STEMPO was synthesized as described in ref. 27. ITO nanoparticles for making hierarchical electrodes were purchased from Sigma-Aldrich (nanopowder with particle size of <50 nm). Deionized ultrapure water (18 MΩ cm) was used for all experiments. The sodium carbonate buffer (Na2CO3, 500 mM) was adjusted to pH 8.0 or pH 7.3 with concentrated HCl(aq). Stock solutions of 4-methylbenzyl alcohol (30 mM) and glycerol (5 M) were prepared in the Na2CO3 buffer.
Electrode preparation and functionalization
Titanium strips (Sigma-Aldrich, thickness 0.127 mm, purity 99.7% trace metals) were cut to the dimensions shown in Fig. 2b and sonicated sequentially for 20 min in EtOH, followed by 2-isopropanol and finally acetone. ITO nanoparticles (5 wt%) were suspended in a pure ethanol solution with 5 M acetic acid. The nanoparticle solution was sonicated for 30 min, then 10 µl was drop-cast onto each side of the ITO-sputtered titanium strip. Once air-dried, the electrodes were heated from room temperature to 500 °C at a rate of 1 °C min−1, then annealed at 500 °C for 20 min. Once cooled, the working electrodes (henceforth referred to as mesoITO WEs) were cleaned by submersion in a mixture of 30% NH4OH:H2O:30% H2O2 (1:5:1 vol/vol) at 70 °C for 15 min, then dried in the oven at 180 °C for 1 h. STEMPO was immobilized on the electrode surface as described previously27.
Film-electrochemistry
Electrochemical measurements were carried out using a µAutolabIII potentiostat in combination with NOVA software. Electrochemical experiments were performed using the standard three-electrode configuration, with the mesoITO WE, AgǀAgCl (3 M KCl) as the reference electrode (RE, World Precision Instruments) and a coiled nickel wire (thickness of 50 µm) as the counter electrode (CE). The electrolyte consisted of 500 mM Na2CO3 buffer (pH 8.0 or pH 7.3). Measurements were performed on the bench, open to the laboratory atmosphere, unless otherwise stated. Two electrochemical cells were used in this study: (1) a custom 3D-printed cell for FE-EPR applications (Fig. 2) and (2) a standard glass cell (Southampton University scientific glassblowing service) for validation of the FE-EPR set-up. All potentials were converted to the SHE. The shift of potential due to the iR drop (ohmic drop) was negligible and corrected after data collection (Supplementary Fig. 6).
EPR spectroscopy
Continuous-wave X-band EPR measurements were performed at room temperature with an X-band Super High Sensitivity Probehead ER 4122SHQE unit (Bruker) and an EMX-T-DU/L Bruker spectrometer. To assess the performance of the electrochemical set-up and mesoITO WE before or after FE-EPR measurements, standard field-sweep EPR experiments were performed. The 2D field-delay experiments were carried out during FE-EPR measurements. EPR parameters for 2D field-delay experiments were chosen to minimize the sweep time of a single EPR spectrum while maximizing the resolution (62 mW microwave power, 10 mT sweep width, 2.6-s sweep time, 0.4 mT modulation amplitude, 100 kHz modulation frequency, 30 dB receiver gain and 1,000 points per scan).
In situ FE-EPR cell
The lower canonical part of the FE-EPR cell was made of low-density polyethylene. The upper reservoir was 3D-printed with thermoplastic polylactic acid.
In situ FE-EPR measurements
STEMPO-functionalized mesoITO WEs were rinsed with buffer to remove any unbound STEMPO and air-dried. Dry functionalized WEs were inserted into a standard EPR tube (Wilmad, 4-mm outer diameter clear fused-quartz (CFQ)) and an EPR field sweep was carried out (in the absence of any solvent) before FE measurements.
The FE-EPR set-up was assembled as follows: (1) the electrochemical cell was inserted into the EPR cavity; (2) the mesoITO strip was attached to a Ti wire (thickness, 10 µm) using parafilm; (3) the electrode was placed into the conical part of the FE-EPR cell (Fig. 2c); (4) circulation of 8 ml of Na2CO3 buffer (500 mM, pH 8) was initiated using a peristaltic pump (Pump P-1, General Electrics) operating at a rate of 30 mL h–1; (5) the Ag|AgCl RE was placed into the conical part of the FE-EPR cell as close as possible to the WE; (6) the Ni-wire CE was added to the reservoir of the FE-EPR cell; and (7) the electrodes were connected to the potentiostat. For the catalytic experiments, the substrate was added directly to the solution in the assembled cell inside the EPR cavity, by injecting the stock solution with the appropriate volume to give the final desired substrate concentration.
To perform in situ FE-EPR experiments under flow conditions, plastic tubing (inner diameter of 1 mm) was used to connect (1) the bottom part of the cell to the peristaltic pump and (2) the peristaltic pump to the upper part of the cell, as shown in Fig. 2. The flow direction was from the top to the bottom of the cell, with the flow speed controlled by the peristaltic pump. The part of the plastic tubing inside the EPR cavity was inserted into a 4-mm open-ended quartz tube (Fig. 2) to avoid distortion and prevent any leakage from entering the cavity. Insertion of the mesoITO strip into the SHQE EPR cavity led to a 40% drop in its quality factor Q. Field-delay EPR experiments were launched simultaneously with starting the CV scan and stopped at the end of the electrochemical experiment.
For the FECV-EPR experiments, 2D field-delay EPR was launched with a duration of 4.1 s per EPR spectrum (2.6-s sweep time + 1.5-s processing time) while swee** the potential at 5 mV s−1, which led to steps of 21 mV per EPR spectrum. Under these conditions, the total duration of the FECV-EPR experiment was ~340 s.
For the FEamp-EPR experiments, the potential was held at +0.6 V such that only the EPR-active species (STEMPO•) was present, then stepped to +1.1 V such that the EPR-silent species (STEMPO+) was generated exclusively. The current was monitored at OCP over time and the experiment was performed with and without substrate. EPR spectra were recorded throughout the chronoamperometry-OCP measurement.
Morphological characterizations
Scanning electron microscopy (SEM) images were collected using a Zeiss LEO Gemini 1525 field-emission-gun scanning electron microscope (FEG-SEM) with an InLens detector, using an accelerating voltage of 5 kV and 30-µm standard aperture. The top surface images of the mesoITO electrode were taken by fixing the electrode to a standard flat SEM specimen stub. The cross-sectional images were taken by fixing the electrode to a 45°-angled SEM specimen stub.
Confocal topography analysis was conducted using a Zeiss LSM 800 laser confocal scanning microscope with ZEN Blue 2.6 software. Confocal reflection-mode image stacks (Z-stack interval of 0.26 µm) were obtained using a 405-nm laser (2.0% power) with a ×20/NA 0.7 objective lens. The collected stacks were then processed using ConfoMap software to obtain the 3D view image and determine the film thickness of the mesoITO electrode.
HPLC for product analysis and quantification
During the stepped chronoamperometry catalytic reaction, a 1-ml aliquot of the solution was taken from the FE-EPR cell at the end of each potential step. The aliquot was then analysed using an Agilent 1260 Infinity II HPLC system and a diode array detector monitoring 254 nm (Supplementary Fig. 20). A 2-µl volume of the sample was injected into a flow of 0.5 ml min−1 through a 50 mm × 2.1 mm Raptor C18 column (particle size, 2.7 µm) purchased from Restek. The temperature was 40 °C and the mobile phase consisted of a mixture of acetonitrile (MeCN) and 5 mM aqueous ammonium formate, with a gradient from 5% MeCN to 95% MeCN over 1 min, followed by a hold at 95% MeCN for 3.5 min. Standard calibration curves for 4-methylbenzaldehyde (Supplementary Fig. 21) were then generated to quantify the product and determine the concentration of species in the reaction aliquot.
Data analysis
CV analysis by the Laviron method
The Laviron analysis was carried out using the following equations:
where ΔEp, a and ΔEp, c are the differences between the potential of the anodic (a) and cathodic (c) peaks to the formal reduction potential (Enon-catalytic, CV) obtained by averaging the anodic and cathodic potentials at 5 mV s−1, n is the number of electrons transferred, α is the electron-transfer coefficient, ν is the scan rate, and kapp is the apparent rate constant for electron transfer. R, T and F are the ideal gas constant, absolute temperature and Faraday constant, respectively.
The Laviron method (Supplementary Fig. 4) was applied by linearly fitting the anodic and cathodic regions of the trumpet plot for values of ΔEp, a, ΔEp, c > 100 mV. (1 − α) and α were determined from the gradients of the anodic and cathodic trends respectively. kapp, a and kapp, c were deduced from the y intercept, and the critical scan rate, υc, was obtained from the x intercept by extrapolating the linear regression of the trumpet plot in both regions to ΔEp = 0.
EPR signal intensity calibration
The concentration of STEMPO radical observed by EPR was determined through calibration with different known concentrations of 4-aminoTEMPO. The same electrode configuration was used in the FE-EPR cell as in Fig. 2a, but instead of attaching STEMPO to the WE surface, 4-aminoTEMPO was added to the solution at different concentrations. The resulting linear dependency (Supplementary Fig. 8) of the 4-aminoTEMPO EPR signal intensity versus concentration was then used to determine the concentration of STEMPO radicals observed in FEamp-EPR measurements. STEMPO• concentrations of 80 and 70 µM were determined on the electrodes used for measurements with MBA and glycerol, respectively.
Michaelis–Menten model
The Michaelis–Menten model was used to fit the catalytic currents and radical regeneration rates, based on the Michaelis–Menten equation:
where v is the rate of the reaction, Vmax is the maximum rate of the reaction, and KM is the Michaels–Menten constant. Vmax and KM were deduced from the plots obtained. The binding affinity is the inverse of the Michaelis–Menten constant. The catalytic rate kcat was calculated using the following equation:
where [Catalyst]i is the initial concentration of catalyst, here STEMPO, quantified from EPR (Supplementary Fig. 8 and Supplementary Section 7).
Nernst fitting of FE-EPR data
The Nernst equation was used to fit the FE-EPR data for the \({{\rm{STEMPO}}}^{+}+n{\rm{e}}^{-}\rightleftharpoons {{\rm{STEMPO}}}^{{\rm{\bullet }}}\) equilibrium reaction:
where E is the potential in the cell, \({E}^{\,^\circ }\) is the standard reduction potential, R is the gas constant, T is the temperature (here room temperature), n is the number of electrons transferred, and F is the Faraday constant.
Knowing that only STEMPO• is EPR-active, and that at low potentials, all STEMPO species are in the STEMPO• form, the total concentration of STEMPO is equal to [STEMPO•]i. Consequently, [STEMPO•]i = [STEMPO+] + [STEMPO•].
[STEMPO•] is equivalent to the double integral of the STEMPO radical EPR signal. At room temperature, this leads to the following equation used to plot FECV-EPR data:
where \({\iint {{\rm{STEMPO}}}^{{\rm{\bullet }}}}\) are the double integrals of the STEMPO• EPR spectra.
CV FE-EPR data analysis
To process the acquired electrochemical and EPR data, we developed a MATLAB-based program. This program plots EPR intensities or spin concentrations as a function of the applied potential with fitting to the Nernst equation. The analysis procedure for the FECV-EPR data is shown in Supplementary Video 2 and summarized here briefly. The EPR and CV data were first plotted independently. If multiple CV scans were performed, one CV scan (with the corresponding EPR data) was selected for the subsequent analysis. Because the time axis is the common basis between the EPR and CV data, the chosen CV scan and the corresponding EPR data were split into forward and reverse datasets. The forward and reverse EPR data were baseline-corrected using the function basecorr in EasySpin77 before double integration. To assign a potential value to each EPR spectrum acquired during the forward CV scan, the potential range corresponding to the forward CV scan was divided by the total number x of EPR spectra of this range. The resulting potential increment was used as a ‘step’ on the forward CV potential axis, resulting in n different points on this axis, with each potential value corresponding to one EPR spectrum. The double integrals of the EPR spectra (y axis) were plotted as a function of potential obtained from the forward CV scan (x axis) and fitted to the Nernst equation. The Nernst fit was optimized directly using the Simplex derivative-free method through the fminsearch MATLAB function. The same process was repeated for the reverse CV scan datasets.
Chronoamperometry-EPR data analysis
Double integrals of the EPR spectra (following baseline correction, as described for the CV-EPR data) were plotted against time. The resulting data, corresponding to the regeneration of the nitroxide radical, were fitted using first-order relaxation:
where y is the EPR double integral or radical concentration, A1 is the amplitude, t is the time, which corresponds to the x axis, k is the rate of regeneration of the radical and y0 is the asymptotic constant reached when t → ∞.
Multiphysics modelling
COMSOL Multiphysics 6.1 with electroanalysis and laminar flow modules was used for Multiphysics modelling to describe the solution (electro)chemical reactions and convection, respectively. This model solves ordinary differential equations corresponding to well-defined analytical expressions of mass transport, (electro)chemical reaction rates and equilibria. Further details are provided in Supplementary Section 9.
Data availability
Data for the main text and Supplementary Information are available from the Imperial Research Data repository (https://doi.org/10.14469/hpc/13519). Source data are provided with this paper.
Code availability
Custom MATLAB-based FE-EPR data analysis programs to accompany the roadmap for data analysis provided in Supplementary Videos 1 and 2 are available from the Imperial Research Data repository (https://doi.org/10.14469/hpc/13517). COMSOL Multiphysics models were built based on the information provided in Supplementary Section 9. Model reports are available from https://doi.org/10.14469/hpc/13517.
References
Bracci, M. et al. in Electron Paramagnetic Resonance Vol. 27 (eds Chechick, V. et al.) 1–46 (Royal Society of Chemistry, 2020).
Goswami, M., Chirila, A., Rebreyend, C. & de Bruin, B. EPR spectroscopy as a tool in homogeneous catalysis research. Top. Catal. 58, 719–750 (2015).
den Hartog, S. et al. Electrocatalysis under a magnetic lens: a combined electrochemistry and electron paramagnetic resonance review. Electrochim. Acta 407, 139704 (2022).
Beejapur, H. A. et al. TEMPO in chemical transformations: from homogeneous to heterogeneous. ACS Catal. 9, 2777–2830 (2019).
Sheldon, R. A. E factors, green chemistry and catalysis: an odyssey. Chem. Commun. 2008, 3352–3365 (2008).
Sheldon, R. A. Why green chemistry and sustainability of resources are essential to our future. J. Environ. Monit. 10, 406–407 (2008).
Dalle, K. E. et al. Electro- and solar-driven fuel synthesis with first row transition metal complexes. Chem. Rev. 119, 2752–2875 (2019).
Zhang, S., Fan, Q., **a, R. & Meyer, T. J. CO2 reduction: from homogeneous to heterogeneous electrocatalysis. Acc. Chem. Res. 53, 255–264 (2020).
Abdinejad, M., Hossain, M. N. & Kraatz, H.-B. Homogeneous and heterogeneous molecular catalysts for electrochemical reduction of carbon dioxide. RSC Adv. 10, 38013–38023 (2020).
Lu, G.-Q. & Wieckowski, A. Heterogeneous electrocatalysis: a core field of interfacial science. Curr. Opin. Colloid Interface Sci. 5, 95–100 (2000).
Siu, J. C., Fu, N. & Lin, S. Catalyzing electrosynthesis: a homogeneous electrocatalytic approach to reaction discovery. Acc. Chem. Res. 53, 547–560 (2020).
Andrei, V., Wang, Q., Uekert, T., Bhattacharjee, S. & Reisner, E. Solar panel technologies for light-to-chemical conversion. Acc. Chem. Res. 55, 3376–3386 (2022).
Yuan, Y. & Lei, A. Is electrosynthesis always green and advantageous compared to traditional methods? Nat. Commun. 11, 802 (2020).
Bligaard, T., Nørskov, J. K. & Lundqvist, B. I. in Handbook of Surface Science Vol. 3 (eds Hasselbrink, E. & Lundqvist, B. I.) 269–340 (Elsevier, 2008).
Zhou, C. et al. Application of electrochemical methods in heterogeneous catalysis. Curr. Opin. Chem. Eng. 26, 88–95 (2019).
Bonke, S. A., Risse, T., Schnegg, A. & Brückner, A. In situ electron paramagnetic resonance spectroscopy for catalysis. Nat. Rev. Methods Primers 1, 33 (2021).
Pauwels, D. et al. Identifying intermediates in the reductive intramolecular cyclisation of allyl 2-bromobenzyl ether by an improved electron paramagnetic resonance spectroelectrochemical electrode design combined with density functional theory calculations. Electrochim. Acta 271, 10–18 (2018).
Kutin, Y., Cox, N., Lubitz, W., Schnegg, A. & Rüdiger, O. In situ EPR characterization of a cobalt oxide water oxidation catalyst at neutral pH. Catalysts 9, 926 (2019).
Abdiaziz, K., Salvadori, E., Sokol, K. P., Reisner, E. & Roessler, M. M. Protein film electrochemical EPR spectroscopy as a technique to investigate redox reactions in biomolecules. Chem. Commun. 55, 8840–8843 (2019).
Kulikov, I. et al. Spins at work: probing charging and discharging of organic radical batteries by electron paramagnetic resonance spectroscopy. Energy Environ. Sci. 15, 3275–3290 (2022).
Geng, F. et al. Operando EPR and EPR imaging study on a NaCrO2 cathode: electronic property and structural degradation with Cr dissolution. J. Phys. Chem. Lett. 12, 781–786 (2021).
Fischer, J. W. A. et al. Methane oxidation over Cu2+/[CuOH]+ pairs and site-specific kinetics in copper mordenite revealed by operando electron paramagnetic resonance and UV/visible spectroscopy. Angew. Chem. 135, e202303574 (2023).
Zichittella, G., Polyhach, Y., Tschaggelar, R., Jeschke, G. & Pérez-Ramírez, J. Quantification of redox sites during catalytic propane oxychlorination by operando EPR spectroscopy. Angew. Chem. 133, 3640–3646 (2021).
Armstrong, F. A., Cheng, B., Herold, R. A., Megarity, C. F. & Siritanaratkul, B. From protein film electrochemistry to nanoconfined enzyme cascades and the electrochemical leaf. Chem. Rev. 123, 5421–5458 (2023).
Leung, J. J. et al. Solar-driven reduction of aqueous CO2 with a cobalt bis(terpyridine)-based photocathode. Nat. Catal. 2, 354–365 (2019).
Fang, X. et al. Structure–activity relationships of hierarchical three-dimensional electrodes with photosystem II for semiartificial photosynthesis. Nano Lett. 19, 1844–1850 (2019).
Bajada, M. A. et al. A precious-metal-free hybrid electrolyzer for alcohol oxidation coupled to CO2-to-syngas conversion. Angew. Chem. Int. Ed. 59, 15633–15641 (2020).
Korzeniewski, C., Peterson, E. M., Kitt, J. P., Minteer, S. D. & Harris, J. M. Adapting confocal Raman microscopy for in situ studies of redox transformations at electrode-electrolyte interfaces. J. Electroanal. Chem. 896, 115207 (2021).
Bozal-Ginesta, C. et al. Spectroelectrochemistry of water oxidation kinetics in molecular versus heterogeneous oxide iridium electrocatalysts. J. Am. Chem. Soc. 144, 8454–8459 (2022).
Bobbitt, J. M., Brückner, C. & Merbouh, N. Oxoammonium‐and nitroxide‐catalyzed oxidations of alcohols. in Organic Reactions 103–424 (Wiley, 2010).
Semmelhack, M. F., Chou, C. S. & Cortes, D. A. Nitroxyl-mediated electrooxidation of alcohols to aldehydes and ketones. J. Am. Chem. Soc. 105, 4492–4494 (1983).
Sheldon, R. A., Arends, I. W. C. E., ten Brink, G.-J. & Dijksman, A. Green, catalytic oxidations of alcohols. Acc. Chem. Res. 35, 774–781 (2002).
De Nooy, A. E. J., Besemer, A. C. & Van Bekkum, H. On the use of stable organic nitroxyl radicals for the oxidation of primary and secondary alcohols. Synthesis 10, 1153–1174 (1996).
Nutting, J. E., Rafiee, M. & Stahl, S. S. Tetramethylpiperidine N-oxyl (TEMPO), phthalimide N-oxyl (PINO), and related N-oxyl species: electrochemical properties and their use in electrocatalytic reactions. Chem. Rev. 118, 4834–4885 (2018).
Ciriminna, R., Palmisano, G. & Pagliaro, M. Electrodes functionalized with the 2,2,6,6-tetramethylpiperidinyloxy radical for the waste-free oxidation of alcohols. ChemCatChem 7, 552–558 (2015).
Neukermans, S. et al. A versatile in‐situ electron paramagnetic resonance spectro‐electrochemical approach for electrocatalyst research. ChemElectroChem 7, 4578–4586 (2020).
Goldberg, I. B. & Bard, A. J. Simultaneous electrochemical-electron spin resonance measurements. I. Cell design and preliminary results. J. Phys. Chem. 75, 3281–3290 (1971).
Liu, Y. et al. Time-resolved EPR revealed the formation, structure and reactivity of N-centered radicals in an electrochemical C(sp3)-H arylation reaction. J. Am. Chem. Soc. 143, 20863–20872 (2021).
Tamski, M. A., Macpherson, J. V., Unwin, P. R. & Newton, M. E. Electrochemical electron paramagnetic resonance utilizing loop gap resonators and micro-electrochemical cells. Phys. Chem. Chem. Phys. 17, 23438–23447 (2015).
Muresan, N. M., Willkomm, J., Mersch, D., Vaynzof, Y. & Reisner, E. Immobilization of a molecular cobaloxime catalyst for hydrogen evolution on a mesoporous metal oxide electrode. Angew. Chem. Int. Ed. 51, 12749–12753 (2012).
Sheehan, S. W. et al. A molecular catalyst for water oxidation that binds to metal oxide surfaces. Nat. Commun. 6, 6469 (2015).
Cobb, S. J. et al. Fast CO2 hydration kinetics impair heterogeneous but improve enzymatic CO2 reduction catalysis. Nat. Chem. 14, 417–424 (2022).
Zhang, J. Z. et al. Photoelectrochemistry of photosystem II in vitro vs in vivo. J. Am. Chem. Soc. 140, 6–9 (2018).
Fang, X., Kalathil, S., Divitini, G., Wang, Q. & Reisner, E. A three-dimensional hybrid electrode with electroactive microbes for efficient electrogenesis and chemical synthesis. Proc. Natl. Acad. Sci. USA 117, 5074–5080 (2020).
Goldberg, I. B., Bard, A. J. & Feldberg, S. W. Resistive effects in thin electrochemical cells. Digital simulations of electrochemistry in electron spin resonance cells. J. Phys. Chem. 76, 2550–2559 (1972).
Materna, K. L., Brennan, B. J. & Brudvig, G. W. Silatranes for binding inorganic complexes to metal oxide surfaces. Dalton Trans. 44, 20312–20315 (2015).
Gonzalez, J. & Sequí-Castellano, J. A. Electrochemical determination of kinetic parameters of surface confined redox probes in presence of intermolecular interactions by means of cyclic voltammetry. Application to TEMPO monolayers in gold and platinum electrodes. Electrochim. Acta 365, 137331 (2021).
Henstridge, M. C., Laborda, E., Rees, N. V. & Compton, R. G. Marcus-Hush-Chidsey theory of electron transfer applied to voltammetry: a review. Electrochim. Acta 84, 12–20 (2012).
Conte, M., Miyamura, H., Kobayashi, S. & Chechik, V. Spin trap** of Au-H intermediate in the alcohol oxidation by supported and unsupported gold catalysts. J. Am. Chem. Soc. 131, 7189–7196 (2009).
Li, L. et al. A crystalline porous coordination polymer decorated with nitroxyl radicals catalyzes aerobic oxidation of alcohols. J. Am. Chem. Soc. 136, 7543–7546 (2014).
Delorme, A. E., Sans, V., Licence, P. & Walsh, D. A. Tuning the reactivity of TEMPO during electrocatalytic alcohol oxidations in room-temperature ionic liquids. ACS Sustain. Chem. Eng. 7, 11691–11699 (2019).
Taitt, B. J., Bender, M. T. & Choi, K. S. Impacts of the regeneration pathways of the oxoammonium cation on electrochemical nitroxyl radical-mediated alcohol oxidation. ACS Catal. 10, 265–275 (2020).
Compton, R. G., Fisher, A. C. & Spackman, R. A. Homogeneous catalysis of electrochemical reactions. channel electrode voltammetry and the EC′ mechanism. Electroanalysis 4, 167–182 (1992).
Rafiee, M., Miles, K. C. & Stahl, S. S. Electrocatalytic alcohol oxidation with TEMPO and bicyclic nitroxyl derivatives: driving force trumps steric effects. J. Am. Chem. Soc. 137, 14751–14757 (2015).
Elgrishi, N., Chambers, M. B., Artero, V. & Fontecave, M. Terpyridine complexes of first row transition metals and electrochemical reduction of CO2 to CO. Phys. Chem. Chem. Phys. 16, 13635–13644 (2014).
Comminges, C., Barhdadi, R., Doherty, A. P., O’Toole, S. & Troupel, M. Mechanism of 2,2′6,6′-tetramethylpiperidin-N-oxyl-mediated oxidation of alcohols in ionic liquids. J. Phys. Chem. A 112, 7848–7855 (2008).
Lee, K. J., Elgrishi, N., Kandemir, B. & Dempsey, J. L. Electrochemical and spectroscopic methods for evaluating molecular electrocatalysts. Nat. Rev. Chem. 1, 0039 (2017).
Kepner, G. R. Saturation behavior: a general relationship described by a simple second-order differential equation. Theor. Biol. Med. Model. 7, 11 (2010).
Guedes da Silva, M. F. C. et al. Evidence for a Michaelis-Menten type mechanism in the electrocatalytic oxidation of mercaptopropionic acid by an Amavadine model. J. Am. Chem. Soc. 118, 7568–7573 (1996).
Pirrung, M. C., Liu, H. & Morehead, A. T. Rhodium chemzymes: Michaelis-Menten kinetics in dirhodium(II) carboxylate-catalyzed carbenoid reactions. J. Am. Chem. Soc. 124, 1014–1023 (2002).
Nishiori, D., Wadsworth, B. L. & Moore, G. F. Parallels between enzyme catalysis, electrocatalysis and photoelectrosynthesis. Chem. Catal. 1, 978–996 (2021).
Xu, W., Kong, J. S. & Chen, P. Single-molecule kinetic theory of heterogeneous and enzyme catalysis. J. Phys. Chem. C 113, 2393–2404 (2009).
Semmelhack, M. F., Schmid, C. R. & Cortés, D. A. Mechanism of the oxidation of alcohols by 2,2,6,6-tetramethylpiperidine nitrosonium cation. Tetrahedron Lett. 27, 1119–1122 (1986).
Golubev, V. A., Rozantsev, E. G. & Neiman, M. B. Some reactions of free iminoxyl radicals with the participation of the unpaired electron. Bull. Acad. Sci. USSR Div. Chem. Sci. 14, 1898–1904 (1965).
Kishioka, S., Ohsaka, T. & Tokuda, K. Spectroelectrochemical detection of an intermediate in the alcohol oxidation process with a nitroxyl radical. Chem. Lett. 27, 343–344 (1998).
Bailey, W. F., Bobbitt, J. M. & Wiberg, K. B. Mechanism of the oxidation of alcohols by oxoammonium cations. J. Org. Chem. 72, 4504–4509 (2007).
Hickey, D. P., Milton, R. D., Chen, D., Sigman, M. S. & Minteer, S. D. TEMPO-modified linear poly(ethylenimine) for immobilization-enhanced electrocatalytic oxidation of alcohols. ACS Catal. 5, 5519–5524 (2015).
Gerken, J. B., Pang, Y. Q., Lauber, M. B. & Stahl, S. S. Structural effects on the pH-dependent redox properties of organic nitroxyls: Pourbaix diagrams for TEMPO, ABNO and three TEMPO analogs. J. Org. Chem. 83, 7323–7330 (2018).
Chung, J., Hertler, P., Plaxco, K. W. & Sepunaru, L. Catalytic interruption mitigates edge effects in the characterization of heterogeneous, insulating nanoparticles. J. Am. Chem. Soc. 143, 18888–18898 (2021).
Bryant, M. A. & Crooks, R. M. Determination of surface pKa values of surface-confined molecules derivatized with pH-sensitive pendant groups. Langmuir 9, 385–387 (1993).
Kishioka, S. Y., Ohsaka, T. & Tokuda, K. Electrochemical studies of acid-promoted disproportionation of nitroxyl radical. Electrochim. Acta 48, 1589–1594 (2003).
Grammatico, D. et al. Heterogenised molecular catalysts for sustainable electrochemical CO2 reduction. Angew. Chem. Int. Ed. 61, e202206399 (2022).
Maki, A. H. & Geske, D. H. Detection of electrolytically generated transient free radicals by electron spin resonance. J. Chem. Phys. 30, 1356–1357 (1959).
Geske, D. H. & Maki, A. H. Electrochemical generation of free radicals and their study by electron spin resonance spectroscopy; the nitrobenzene anion radical. J. Am. Chem. Soc. 82, 2671–2676 (1960).
Michman, M. Homogeneous vs. heterogeneous processes in electrocatalysis. Different types of catalysis in organic electrooxidation. J. Mol. Catal. A Chem. 107, 393–398 (1996).
Toybenshlak, M. & Carmieli, R. A new and robust method for in-situ EPR electrochemistry. Isr. J. Chem. 59, 1020–1026 (2019).
Stoll, S. & Schweiger, A. EasySpin, a comprehensive software package for spectral simulation and analysis in EPR. J. Magn. Reson. 178, 42–55 (2006).
Acknowledgements
This study was supported by the Leverhulme Trust (grant no. RPG-2018-183 to M.M.R. and E.R.), a Leverhulme Early Career Fellowship (ECF-2021-072 to S.J.C.), the Isaac Newton Trust (20.08(r), to S.J.C.), an Imperial College President’s scholarship to Y.D., an EPSRC grant (EP/W005794/1) to M.M.R. and a UKRI Frontiers (ERC Advanced) grant (EP/X030563/1 to E.R.). The EPR measurements were performed at the Centre for Pulse EPR at Imperial College London (PEPR), supported by EPSRC grant no. EP/T031425/1 to M.M.R. We thank J. Eisermann (Imperial College) for using and improving the Laviron method fitting program. A. Collauto (Imperial College) and J. Eisermann are also acknowledged for helpful discussions.
Author information
Authors and Affiliations
Contributions
M.S.-E. developed the operando FE-EPR methodology, with input from and based on prior work from K.A. M.S.-E. carried out and developed the analysis programs for all FE-EPR experiments. S.J.C. carried out all electrochemical modelling. Y.D. conducted the product detection experiments and electrode surface characterization. M.A.B. synthesized STEMPO. M.M.R. conceived the project. M.M.R. and E.R. supervised the project. M.S.-E. and M.M.R. wrote the manuscript, with input from S.J.C. and E.R., and contributions from all authors.
Corresponding author
Ethics declarations
Competing interests
The authors declare no competing interests.
Peer review
Peer review information
Nature Chemistry thanks Mohammad Rafiee and the other, anonymous, reviewer(s) for their contribution to the peer review of this work.
Additional information
Publisher’s note Springer Nature remains neutral with regard to jurisdictional claims in published maps and institutional affiliations.
Extended data
Extended Data Fig. 1 Electrochemical characterisation of STEMPO|mesoITO electrode in the FE-EPR cell.
Cyclic voltammograms of STEMPO|mesoITO electrode showing oxidoreduction of the STEMPO•/STEMPO+ redox couple in the FE-EPR cell with 8 ml 500 mM Na2CO3(aq), pH 8.0 at 20 °C. Two CVs are shown for each scan rate to illustrate the stability. See methods for experimental parameters and conditions.
Extended Data Fig. 2 EPR characterisation of STEMPO|mesoITO electrode in the FE-EPR cell.
Long scan (black line, 50 s) and short scan (green line, 2.6 s) EPR spectra of STEMPO• attached to the surface of ITO measured in the FE-EPR cell at open circuit potential in presence of buffer and under flow conditions. See Methods for experimental parameters and conditions.
Extended Data Fig. 3 Complete set of EPR spectra recorded over the course of the FEcv-EPR experiment under non-catalytic conditions.
Complete set of 77 EPR spectra obtained during the FECV-EPR measurements during both forward and reverse CV scans. The sweep time per spectrum was 2.6 s, and around 4 s including processing time. With a scan rate of 5 mVs−1 and a potential range of 800 mV, each EPR spectrum has a potential range of 21 mV. During the forward CV scan, the intensity of the EPR spectra decreases with increasing the potential, reaching a minimum at 900 mV. During the reverse CV scan, the intensity increases back to reach a maximum at 800 mV.
Extended Data Fig. 4 Experimental and simulated non-turnover signals for STEMPO.
a Experimental (dashed) and simulated (solid) cyclic voltammograms of STEMPO on a MesoITO electrode over a range of scan rates (5–400 mV) at pH 8.0. For Experimental details see Methods and for simulation details see Supplementary Information section 9. b Experimental (filled points) and simulated peak potentials for the anodic (red) and cathodic (black) branch. Lines represent linear fits to the region of experimental data where ΔEp > 200 mV for experimental determination of ks = 0.77 s−1 and α = 0.37. c Experimental (filled points) and simulated peak currents for the anodic (red) and cathodic (black) peak potentials as a function of scan rate.
Extended Data Fig. 5 Schematic representation of the mechanism of solution-based electrocatalysis with TEMPO•.
Electrochemical oxidation (step 1), adduct formation (step 2), alcohol oxidation (step 3) and catalyst regeneration (step 4).
Extended Data Fig. 6 Complete set of EPR spectra recorded over the course of the FEcv-EPR experiment under catalytic conditions.
EPR spectra obtained during the FECV-EPR measurements during both forward and reverse CV scans in the presence of 20 mM MBA under catalytic conditions. Similarly, to the non-turnover spectra, each EPR spectrum covers ~21 mV. During the forward CV scan, the intensity of the EPR spectra decreases with increasing the potential, reaching a minimum at 1000 mV. During the reverse CV scan, the intensity increases back to reach a maximum at 700 mV.
Extended Data Fig. 7 Effect of varying kS and kcat on the catalytic response.
CVs with varied ratios of ks to kcat. a, STEMPO• partial surface coverages, demonstrating a STEMPO• concentration dependence that fits an apparent n = 1 Nernst curve at high ks, decreasing as ks < critical scan rate. b, STEMPO• partial surface coverages, demonstrating a STEMPO• concentration dependence that fits an apparent n = 1 Nernst curve at the limits of kcat and an n < 1 apparent Nernst curve at intermediate values. The apparent E1/2 shifts to more positive potentials with increasing kcat. At high kcat the reverse response differs from the forward response due to substrate depletion.
Extended Data Fig. 8 Generation of EPR-active STEMPO• under open circuit potential (OCP) in the absence and presence of glycerol at pH 8.0.
The potential was held at +0.6 V such that only the EPR-active species (STEMPO•) is present, and then stepped to +1.1 V such that EPR-silent (STEMPO + ) is generated exclusively. The current is monitored at OCP over time and the experiment was performed with and without substrate. EPR spectra were recorded throughout the chronoamperometry-OCP measurement. a, Double integrals of EPR spectra showing regeneration of STEMPO• in the absence of substrate (black dots), and in the presence of 1 mM (red dots) and 5 mM (blue dots) glycerol after potential steps at + 0.6 V and + 1.1 V vs SHE, for 100 s each. b, STEMPO• regeneration rates as a function of substrate concentration (0, 1, 5 and 10 mM glycerol), deduced from a 1st order relaxation fit of the variation of STEMPO• concentration over time, as quantified from the EPR data. The solid line shows the fit using the Michaelis-Menten model with KM = 1.8 ± 0.9 mM and kcat = 0.06 s−1.
Extended Data Fig. 9 Generation of EPR-active STEMPO• under open circuit potential (OCP) in the absence and presence of MBA at pH 7.3.
The potential was held at +0.6 V such that only the EPR-active species (STEMPO•) is present, and then stepped to +1.1 V such that EPR-silent (STEMPO + ) is generated exclusively. The current is monitored at OCP over time and the experiment was performed with and without substrate. EPR spectra were recorded throughout the chronoamperometry-OCP measurement. a Double integrals of EPR spectra showing regeneration of STEMPO• in the absence of substrate (black dots), and in the presence of 1 mM (red dots) and 6.8 mM (blue dots) MBA after potential steps at + 0.6 V and + 1.1 V vs SHE, for 100 s each. b STEMPO• regeneration rates as a function of substrate concentration (0, 1, 2.4, 6.8, 10 and 20 mM MBA; the colours of the data points match the data in a and in Supplementary Figure 16), deduced from a 1st order relaxation fit of the variation of STEMPO• concentration over time, as quantified from the EPR data. The solid line shows the fit using the Michaelis-Menten model with KM = 0.96 mM and kcat = 0.09 s−1.
Extended Data Fig. 10 Experimental and simulated FE-EPR experiments for different STEMPO• regeneration pathways.
a, CVs at a range of substrate concentrations ([MBA] = 0–20 mM, pH 8.0) solid lines are experimental data and dash-dot lines simulate a PCET regeneration pathway b, STEMPO• partial surface coverages at a range of substrate concentrations for a PCET regeneration pathway ([MBA] = 0–20 mM, pH 8.0) c, CVs at a range of substrate concentrations ([MBA] = 0–20 mM, pH 8.0) solid lines are experimental data and dash-dot lines simulate a comproportionation regneration pathway d, STEMPO• partial surface coverages at a range of substrate concentrations for a comproportionation pathway([MBA] = 0–20 mM, pH 8.0). For all panels solid lines are fits of experimental data and dash lines are simulated data.
Supplementary information
Supplementary Information
Surface characterization of the mesoITO working electrode, electrochemical and EPR characterization of the FE-EPR cell, the mechanism of solution-based electrocatalytic alcohol oxidation by nitroxides, the general saturation behaviour model, production detection, electrochemical analysis, foot of the wave analysis, Supplementary Figs. 1–28 and Tables 1–6.
Supplementary Video 1
Example CV scan measured at 5 mV s−1, with a selected set of corresponding EPR spectra.
Supplementary Video 2
Analysis procedure of FECV-EPR data.
Source data
Source Data Fig. 2
Unprocessed confocal image.
Source Data Fig. 2
Unprocessed SEM image.
Source Data Fig. 3
Electrochemistry and EPR source data from FE(CV)-EPR experiments.
Source Data Fig. 4
Electrochemistry and EPR source data from FE(CV)-EPR experiments.
Source Data Fig. 5
FEamp-EPR data.
Source Data Extended Data Fig./Table 1
Unprocessed electrochemistry data.
Source Data Extended Data Fig./Table 2
EPR data in Excel format.
Source Data Extended Data Fig./Table 3
EPR data in Excel format.
Source Data Extended Data Fig./Table 4a
Modelling data.
Source Data Extended Data Fig./Table 4a
Modelling data.
Source Data Extended Data Fig./Table 4c
Modelling data.
Source Data Extended Data Fig./Table 6
EPR data in excel format
Source Data Extended Data Fig./Table 7a
Modelling data.
Source Data Extended Data Fig./Table 7b
Modelling data.
Source Data Extended Data Fig./Table 8
FEamp-EPR data.
Source Data Extended Data Fig./Table 9
FEamp-EPR data.
Source Data Extended Data Fig./Table 10
Modelling data.
Rights and permissions
Open Access This article is licensed under a Creative Commons Attribution 4.0 International License, which permits use, sharing, adaptation, distribution and reproduction in any medium or format, as long as you give appropriate credit to the original author(s) and the source, provide a link to the Creative Commons license, and indicate if changes were made. The images or other third party material in this article are included in the article’s Creative Commons license, unless indicated otherwise in a credit line to the material. If material is not included in the article’s Creative Commons license and your intended use is not permitted by statutory regulation or exceeds the permitted use, you will need to obtain permission directly from the copyright holder. To view a copy of this license, visit http://creativecommons.org/licenses/by/4.0/.
About this article

Cite this article
Seif-Eddine, M., Cobb, S.J., Dang, Y. et al. Operando film-electrochemical EPR spectroscopy tracks radical intermediates in surface-immobilized catalysts. Nat. Chem. 16, 1015–1023 (2024). https://doi.org/10.1038/s41557-024-01450-y
Received:
Accepted:
Published:
Issue Date:
DOI: https://doi.org/10.1038/s41557-024-01450-y
- Springer Nature Limited