

Abstract
Defining drivers of tumour initiation can provide opportunities to control cancer progression. Here we report that lysophosphatidic acid receptor 4 (LPAR4) becomes transiently upregulated on pancreatic cancer cells exposed to environmental stress or chemotherapy where it promotes stress tolerance, drug resistance, self-renewal and tumour initiation. Pancreatic cancer cells gain LPAR4 expression in response to stress by downregulating a tumour suppressor, miR-139-5p. Even in the absence of exogenous lysophosphatidic acid, LPAR4-expressing tumour cells display an enrichment of extracellular matrix genes that are established drivers of cancer stemness. Mechanistically, upregulation of fibronectin via an LPAR4/AKT/CREB axis is indispensable for LPAR4-induced tumour initiation and stress tolerance. Moreover, ligation of this fibronectin-containing matrix via integrins α5β1 or αVβ3 can transfer stress tolerance to LPAR4-negative cells. Therefore, stress- or drug-induced LPAR4 enhances cell-autonomous production of a fibronectin-rich extracellular matrix, allowing cells to survive ‘isolation stress’ and compensate for the absence of stromal-derived factors by creating their own tumour-initiating niche.


Data availability
RNA-seq data that support the findings of this study have been deposited in the Gene Expressing Omnibus (GEO) under accession code GSE198002.
The human PAAD data were derived from the TCGA Research Network (http://cancergenome.nih.gov/ and http://www.cbioportal.org/). The TNMplot public dataset that supports the findings of this study is available at https://tnmplot.com/analysis/ or in source data files.
All other data supporting the findings of this study are available from the corresponding author on reasonable request. Source data are provided with this paper.
References
Clarke, M. F. Clinical and therapeutic implications of cancer stem cells. N. Engl. J. Med. 380, 2237–2245 (2019).
Zhou, P. et al. The epithelial to mesenchymal transition (EMT) and cancer stem cells: implication for treatment resistance in pancreatic cancer. Mol. Cancer 16, 52 (2017).
Plaks, V., Kong, N. & Werb, Z. The cancer stem cell niche: how essential is the niche in regulating stemness of tumor cells? Cell Stem Cell 16, 225–238 (2015).
Delmore, J. E. et al. BET bromodomain inhibition as a therapeutic strategy to target c-Myc. Cell 146, 904–917 (2011).
Tigyi, G., Lin, K. H., Jang, I. H. & Lee, S. C. Revisiting the role of lysophosphatidic acid in stem cell biology. Exp. Biol. Med. 246, 1802–1809 (2021).
Seo, E. J. et al. Autotaxin regulates maintenance of ovarian cancer stem cells through lysophosphatidic acid-mediated autocrine mechanism. Stem Cells 34, 551–564 (2016).
Hung, K. F., Yang, T. & Kao, S. Y. Cancer stem cell theory: are we moving past the mist? J. Chin. Med. Assoc. 82, 814–818 (2019).
Senft, D. & Ronai, Z. E. Adaptive stress responses during tumor metastasis and dormancy. Trends Cancer 2, 429–442 (2016).
Hayes, J. D., Dinkova-Kostova, A. T. & Tew, K. D. Oxidative stress in cancer. Cancer Cell 38, 167–197 (2020).
Yao, W., Maitra, A. & Ying, H. Recent insights into the biology of pancreatic cancer. EBioMedicine 53, 102655 (2020).
Chen, J., Li, H., Xu, W. & Guo, X. Evaluation of serum ATX and LPA as potential diagnostic biomarkers in patients with pancreatic cancer. BMC Gastroenterol. 21, 58 (2021).
Auciello, F. R. et al. A stromal lysolipid-autotaxin signaling axis promotes pancreatic tumor progression. Cancer Discov. 9, 617–627 (2019).
Juin, A. et al. N-WASP Control of LPAR1 Trafficking Establishes Response to Self-Generated LPA Gradients to Promote Pancreatic Cancer Cell Metastasis. Dev. Cell 51, 431–445.e7 (2019).
Yamada, T. et al. Lysophosphatidic acid (LPA) in malignant ascites stimulates motility of human pancreatic cancer cells through LPA1. J. Biol. Chem. 279, 6595–6605 (2004).
Komachi, M. et al. LPA1 receptors mediate stimulation, whereas LPA2 receptors mediate inhibition, of migration of pancreatic cancer cells in response to lysophosphatidic acid and malignant ascites. Carcinogenesis 30, 457–465 (2009).
Ishii, S. et al. Diverse effects of LPA4, LPA5 and LPA6 on the activation of tumor progression in pancreatic cancer cells. Biochem. Biophys. Res. Commun. 461, 59–64 (2015).
Lee, J. W. et al. Lysophosphatidic acid receptor 4 is transiently expressed during cardiac differentiation and critical for repair of the damaged heart. Mol. Ther. 29, 1151–1163 (2021).
Bartha, A. & Gyorffy, B. TNMplot.com: a web tool for the comparison of gene expression in normal, tumor and metastatic tissues. Int. J. Mol. Sci. 22, 2622 (2021).
Sen, C. K. & Ghatak, S. miRNA control of tissue repair and regeneration. Am. J. Pathol. 185, 2629–2640 (2015).
Chaudhary, A. K., Mondal, G., Kumar, V., Kattel, K. & Mahato, R. I. Chemosensitization and inhibition of pancreatic cancer stem cell proliferation by overexpression of microRNA-205. Cancer Lett. 402, 1–8 (2017).
Jiao, X. et al. microRNA: the impact on cancer stemness and therapeutic resistance. Cells 9, 8 (2019).
Ma, J., Zhang, J., Weng, Y. C. & Wang, J. C. EZH2-mediated microRNA-139-5p regulates epithelial–mesenchymal transition and lymph node metastasis of pancreatic cancer. Mol. Cells 41, 868–880 (2018).
Hasseine, L. K. et al. miR-139 impacts FoxO1 action by decreasing FoxO1 protein in mouse hepatocytes. Biochem. Biophys. Res. Commun. 390, 1278–1282 (2009).
Okoye, I. et al. Plasma extracellular vesicles enhance HIV-1 infection of activated CD4+ T cells and promote the activation of latently infected J-Lat10.6 cells via miR-139-5p transfer. Front. Immunol. 12, 697604 (2021).
Topalovski, M. & Brekken, R. A. Matrix control of pancreatic cancer: new insights into fibronectin signaling. Cancer Lett. 381, 252–258 (2016).
Magnuson, M. A. & Osipovich, A. B. Pancreas-specific Cre driver lines and considerations for their prudent use. Cell Metab. 18, 9–20 (2013).
Geraldo, L. H. M. et al. Role of lysophosphatidic acid and its receptors in health and disease: novel therapeutic strategies. Signal Transduct. Target Ther. 6, 45 (2021).
Winkler, J., Abisoye-Ogunniyan, A., Metcalf, K. J. & Werb, Z. Concepts of extracellular matrix remodelling in tumour progression and metastasis. Nat. Commun. 11, 5120 (2020).
Ou, J. et al. Fibronectin extra domain A (EDA) sustains CD133+/CD44+ subpopulation of colorectal cancer cells. Stem Cell Res. 11, 820–833 (2013).
Yu, Q. et al. Fibronectin promotes the malignancy of glioma stem-like cells via modulation of cell adhesion, differentiation, proliferation and chemoresistance. Front. Mol. Neurosci. 11, 130 (2018).
Zhong, C. et al. Remodeling cancer stemness by collagen/fibronectin via the AKT and CDC42 signaling pathway crosstalk in glioma. Theranostics 11, 1991–2005 (2021).
Efthymiou, G. et al. Sha** up the tumor microenvironment with cellular fibronectin. Front. Oncol. 10, 641 (2020).
Nakayama, K. cAMP-response element-binding protein (CREB) and NF-kappaB transcription factors are activated during prolonged hypoxia and cooperatively regulate the induction of matrix metalloproteinase MMP1. J. Biol. Chem. 288, 22584–22595 (2013).
Habib, S. L., Mohan, S., Liang, S., Li, B. & Yadav, M. Novel mechanism of transcriptional regulation of cell matrix protein through CREB. Cell Cycle 14, 2598–2608 (2015).
Sakamoto, K. M. & Frank, D. A. CREB in the pathophysiology of cancer: implications for targeting transcription factors for cancer therapy. Clin. Cancer Res. 15, 2583–2587 (2009).
Singh, P. & Schwarzbauer, J. E. Fibronectin and stem cell differentiation—lessons from chondrogenesis. J. Cell Sci. 125, 3703–3712 (2012).
Gattazzo, F., Urciuolo, A. & Bonaldo, P. Extracellular matrix: a dynamic microenvironment for stem cell niche. Biochim. Biophys. Acta 1840, 2506–2519 (2014).
Amrutkar, M., Aasrum, M., Verbeke, C. S. & Gladhaug, I. P. Secretion of fibronectin by human pancreatic stellate cells promotes chemoresistance to gemcitabine in pancreatic cancer cells. BMC Cancer 19, 596 (2019).
Feig, C. et al. The pancreas cancer microenvironment. Clin. Cancer Res. 18, 4266–4276 (2012).
Liu, X., Zhou, L., Chen, Y., Jiang, X. & Jiang, J. CircRNF13 promotes the malignant progression of pancreatic cancer through targeting miR-139-5p/IGF1R axis. J. Oncol. 2021, 6945046 (2021).
Bao, B., Yu, X. & Zheng, W. MiR-139-5p targeting CCNB1 modulates proliferation, migration, invasion and cell cycle in lung adenocarcinoma. Mol. Biotechnol. 64, 852–860 (2022).
**, S. S., Lin, C. J., Lin, X. F., Zheng, J. Z. & Guan, H. Q. Silencing lncRNA NEAT1 reduces nonalcoholic fatty liver fat deposition by regulating the miR-139-5p/c-Jun/SREBP-1c pathway. Ann. Hepatol. 27, 100584 (2022).
Seguin, L. et al. An integrin β3–KRAS–RalB complex drives tumour stemness and resistance to EGFR inhibition. Nat. Cell Biol. 16, 457–468 (2014).
Desgrosellier, J. S. et al. Integrin αvβ3 drives slug activation and stemness in the pregnant and neoplastic mammary gland. Dev. Cell 30, 295–308 (2014).
Desgrosellier, J. S. et al. An integrin αvβ3–c-Src oncogenic unit promotes anchorage-independence and tumor progression. Nat. Med. 15, 1163–1169 (2009).
Sun, Q. et al. Proapoptotic PUMA targets stem-like breast cancer cells to suppress metastasis. J. Clin. Investig. 128, 531–544 (2018).
Cheresh, D. A. & Spiro, R. C. Biosynthetic and functional properties of an Arg-Gly-Asp-directed receptor involved in human melanoma cell attachment to vitronectin, fibrinogen, and von Willebrand factor. J. Biol. Chem. 262, 17703–17711 (1987).
Hu, Y. & Smyth, G. K. ELDA: extreme limiting dilution analysis for comparing depleted and enriched populations in stem cell and other assays. J. Immunol. Methods 347, 70–78 (2009).
**e, S. et al. sRNAPrimerDB: comprehensive primer design and search web service for small non-coding RNAs. Bioinformatics 35, 1566–1572 (2019).
Hellewell, A. L., Rosini, S. & Adams, J. C. A rapid, scalable method for the isolation, functional study, and analysis of cell-derived extracellular matrix. J. Vis. Exp. 119, e55051 (2017).
Seguin, L. et al. Galectin-3, a druggable vulnerability for KRAS-addicted cancers. Cancer Discov. 7, 1464–1479 (2017).
Cosset, E. et al. Glut3 Addiction Is a Druggable Vulnerability for a Molecularly Defined Subpopulation of Glioblastoma. Cancer Cell 32, 856–868.e5 (2017).
Acknowledgements
We thank A. Reiss, M. Morgan and M. Advani for their technical support. This study was funded by the University of California Tobacco-Related Disease Research Program (C.W., T29FT0343), and from grants awarded by the NIH, including T32CA009523 (T.R.), T32OD017863 (H.I.W.), T32HL086344 (H.I.W.), K01OD030513 (H.I.W.), R01CA155620 (A.M.L.), R01CA045726 (D.A.C.) and R35CA220512 (D.A.C.). The funders had no role in study design, data collection and analysis, decision to publish or preparation of the manuscript.
Author information
Authors and Affiliations
Contributions
C.W., S.M.W. and D.A.C. conceived, designed and wrote the manuscript. C.W. performed all the experiments with the exception of: some of the in vitro experiments performed by T.R., T.S., S.J. and J.T.; the in vivo experiments and data analysis assisted by H.I.W., Z.Y. and T.R.; and PDX cells were generated by E.M., B.G.C. and A.M.L. A.C. assisted with the RNA-seq data analysis.
Corresponding author
Ethics declarations
Competing interests
The authors declare no competing interests.
Peer review
Peer review information
Nature Cell Biology thanks Mara Sherman and the other, anonymous, reviewer(s) for their contribution to the peer review of this work. Peer reviewer reports are available.
Additional information
Publisher’s note Springer Nature remains neutral with regard to jurisdictional claims in published maps and institutional affiliations.
Extended data
Extended Data Fig. 1 LPAR4 is a stress- inducible gene.
a, Graph showing relative mRNA expression of six LPARs (normalized to housekee** gene RPL37A) for cells grown in 10% serum and 2D. b, Graph comparing LPARs expression on cells grown in stem-like culture conditions (that is, no serum/3D) for 72 h with respect to cells grown in 10% serum on 2D for 72 h. c, Graph comparing LPARs expression on cells grown in hypoxia condition (1% O2) for 72 h with respect to cells grown in normoxia for 72 h. d, e, Graphs comparing LPARs expression on cells grown in 3D condition treated with varying doses of gemcitabine or paclitaxel for 24 h. Bars represent median value per cell line (a–c). Data were presented as mean ± s.d. for n = 3 independent experiments. Statistical analyses were performed using two tailed unpaired one sample t-test (b-e). Source numerical data are available in source data.
Extended Data Fig. 2 LPAR4 does not impact cell growth in the absence of stress.
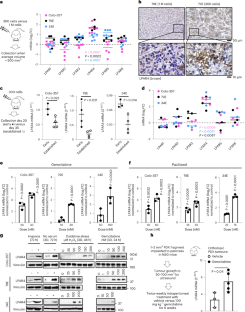
a, Immunohistochemistry staining of LPAR4 in a PDAC tissue array consisted of 15 PDAC samples and 4 samples of normal pancreas. Scale bar is 50 μM. Representative images showing normal pancreas (n = 4 biological samples), low-LPAR4 PDAC (n = 9 biological samples), and high-LPAR4 PDAC (n = 6 biological samples). Bar graph shows the relative percentage of LPAR4-low and LPAR4-high patients in the PDAC tissue array. b, Quantitative RT-PCR confirming the ectopic expression and stable knockdown of LPAR4 in 2 pancreatic cancer cell lines (Colo-357, MIA PaCa-2) and 2 patient-derived cancer cells (79E, 34E). Data were shown as mean ± s.d. (n = 4 independent experiments for Colo-357 and 79E cells with LPAR4 stable knockdown, n = 3 for Colo-357, 79E, and MiaPaCa2 cells with LPAR4 ectopic expression, n = 3 for 34E cells with LPAR4 stable knockdown, and n = 4 for 34E with LPAR4 ectopic expression). c, Non-invasive Bioluminescence images showing tumors formed at day 10 for Colo-357+sh-CTRL+ luciferase or Colo-357+sh-R4.1+luciferase of various number implanted in the pancreas of nu/nu mice. The right panel showing the luminescence intensity in a blue-to-red spectrum. d, f, Trypan blue exclusion assay showing the relative viable cell number of cells with or without LPAR4 expression manipulation grown in 10% serum and 2D at day 4 and day 7. e, Tumor growth rates for 1 million Colo-357 cells with or without LPAR4 expression manipulation in a subcutaneous tumor model. Data were presented as mean ± s.d. for n = 8 independent samples for each group. g, Quantitative RT-PCR confirming the knockdown of LPAR1 in Colo-357 cells. h, Effects of LPAR1 knockdown using siRNA on 2D or 3D (methylcellulose sphere forming) cell growth. Data were presented as mean ± s.d. for n = 3 independent experiments (d, f, g, and h). Statistical analyses were performed using two tailed unpaired one sample t-test (b, g, and h) and one-way ANOVA (d–f). Source numerical data are available in source data.
Extended Data Fig. 3 miR-139-5p downregulates LPAR4 expression in pancreatic cancer cells.
a, Graphs showing the log2-FC of miR-139-5p expression level in cells with or without LPAR4 expression manipulation. b, Graph shows the log2-FC of mRNA level of LPARs in Colo-357 cells treated with anti-miR-139-5p, normalized to cells treated with scrambled control miRNA. Data were presented as mean ± s.d. for n = 6 independent experiments for LPAR4 and n = 5 for other LPARs. c, Construct map for LPAR4-3’UTR luciferase reporter vector or control vector. d, Immunoblots showing representative of three independent experiments for LPAR4 protein level in Colo-357-sh-CTRL or sh-R4.1 cells treated with scrambled control miRNA vs. anti-miR-139-5p. e, Graphs showing the log2-FC of mRNA level of LPAR4 and various predicated miR-139-5p targets in Colo-357 or 34E cells treated with miR-139-5p mimic, normalized to cells treated with scrambled control miRNA. Data were presented as mean ± s.d. for n = 3 independent experiments (a, b, and e). Statistical analyses were performed using two tailed unpaired one sample t-test (a, b, and e). Source numerical data are available in source data.
Extended Data Fig. 4 LPAR4 upregulates ECM genes and cancer stemness-related genes in the absence of exogenous LPA.
a, Quantitative RT-PCR confirmation of LPAR4 regulated genes associated with ECM in two additional pairs of +EV vs. +R4 cells, grown in charcoal stripped FBS containing media. All mRNA level was normalized to +EV cells. b, Graphs showing the relative number of viable 79E + EV or 79E + R4 cells treated with various doses of H2O2 or gemcitabine in serum-free media for 72 h, evaluated by the CellTiter-Glo assay. c, Graph showing the number of tumorspheres formed by Colo-34+EV or Colo-357 + R4 cells grown in 3D suspension with serum-free media at day 10. The right panel shows representative images from three biological experiments for spheres formed by +EV or +R4 cells at day 10. d, Relative gene expression of CSC markers and antioxidant genes in +EV vs. +R4 cells grown in charcoal stripped FBS containing media. All mRNA level was normalized to +EV cells. Data were presented as mean ± s.d. for n = 3 independent experiments (a-d). Statistical analyses were performed using two tailed unpaired one sample t-test (a, c, and d). Source numerical data are available in source data.
Extended Data Fig. 5 LPAR4 induces the expression of FN1 isoforms containing EDA and EDB domains.
a, TNMplot showing FN1 gene expression is significantly higher in pancreatic adenocarcinoma (PAAD) than in normal pancreas (P < 0.0001). The unpaired two-tailed t test was used for statistical analysis. Bars represent median values for each group. b, Graphs showing the relative mRNA level of total FN1, FN1 containing EDA domain (FN1-EDA), and FN1 containing EDB (FN1-EDB) in +EV vs. +R4 cells as indicated. All mRNA expression was normalized to +EV cells. Expression of FN1-EDA or FN1-EDB is quantitated independently by using two different sets of primers. c, Graphs showing the relative LPAR4 mRNA level in cells stably transfected with scrambled shRNA (sh-CTRL) or two different LPAR4 shRNAs (sh-R4.1 and sh-R4.2), treated with hypoxia and no serum for 72 h. All were normalized to LPAR4 mRNA level in normoxia and no serum condition. Data were presented as mean ± s.d. for n = 3 biological experiments (b and c). P-value was calculated using two tailed unpaired one sample t-test. Source numerical data are available in source data.
Extended Data Fig. 6 FN1 is a critical mediator of LPAR4-induced cancer stemness.
a, Gene Set Enrichment Analysis (GESA) for LPAR4-induced gene expression suggests that AKT signaling is upregulated in 79E + R4 cells in the absence of LPA. b, Immunoblot showing representative of three biological experiments for the protein levels of p-AKT-S473, AKT, p-GSK-3β-S9, p-CREB-S133, CREB, and vinculin in Colo-357+EV and Colo-357 + R4 cells treated with Ipatasertib of a range of doses for 2 h, or with 1 μM Ipatasertib in a time-course experiment. c, Relative mRNA level of ECM-related genes among LPAR4 gene signature in +R4 cells transfected with si-CREB as compared to cells transfected with si-CTRL. d, Graphs showing the cell viability of cells grown on 2D with serum free or with 10% charcoal stripped FBS containing media. Cell viability was assessed by the CellTiter-Glo assay, and all numbers were normalized to EV cells transfected with si-CTRL. e, Quantitative RT-PCR confirmation of FN1 knockdown by using siRNA in three pairs of +EV and +R4 cells as indicated. f, Representative histograms of three biological experiments showing MitoSOX signaling in +EV vs. +R4 cells treated with scrambled siRNA or si-FN1. All cells were cultured in serum free media for 48 h prior to MitoSOX staining. Data were presented as mean ± s.d. for n = 3 biological experiments (c–e). P-value was calculated using two tailed unpaired one sample t-test. Source numerical data are available in source data.
Extended Data Fig. 7 ECM deposited by LPAR4 + cells endows LPAR4-negative cells with growth advantage in the presence of stress.
Representative images for three biological experiments for Colo-357 cells grown on uncoated plate or on plate coated with extracellular matrix deposited by 79E + EV or 79E + R4 cells in serum-free media at day 1, day 2, day 7, and day 12. Scale bar = 50 µM. Yellow color circled areas show representative cell colony.
Extended Data Fig. 8 Validation of LPAR4 antibody for immunohistochemistry application.
Representative LPAR4 immunohistochemistry staining for orthotopic xenograft tumors from 79E + EV (n = 3 biologically independent samples) and 79E + R4 (n = 3 biologically independent samples).
Supplementary information
Supplementary Information
Supplementary figure demonstrating flow cytometry gating strategy for mitoSOX staining.
Supplementary Table
Four tables for the main text and the other two tables for information on vectors, siRNA, shRNA, qPCR primers and so on.
Source data
Source Data Fig. 1
Statistical source data.
Source Data Fig. 1
Unprocessed western blots.
Source Data Fig. 2
Statistical source data.
Source Data Fig. 3
Statistical source data.
Source Data Fig. 3
Unprocessed western blots.
Source Data Fig. 4
Statistical source data.
Source Data Fig. 5
Statistical source data.
Source Data Fig. 5
Unprocessed western blots.
Source Data Fig. 6
Statistical source data.
Source Data Fig. 6
Unprocessed western blots.
Source Data Fig. 7
Statistical source data.
Source Data Extended Data Fig. 1
Statistical source data.
Source Data Extended Data Fig. 2
Statistical source data.
Source Data Extended Data Fig. 3
Statistical source data.
Source Data Extended Data Fig. 3
Unprocessed western blots.
Source Data Extended Data Fig. 4
Statistical source data.
Source Data Extended Data Fig. 5
Statistical source data.
Source Data Extended Data Fig. 6
Statistical source data.
Source Data Extended Data Fig. 6
Unprocessed western blots.
Rights and permissions
Springer Nature or its licensor (e.g. a society or other partner) holds exclusive rights to this article under a publishing agreement with the author(s) or other rightsholder(s); author self-archiving of the accepted manuscript version of this article is solely governed by the terms of such publishing agreement and applicable law.
About this article

Cite this article
Wu, C., Rakhshandehroo, T., Wettersten, H.I. et al. Pancreatic cancer cells upregulate LPAR4 in response to isolation stress to promote an ECM-enriched niche and support tumour initiation. Nat Cell Biol 25, 309–322 (2023). https://doi.org/10.1038/s41556-022-01055-y
Received:
Accepted:
Published:
Issue Date:
DOI: https://doi.org/10.1038/s41556-022-01055-y
- Springer Nature Limited
This article is cited by
-
LPAR4 establishes a tumour-initiating niche
Nature Cell Biology (2023)