

Abstract
Single-cell ATAC-seq (scATAC-seq) profiles the chromatin accessibility landscape at single cell level, thus revealing cell-to-cell variability in gene regulation. However, the high dimensionality and sparsity of scATAC-seq data often complicate the analysis. Here, we introduce a method for analyzing scATAC-seq data, called Single-Cell ATAC-seq analysis via Latent feature Extraction (SCALE). SCALE combines a deep generative framework and a probabilistic Gaussian Mixture Model to learn latent features that accurately characterize scATAC-seq data. We validate SCALE on datasets generated on different platforms with different protocols, and having different overall data qualities. SCALE substantially outperforms the other tools in all aspects of scATAC-seq data analysis, including visualization, clustering, and denoising and imputation. Importantly, SCALE also generates interpretable features that directly link to cell populations, and can potentially reveal batch effects in scATAC-seq experiments.
Introduction
Accessible regions within chromatin often contain important genomic elements for transcription factor binding and gene regulation1. Assay for Transposase-Accessible Chromatin using sequencing (ATAC-seq) is an efficient method to probe genome-wide open chromatin sites, using the Tn5 transposase to tag them with sequencing adapters2. In particular, single-cell ATAC-seq (scATAC-seq) reveals chromatin-accessibility variations at the single-cell level, and can be used to uncover the mechanisms regulating cell-to-cell heterogeneity3,4. However, in an scATAC-seq experiment, each open chromatin site of a diploid-genome single cell only has one or two opportunities to be captured. Normally, only a few thousand distinct reads (versus many thousands of possible open positions) are obtained per cell, thus resulting in many bona fide open chromatin sites of the cell that lack sequencing data signals (i.e., peaks). The analysis of scATAC-seq data hence suffers from the curse of “missingness” in addition to high dimensionality3.
Many computational approaches have been designed to tackle high-dimensional and sparse genomic sequencing data, especially single-cell RNA-seq (scRNA-Seq) data. Dimensionality reduction techniques such as principal component analysis (PCA)5 and t-distributed stochastic neighbor embedding (t-SNE)6 are frequently employed to map raw data into a lower dimensional space, which is particularly useful for visual inspecting the distribution of input data. Clustering based on the full expression spectrum or extracted features can be performed to identify specific cell types and states, as well as gene sets that share common biological functions7,8,9,10. The imputation of missing expression values is also often carried out to mitigate the loss of information caused by dropouts in scRNA-seq data11,12.
Direct applications of these scRNA-seq analysis methods to scATAC-seq data, however, may not be suitable due to the close-to-binary nature and increased sparsity of the data (Supplementary Fig. 1). A recent method specifically developed for scATAC-seq data analysis, chromVAR13, evaluates groups of peaks that share the same motifs or functional annotations together. Another method, scABC, weighs cells by sequencing depth and applies weighted K-medoid clustering to reduce the impact of missing values14. To refine the clustering, it then calculates a landmark for each cluster and assigns cells to the closest landmarks based on the Spearman correlation. However, each method suffers notable caveats: chromVAR only analyzes peaks in groups and lacks the resolution of individual peaks, whereas scABC heavily depends on landmark samples with high sequencing depths, and the Spearman rank can be ill-defined for data with many missing values (in particular for scATAC-seq data). Recently a newly developed method called cisTopic applied latent Dirichlet allocation to model on scATAC-seq data to identify cis-regulatory topics and simultaneously cluster cells and accessible regions based on the cell-topic and region-topic distributions15.
Expressive deep generative models have emerged as a powerful framework to model the distribution of high-dimensional data. One of the most popular of such methods, the variational autoencoder (VAE), estimates the data distribution and learns a latent distribution from the observed data through a recognition model (encoder) and a generative model (decoder)26. The Leukemia dataset is derived from a mixture of monocytes (Mono) and lymphoid-primed multipotent progenitors (LMPP) isolated from a healthy human donor, and leukemia stem cells (SU070_LSC, SU353_LSC) and blast cells (SU070_Leuk, SU353_Blast) isolated from two patients with acute myeloid leukemia24. The GM12878/HEK293T dataset and the GM12878/HL-60 dataset are respective mixtures of two commonly-used cell lines22. The InSilico dataset is an in silico mixture constructed by computationally combining six individual scATAC-seq experiments that were separately performed on a different cell line3,11. Note that these four datasets were the same ones used to validate scABC14. The more recent Splenocyte dataset25 is derived from a mixture of mouse splenocytes (after red blood cell removal) and the Forebrain dataset26 is derived from P56 mouse forebrain cells. The six datasets cover scATAC-seq data generated from both microfluidics-based and cellular indexing platforms, and the distributions of the number of peaks in each single cell vary substantially in different datasets (Supplementary Fig. 1). However, they always have a high level of data sparsity compared to the aggregation of peaks from all single cells in each dataset (Supplementary Table. 2).
SCALE identifies cell types by clustering on latent features
We examined SCALE’s ability to uncover features that characterize scATAC-seq data distributions. By default, SCALE extracts 10 features from the input data. For comparison, we also applied PCA, scVI and cisTopic to reduce the input data to 10 dimensions. In the comparison, we also included Cicero27, a scATAC-seq data analysis tool for predicting cis-regulatory interactions and building single-cell trajectories from scATAC-seq data, and TF-IDF a transformation for performing dimension reduction and clustering28. We then visualized the extracted features from these tools as well as the raw data with t-SNE. In general, the feature embeddings of SCALE and cisTopic were better separated between cell types, whereas the embeddings of PCA, scVI, Cicero, TF-IDF and the raw data overlapped between some cell types (Fig. 2a, Supplementary Fig. 2).
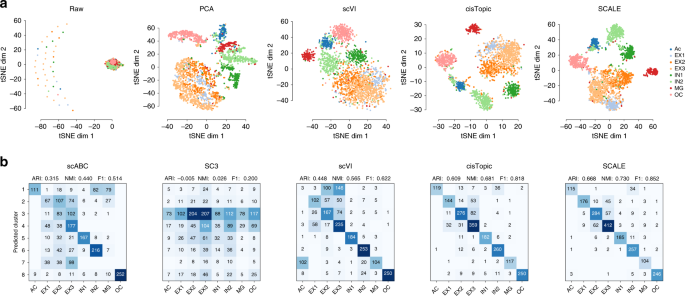
Feature embedding and clustering. a t-SNE visualization of the raw data and the extracted features from PCA, scVI, cisTopic, and SCALE of the Forebrain dataset. For comparison, SCALE, PCA, and scVI all performed dimension reduction to ten dimensions before applying t-SNE while the raw data were directly visualized with t-SNE. b Clustering accuracy was evaluated by confusion matrices between cluster assignments predicted by scABC, SC3, scVI, cisTopic and SCALE, and reference cell types. For scABC and SC3, the cluster assignments were directly obtained from the output of the tools; for SCALE and scVI, we applied the K-means clustering on the extracted features to get cluster assignments. The Adjusted Rand Index (ARI), the Normalized Mutual Information (NMI), and the F1 scores are shown on the top
SCALE can also reveal the distance between different cell subpopulations and sometimes suggested their developmental trajectory in UMAP visualization5d). Thus, introducing GMM as the prior to restrict the data structure provides SCALE with greater power for fitting sparse data than regular VAE using single Gaussian as the prior.
Finally, we tested whether SCALE is robust with respect to data sparsity by randomly drop** scATAC-seq values in the raw datasets down to zero. We compared the clustering accuracy of SCALE and other tools at different drop** rates (10–90%), measured by the adjusted Rand Index (ARI), Normalized Mutual Information (NMI) and micro F1 score (Methods). We found that SCALE displayed only a moderate decrease in clustering accuracy with increased data corruption until at about the corruption level of 0.6, and was robust for all datasets (Supplementary Fig. 6). In general, scABC, SC3, and scVI also showed robustness to data corruption; however, the overall clustering accuracies were much lower on some datasets (e.g., SC3 failed on the Forebrain dataset and scVI failed on the GM12878/HEK293T and the GM12878/HL-60 datasets). On the Forebrain dataset, the ARI scores of SCALE dropped from 0.668 using the raw data to 0.448 on using the data with 30% corruption, and scABC and scVI dropped from 0.315 to 0.222 and from 0.448 to 0.388, respectively.
Finally we also provide a method to help users choose the optimal number of clusters based on the Tracy-Widom distribution34 (Methods), which could often produce an estimate of the number of clusters close to that of the references (Supplementary Fig. 7) and generate clustering results similar to the reference sets (Supplementary Fig. 7).
SCALE reduces noise and recovers missing peaks
An important feature of SCALE is the ability to accurately estimate the real distribution of scATAC-seq data, which usually contains both noise and a large number of missing values. The estimate could be used to remove noise and restore missing data (Fig. 1). We evaluated the calibration efficiency of SCALE on both real and simulated datasets. Since no such tool is currently available for scATAC-seq data, we compared SCALE with scImpute, SAVER, MAGIC, and scVI, four state-of-the-art scRNA-seq imputation methods (Fig. 3a).

Data denoising and imputation efficiency on simulation and real datasets. a Comparison of the cell-wise correlations of the raw data and the calibrated data with the meta-cell of each cell type on the Forebrain dataset. b t-SNE embedding of 105 significant motifs profile identified by chromVAR (Benjamini-Hochberg corrected Chi-square test p_value_adj of variability <0.05), and embeddings of motifs Mafb, Hoxd9, Dlx2, Lhx8, Arx, and Neurog1 colored by deviation scores
We first evaluated the ability of SCALE to remove noise and to recover missing values on real scATAC-seq datasets. A challenge of analyzing real data is that the ground truth data without any corruption is unknown. However, if we average all single cells of the same biological cell type, the resulted meta-cell will be a good approximate to those single cells. SCALE performed better than all scRNA-seq imputation methods in all scATAC-seq datasets, in that it achieved the highest correlation of the single cells with the corresponding meta-cell for each cell type (Fig. 3a, Supplementary Fig. 8), indicating that it obtained a better estimate of the real scATAC-seq data distribution. For most cases, scImpute was very stable and among the best comparing with other scRNA-seq imputation methods, and SAVER performed well on denser datasets (InSilico, Splenocyte) but deteriorated on sparser datasets. MAGIC and scVI might have underfit the sparse input data and the imputed data substantially deviated from it (Supplementary Fig. 9), which may reflect that the two powerful tools that are optimized to scRNA-seq data imputation may not fit for scATAC-seq data analysis.
It is important to note that the data calibration of SCALE was obtained at the same time of data modeling and clustering, i.e., without knowing the original type of each cell. So it could not simply average all single cells of the same cell type to reconstruct the peak so that they resemble the reference meta-cell. Also importantly, SCALE achieved a high correlation with the meta-cells while maintaining a similar level of variation within each cell population (see the variation of correlation coefficients in Fig. 3a and Supplementary Fig. 8). Indeed, SCALE retained the original data structure (intra-correlation within the imputed data) and recovered the original peak profiles (inter-correlation with the raw data) in the process of data regularization by GMM (Supplementary Fig. 9).
The imputation of SCALE could strengthen the distinct patterns of cluster-specific peaks by filling missing values and removing potential noise (Supplementary Fig. 10), which improves downstream analysis, for example the identification of cell-type-specific motifs and transcription factors by chromVAR. We demonstrated this feature with the Forebrain dataset. We first followed the method used by Cusanovich et. al. to identify differentially accessible sites with the “binomialff” test of Monocle 2 package28. At 1% FDR threshold, we identified 4100 differential accessible sites across the eight reference clusters of the Forebrain dataset. We then used chromVAR to search for motifs enriched in the differential sites in the raw and the imputed data, respectively. Overall, the patterns of different cell types are more distinct for these differentially accessible sites in the imputed than in the raw data (Supplementary Fig. 11a). And embedding on the imputed data shows better-defined clusters (each well corresponds to a subtype with biological definition) than on the raw data (Fig. 3b, Supplementary Fig. 11b).
We found that the imputed data can greatly improve the results of chromVAR analysis by identifying more motifs (increased from 52 motifs to 105). For example, chromVAR analysis on the imputed data, but not on the raw data, identified the motifs Mafb and Hoxd9 enriched in the MG (macroglia) cluster (Supplementary Fig. 11c–d). It was recently reported that Mafb contributes to the activation of microglia35. It also identified Hoxd9 enriched in IN (inhibitory neuron) from the imputed but not the raw data. Similarly, we found that Dlx2, Lhx8, Arx, and Neurog1 are much more significantly enriched in the, respectively, clusters in the imputed data (Supplementary Fig. 11c-d). Dlx2, Lhx8, and Arx are important components in the MGE (medial ganglionic eminence) pathway of forebrain development36, and Neurog1 is required for excitatory neurons in the cerebral cortex37.
We then introduced further corruption to the real data by randomly drop** out peaks at different rates (Methods). At all corruption rates, SCALE performed the best, in that the calibrated data most closely correlated with the original meta-cells (Supplementary Fig. 12). We observed similar trends for the other scRNA-seq imputation tools as above, confirming the effectiveness of SCALE in enhancing scATAC-seq data. We further tested the impact of missingness on generative model of imputation by calculating the confusion score (Methods) to evaluate the ability to preserve the original structure (inter and intra-correlation of meta-cells) (Supplementary Fig. 13). We found that the effect was minimal when the corruption level was lower than about 0.5, and after that threshold, the generative model was less capable of preserving the original structure (Supplementary Fig. 13b).
We subsequently tested the calibration accuracy on a simulated dataset. We constructed the dataset by first generating reference scATAC-seq data consisting of three clusters, each containing 100 peaks with no missing values, then randomly drop** out peaks and introducing noise (Methods, Supplementary Fig. 14a). As we knew the ground truth data of each single cell, we could quantify the efficiency of all tools by calculating peak-wise and cell-wise correlations of each calibrated single cell with its original ground truth. At all corruption rates, SCALE recovered the original data most accurately (Supplementary Fig. 14b–c). On the other hand, although scImpute could also recover the missing values in most cases, it messed up two clusters at the 0.2 corruption rate and was unable to remove the noise. SAVER and scVI smoothed both the signal and noise simultaneously and only recovered missing values to some degree. MAGIC performed very well at low corruption rates, but apparently over-smoothed the data and removed true signals along with noise at high levels of data corruption.
SCALE reveals cell types and their specific motifs
Next, we used SCALE to analyze a dataset generated by a recently developed technology, protein-indexed single-cell assay of transposase-accessible chromatin-seq (Pi-ATAC), which uses protein labeling to help define cell identities23. Dissecting complex cell mixtures of in vivo biological samples may be challenging. By simultaneously characterizing protein markers and epigenetic landscapes in the same individual cells, Pi-ATAC provides an effective approach to tackle the problem. The Breast Tumor dataset is derived from a mouse breast tumor sample, including two plates of tumor cells (Epcam+) and another two plates of tumor-infiltrating immune cells (CD45+), isolated by protein labeling and FACS sorting. In the original study, a set of motifs was used to project the Epcam+ and CD45+ -specific chromatin features with t-SNE, and it was difficult to separate these two cell types computationally (Supplementary Fig. 15a). However, we found that SCALE was able to separate the two cell types well, better than PCA and scVI in latent embedding (Fig. 4a). On clustering, SCALE also yielded results the closest to the protein-index labels, better than scVI and scABC, whereas SC3 poorly distinguished the two cell types (Fig. 4b). Although cisTopic grouped the cells well in the embedding, it misclassified parts of CD45+ cells into Epcam+ cells. SCALE thus can reveal cell types within complex tissues based only on scATAC-seq data, with performance comparable to sophisticated experimental technologies like Pi-ATAC.

Application of SCALE on the Breast Tumor dataset from the Pi-ATAC study. a t-SNE visualization of the Breast Tumor raw data, and features extracted by PCA, scVI, and SCALE. b clustering results by scABC, SC3, scVI, cisTopic, and SCALE. c Heatmaps of enriched motifs of different transcription factors across CD45+ cells and Epcam+ cells from the mouse breast tumor sample
We validated the biological significance of the cell clusters based on Pi-ATAC peaks. For each cluster, we calculated the top 1000 peaks with the highest specificity score as type-specific peaks (Methods, Supplementary Fig. 15b). We then used Homer38 to identify transcription factor binding motifs that were enriched in the type-specific peaks. We removed the common motifs enriched in both CD45+ cells and Epcam+ cells, and kept those that were enriched in only one cell type. We found that CD45+ cells were enriched for immune-specific motifs Maz, Pu.1-Irf, Irf8, Runx1, Elk4, Nfy, Elf3, and SpiB binding motifs. These findings are consistent with the role of Runx1 in maintenance of haematopoietic stem cells (HSC) and that knockout of Runx1 results in defective T- and B-lymphocyte development39. Nfy promotes the expression of the crucial immune responsive gene Major Histocompatibility Complex (MHC)40. Epcam+ cells were enriched for tumor-related motifs Klf14, Mitf, Ets1, Nrf2, and Nrf1 binding motifs. Ets1 is frequently overexpressed in breast cancer and associated with invasiveness41, whereas Nrf2 is a key signature for breast cancer cell proliferation and metastasis42 (Fig. 4c). Thus, SCALE analysis of the Breast Tumor data revealed biologically relevant cis-elements for gene regulation.
SCALE disentangles biological cell types and batch effects
In addition to tighter estimates of the multimodal input data, by pushing each dimension to learn a separate Gaussian distribution, GMM has another advantage in that it leads to latent representations that are more structured and disentangled, and thus more interpretable26 is derived from P56 mouse forebrain cells. The Breast Tumor dataset23 is obtained from a mouse breast tumor sample, including two plates of tumor cells (Epcam+) and another two plates of tumor-infiltrating immune cells (CD45+) from protein labeling and FACS sorting.
Preprocessing: Similar to scABC14, we filtered the scATAC-seq count matrix to only keep peaks in10 cells with ≥2 reads for the InSilico dataset, the GM12878/HEK293T dataset, and the GM12878/HL-60 dataset, ≥5 cells with ≥2 reads for the Leukemia dataset, ≥50 cells with ≥2 reads for the Forebrain dataset, and ≥5 cells with ≥1 reads for the Breast Tumor dataset. We kept all the peaks for the Splenocyte dataset. We also only kept cells with read counts ≥(number of filtered peaks/50). For the InSilico dataset, there were still almost 90,000 peaks after filtering. For the efficiency of the SCALE model, similar to SC333, we further removed rare peaks (reads >2 in less than X% of cells) and ubiquitous peaks (reads ≥1 in at least (100–X)% of cells).
The probabilistic model of SCALE
SCALE combines a variational autoencoder (VAE) and the Gaussian Mixture Model (GMM) to model the input scATAC-seq data x through a generative process. Given K clusters, corresponding latent variable z can be obtained through the encoder via the reparameterization then to generate sample x through the decoder. It can be modeled with a joint distribution \(p\left( {{\mathbf{x}},{\mathbf{z}},c} \right)\), where z is the latent variable and c is a categorical variable whose probability is Discrete (c|π) where \({\mathrm{P}}\left( {{\mathrm{C}} = {\mathrm{j}}} \right) = \pi _j,\pi \in {\Bbb R}^K\). p(z|c) is mixture of Gaussians distribution parameterized by μc and σc conditioned on c. Given that x and c are independently conditioned on z, then joint probability p(x, z, c) can be factorized as:
We define each factorized probability as:
The training SCALE is to maximize the log-likelihood of the observed scATAC-seq data:
which can be transformed to maximize the evidence lower bound (ELBO). The ELBO can be written with a reconstruction term and a regularization term:
The reconstruction term encourages the imputed data to be similar to the input data. The regularization term is a Kullback-Leibeler divergence, which regularizes the latent variable z to a GMM manifold. And q(z, c|x) and p(x|z) are an encoder and a decoder, respectively, which can be modeled by two neural networks.
The overall network architecture of SCALE
SCALE consists of an encoder and a decoder. The encoder is a four-layer neural network (3200–1600–800–400) with the ReLU activation function. The decoder has no hidden layer but directly connects the ten latent variables (features) to the output layer (peaks) with the Sigmoid activation function. A GMM model is used to initialize the parameters μc and σc. The Adam optimizerVisualization We used t-SNE from the Python “scikit-learn” package to project the raw data or latent features to 2-dimension with random state as 124. We used Python package “umap” to visualize the trajectory cell relationships. We used the K-means clustering method from the Python “scikit-learn” package to cluster the input single cells based on the extracted features. To repeat the result, we set the random seed to 18. Adjusted Rand Index: The Rand Index (RI) computes similarity score between two clustering assignments by considering matched and unmatched assignments pairs independently of the number of clusters. The Adjusted Rand Index (ARI) score is calculated by “adjust for chance” with RI by: If given the contingency table, the ARI can also be represented by: The ARI score is 0 for random labeling and 1 for perfectly matching. Normalized mutual information: where P, T are empirical categorical distributions for the predicted and real clustering, I is the mutual entropy, and H is the Shannon entropy. F1 score: A simulation dataset consisting of 300 cells and 1000 peaks was generated. The peaks formed three clusters, with each cluster containing 100 specific peaks. These specific peaks had a value of 1 or 2 (ratio 1:4) in the cells of the corresponding clusters, and 0 in other cells. Corrupted datasets were generated by randomly drop** out values at different rates from 0.1 to 0.8, followed by introducing random noise by setting values as 1 or 2 (ratio 1:4) with the probability of 0.1. We followed Cusanovich et al. 28 and used “binomiallf” test implemented in Monocle 2 package44 to identify differentially accessible peaks. We set a 1% FDR threshold (Benjamini-Hochberg method) to decide the peaks were significant for each cluster. We applied an entropy-based measure to calculate a cluster specificity score for the association of each peak with each cluster. In detail, it is defined by comparing the distribution of the peak pattern with the predefined ideal cluster-specific pattern in which a peak only appears in one cluster: while p is the distribution of observed peaks overall samples, and q is the distribution of predefined pattern for the cluster c, where \({\mathrm{Div}}_{{\mathrm{jensen}}}(p,q)\) is the Jensen divergence distance: where \(H\left( p \right)\) is the entropy of peak’s distribution: This provides the peak-cluster matrix, and the final cluster specificity score is the maximal score overall clusters. By default, we defined the top 200 peaks as the cluster-specific peaks, which were used in the downstream analysis. We transformed the float imputed values to binary ones as below: where imputed is the imputation matrix, raw is the raw data matrix, i means the ith peak, j means the jth cell. We first calculated the inter/intra-correlation matrix, then transformed the diagonal values of the correlation matrix to: Then calculated the mean of the upper triangle of the correlation matrix as the confusion matrix: A confusion score of “0” means a perfect preservation of the original population. In SCALE, as each feature is directly connected with output peaks, the feature-peak association can be assessed by the weights of links. We approximate the distribution of the weights as a Gaussian distribution, and defined those peaks with weights most deviated from the mean as feature-associated peaks. By default, we set 2.5 standard deviations from the mean as the cutoff. We applied findMotifsGenomes.pl from the software Homer with default parameters on the top 1000 specific peaks of the CD45+ and the Epcam+ corresponding single-cell clusters, respectively, to search for transcription factor binding motifs. We only considered the motif occurrences with binomial test P-value ≤ 0.001. We used the GREAT45 algorithm (version 3.0.0) to perform the gene enrichment analysis by including genomic regions of a basal plus an extension (1 kb upstream and 0.1 kb downstream with up to 500-kb max extension) in the search for elements enriched with the GO ‘biological process’ terms. We used the number of the eigenvalues of XTX that are significantly different as the predicted k, where X is the count matrix. We followed SC3 and calculated the mean and the s.d. of the Tracy-Widom distribution to determine the threshold: Where n is the number of peaks and p is the number of cells. Further information on research design is available in the Nature Research Reporting Summary linked to this article.Clustering
Evaluation of clustering results
Generation and corruption of the simulation dataset
Identifying differentially accessible sites
Calculation of the cluster specificity score of a peak
Binarization
Confusion score
Features associated peaks
Discovery of enriched TFs
Annotation of genomic elements
Prediction of a suitable number of cluster k
Reporting summary
Data availability
The scATAC-seq in silico mixture data are available in Gene Expression Omnibus (GEO) under accession number GSE65360. Single-cell data for leukemia mixture is available at GSE74310, GM12878/HEK293T and GM12878/HL-60 mixtures can be found at GSE68103, Pi-ATAC Breast Tumor data can be obtained at GSE112091. Splenocyte mixture can be accessed at ArrayExpress with accession number E-MTAB-6714 and Forebrain mixture can be accessed at GSE100033. The mouse atlas dataset is available at http://atlas.gs.washington.edu/mouse-atac. All other relevant data supporting the key findings of this study are available within the article and its Supplementary Information files or from the corresponding author upon reasonable request. A reporting summary for this Article is available as a Supplementary Information file.
Code availability
The SCALE software including documents and tutorial is available on Github (https://github.com/jsxlei/SCALE).
References
Tsompana, M. & Buck, M. J. Chromatin accessibility: a window into the genome. Epigenetics Chromatin 7, 33 (2014).
Buenrostro, J. D., Giresi, P. G., Zaba, L. C., Chang, H. Y. & Greenleaf, W. J. Transposition of native chromatin for fast and sensitive epigenomic profiling of open chromatin, DNA-binding proteins and nucleosome position. Nat. Methods 10, 1213–1218 (2013).
Buenrostro, J. D. et al. Single-cell chromatin accessibility reveals principles of regulatory variation. Nature 523, 486–490 (2015).
Cusanovich, D. A. et al. Multiplex single cell profiling of chromatin accessibility by combinatorial cellular indexing. Science 348, 910–914 (2015).
Abdi, H. & Williams, L. J. Principal component analysis. WIREs Comput. Stat. 2, 433–459 (2010).
van der Maaten, L. & Hinton, G. Visualizing Data using t-SNE. J. Mach. Learn. Res. 9, 2579–2605 (2008).
Menon, V. Clustering single cells: a review of approaches on high-and low-depth single-cell RNA-seq data. Brief Funct. Genomics, https://doi.org/10.1093/bfgp/elx044 (2017).
Macosko, E. Z. et al. Highly parallel genome-wide expression profiling of individual cells using nanoliter droplets. Cell 161, 1202–1214 (2015).
Shekhar, K. et al. Comprehensive classification of retinal bipolar neurons by single-cell transcriptomics. Cell 166, 1308–1323 e1330 (2016).
Tasic, B. et al. Adult mouse cortical cell taxonomy revealed by single cell transcriptomics. Nat. Neurosci. 19, 335–346 (2016).
Li, W. V. & Li, J. J. An accurate and robust imputation method scImpute for single-cell RNA-seq data. Nat. Commun. 9, 997 (2018).
Huang, M. et al. SAVER: gene expression recovery for single-cell RNA sequencing. Nat. Methods 15, 539–542 (2018).
Schep, A. N., Wu, B., Buenrostro, J. D. & Greenleaf, W. J. chromVAR: inferring transcription-factor-associated accessibility from single-cell epigenomic data. Nat. Methods 14, 975–978 (2017).
Zamanighomi, M. et al. Unsupervised clustering and epigenetic classification of single cells. Nat. Commun. 9, 2410 (2018).
Bravo Gonzalez-Blas, C. et al. cisTopic: cis-regulatory topic modeling on single-cell ATAC-seq data. Nat. Methods 16, 397–400 (2019).
Kingma, D. P. & Welling, M. Auto-encoding variational bayes. ar**v:1312.6114 (2013).
**e, J., Girshick, R. & Farhadi, A. Unsupervised deep embedding for clustering analysis. ar**v:1511.06335 (2015).
Lopez, R., Regier, J., Cole, M. B., Jordan, M. I. & Yosef, N. Deep generative modeling for single-cell transcriptomics. Nat. Methods 15, 1053–1058 (2018).
Krishnan, R. G., Liang, D. & Hoffman, M. On the challenges of learning with inference networks on sparse, high-dimensional data. ar**v:1710.06085 (2017).
Jiang, Z., Zheng, Y., Tan, H., Tang, B. & Zhou, H. Variational deep embedding: an unsupervised and generative approach to clustering. ar**v:1611.05148 (2016).
Dilokthanakul, N. et al. Deep unsupervised clustering with gaussian mixture variational autoencoders. ar**v:1611.02648v2 (2016).
Grønbech, C. H. et al. scVAE: Variational auto-encoders for single-cell gene expression data. bioRxiv (2018).
Chen, X. et al. Joint single-cell DNA accessibility and protein epitope profiling reveals environmental regulation of epigenomic heterogeneity. Nat. Commun. 9, 4590 (2018).
Corces, M. R. et al. Lineage-specific and single-cell chromatin accessibility charts human hematopoiesis and leukemia evolution. Nat. Genet. 48, 1193–1203 (2016).
Chen, X., Miragaia, R. J., Natarajan, K. N. & Teichmann, S. A. A rapid and robust method for single cell chromatin accessibility profiling. Nat. Commun. 9, 5345 (2018).
Preissl, S. et al. Single-nucleus analysis of accessible chromatin in develo** mouse forebrain reveals cell-type-specific transcriptional regulation. Nat. Neurosci. 21, 432–439 (2018).
Pliner, H. A. et al. Cicero predicts cis-regulatory DNA interactions from single-cell chromatin accessibility data. Mol. Cell, https://doi.org/10.1016/j.molcel.2018.06.044 (2018).
Cusanovich, D. A. et al. A single-cell atlas of in vivo mammalian chromatin accessibility. Cell, https://doi.org/10.1016/j.cell.2018.06.052 (2018).
McInnes, L., Healy, J. & Melville, J. UMAP: Uniform manifold approximation and projection for dimension reduction. ar**v:1802.03426 (2018).
Goardon, N. et al. Coexistence of LMPP-like and GMP-like leukemia stem cells in acute myeloid leukemia. Cancer Cell. 19, 138–152 (2011).
Bennett, J. M. et al. Proposals for the classification of the acute leukaemias. French-American-British (FAB) co-operative group. Br. J. Haematol. 33, 451–458 (1976).
van’t Veer, M. B. The diagnosis of acute leukemia with undifferentiated or minimally differentiated blasts. Ann. Hematol. 64, 161–165 (1992).
Kiselev, V. Y. et al. SC3: consensus clustering of single-cell RNA-seq data. Nat. Methods 14, 483–486 (2017).
Patterson, N., Price, A. L. & Reich, D. Population Structure and Eigenanalysis. PLoS. Genet. 2, e190 (2006).
Tozaki-Saitoh, H. et al. Transcription factor MafB contributes to the activation of spinal microglia underlying neuropathic pain development. Glia 67, 729–740 (2019).
Nord, A. S., Pattabiraman, K., Visel, A. & Rubenstein, J. L. R. Genomic perspectives of transcriptional regulation in forebrain development. Neuron 85, 27–47 (2015).
Kim, E. J. et al. Spatiotemporal fate map of neurogenin1 (Neurog1) lineages in the mouse central nervous system. J. Comp. Neurol. 519, 1355–1370 (2011).
Heinz, S. et al. Simple combinations of lineage-determining transcription factors prime cis-regulatory elements required for macrophage and B cell identities. Mol. Cell 38, 576–589 (2010).
Voon, D. C., Hor, Y. T. & Ito, Y. The RUNX complex: reaching beyond haematopoiesis into immunity. Immunology 146, 523–536 (2015).
Sachini, N. & Papamatheakis, J. NF-Y and the immune response: dissecting the complex regulation of MHC genes. Biochim. Biophys. Acta Gene Regul. Mech. 1860, 537–542 (2017).
Furlan, A. et al. Ets-1 controls breast cancer cell balance between invasion and growth. Int. J. Cancer 135, 2317–2328 (2014).
Zhang, C. et al. NRF2 promotes breast cancer cell proliferation and metastasis by increasing RhoA/ROCK pathway signal transduction. Oncotarget 7, 73593–73606 (2016).
Kingma, D. P. & Ba, J. Adam: A Method for Stochastic Optimization. ar**v:1412.6980 (2014).
Qiu, X. et al. Reversed graph embedding resolves complex single-cell trajectories. Nat. Methods 14, 979–982 (2017).
McLean, C. Y. et al. GREAT improves functional interpretation of cis-regulatory regions. Nat. Biotechnol. 28, 495–501 (2010).
Acknowledgements
We thank **nqi Chen for insightful comments on the manuscript and the help with the investigation of the Breast Tumor dataset. We thank Jianbin Wang for helpful suggestions. We thank Mahdi Zamanighomi and Timothy Daley for kindly providing the InSilico and the Leukemia datasets used in the scABC paper. We thank Rongxin Fang for the cell-type labels of the Forebrain dataset in their original paper. We thank Life Science Editors for editing assistance. This project is supported by the Chinese Ministry of Science and Technology (Grant No. 2018YFA0107603 to Q.C.Z.) and the National Natural Science Foundation of China (Grants No. 91740204, 31761163007, and 31621063 to Q.C.Z.), the Bei**g Advanced Innovation Center for Structural Biology, the Tsinghua-Peking Joint Center for Life Sciences and the National Thousand Young Talents Program of China to Q.C.Z.
Author information
Authors and Affiliations
Contributions
Q.C.Z. conceived and supervised the project. L.X. designed, implemented, and validated SCALE with the help from K.X., K.T. and Y.S., L.T., G.G., M.Z. and T.J. helped analyzing the data, L.X. and Q.C.Z. wrote the manuscript with inputs from all the authors.
Corresponding author
Ethics declarations
Competing interests
The authors declare no competing interests.
Additional information
Peer review information Nature Communications thanks Syed Murtuza Baker, Ole Winther and the other, anonymous, reviewer(s) for their contribution to the peer review of this work. Peer reviewer reports are available.
Publisher’s note Springer Nature remains neutral with regard to jurisdictional claims in published maps and institutional affiliations.
Supplementary information
Rights and permissions
Open Access This article is licensed under a Creative Commons Attribution 4.0 International License, which permits use, sharing, adaptation, distribution and reproduction in any medium or format, as long as you give appropriate credit to the original author(s) and the source, provide a link to the Creative Commons license, and indicate if changes were made. The images or other third party material in this article are included in the article’s Creative Commons license, unless indicated otherwise in a credit line to the material. If material is not included in the article’s Creative Commons license and your intended use is not permitted by statutory regulation or exceeds the permitted use, you will need to obtain permission directly from the copyright holder. To view a copy of this license, visit http://creativecommons.org/licenses/by/4.0/.
About this article

Cite this article
**ong, L., Xu, K., Tian, K. et al. SCALE method for single-cell ATAC-seq analysis via latent feature extraction. Nat Commun 10, 4576 (2019). https://doi.org/10.1038/s41467-019-12630-7
Received:
Accepted:
Published:
DOI: https://doi.org/10.1038/s41467-019-12630-7
- Springer Nature Limited
This article is cited by
-
A fast, scalable and versatile tool for analysis of single-cell omics data
Nature Methods (2024)
-
Uniform quantification of single-nucleus ATAC-seq data with Paired-Insertion Counting (PIC) and a model-based insertion rate estimator
Nature Methods (2024)
-
Discrete latent embeddings illuminate cellular diversity in single-cell epigenomics
Nature Computational Science (2024)
-
Deciphering cell types by integrating scATAC-seq data with genome sequences
Nature Computational Science (2024)
-
Modeling fragment counts improves single-cell ATAC-seq analysis
Nature Methods (2024)