
Abstract
We use weekly changes in the size of the Federal Reserve’s balance sheet as a policy tool that has largely been ignored in the literature to investigate the relationship between the unconventional monetary policy and stock market returns when the federal funds rate reaches the zero lower bound. Our empirical framework is based on a structural VAR that is identified using heteroscedasticity in weekly data on the components of the Fed’s balance sheet. We find evidence that the unconventional expansionary monetary policy is effective in stimulating the stock market, as it has positive and statistically significant effects on stock returns. In extending our analysis to disaggregate returns, our findings suggest heterogenous and asymmetric responses of disaggregate returns to an unconventional policy shock.
1 Introduction
The conventional approach to monetary policy is mainly based on the new Keynesian model and is expressed in terms of the interest rate on overnight loans between banks. However, in the aftermath of the financial crisis, the federal funds rate has hardly moved at all until the end of 2016 and the Fed primarily focused on its balance sheet, using quantitative measures of monetary policy. After implementing several rounds of large scale asset purchase programs, known as “quantitative easing”, the Fed officially ended it on October, 2014 and the federal funds rate gradually started to move out of the zero lower bound since late 2016. Still, the Fed had to occasionally rely on its balance sheet approach to conduct monetary policy. For example, in anticipation of a shortfall of reserves for commercial banks in September, 2019, which pushed the repo rate higher, the Fed aggressively engaged again in purchasing short-term bills in order to supply additional reserves in the market. Moreover, the recent global pandemic on Covid-19 outbreak that resulted in widespread disruptions in the US economy forced the Fed to set the short-term interest rate at bottom low and caused its balance sheet to swell again, due to a new round of purchases of corporate bonds and other financial assets. This discontinuous but explosive growth in the size of the Fed’s balance sheet over more than a decade suggests that the Fed sometimes relies more heavily on its unconventional monetary policy tool than the conventional one.
A number of papers have already discussed the Fed’s unconventional monetary policy and its impact on the economy. C’urdia and Woodford (2011) extended a basic new Keynesian model to include conventional as well as unconventional dimensions of monetary policy that depend on the various components of the Fed’s balance sheet. They concluded that quantitative easing is not in particular a better option in stabilizing the economy when compared to the interest rate targeting, but targeted purchases of assets by the Fed in an effort to lend money to the private sector produces some positive outcomes in case of financial market meltdown.
Several papers also examined the macroeconomic effects of the Fed’s unconventional monetary policy using different forms of vector autoregression (VAR) approach. Gambacorta et al (2014), for example, estimated a panel VAR to calculate the effects of unconventional monetary policies on economic activities in eight advanced economies. Their empirical specification includes country level monthly data on GDP, consumer price index, central bank assets, and stock market volatility index for the period 2008-2011. They identify monetary policy shocks by imposing zero and sign restrictions on the elements of the contemporaneous matrix and find positive effects of expansionary monetary policy on output, which is quantitatively similar to those reported before in case of conventional policy. In a similar paper, Bhattarai et al (2021) used monthly Bayesian panel VAR to estimate the cross country effects of the Fed’s quantitative easing program. In estimating these effects, Bhattarai et al (2021) estimated the QE shocks using non-recursive identification restrictions that allow for contemporaneous response of the monetary policy instrument to the long-term interest rate, but restricted the contemporaneous interaction of the monetary policy with other economic variables including the stock price index. Their empirical findings suggest significant effects of the Fed’s quantitative Easing on key macroeconomic variables in both US and those in emerging economies. In a recent paper, Liu et al (2019) used a change-point VAR model to simulate a counterfactual experiment on the effects of the Fed’s unconventional monetary policy and reported that this policy helps to boost economic activities in the US. The model is estimated using restrictions from a general equilibrium model to identify shocks to monetary policy using monthly data.
In this paper, we move the empirical literature forward by investigating the relationship between the unconventional monetary policy and the stock market in the US, using an empirical approach that follows Rigobon and Sack (2003) and Wright (2012) to identify the Fed’s balance sheet shock through heteroscedasticity of a high frequency dataset. In doing so, we consider an unexpected change in the size of the Fed’s balance sheet as a monetary policy shock (or a balance sheet shock). Total assets indicate the size of the balance sheet. Therefore, the shock originates from the Fed’s aggressive purchases of assets, and the changes in total reserves on the liabilities side of the Fed’s balance sheet are the result of asset purchases, making the size of the balance sheet as an effective policy instrument for the Fed when there is no room for any further adjustments in the federal funds rate. There is precedence for using the component of the Fed’s balance sheet to measure exogenous monetary policy shock — see, for example, Christiano et al (1996) who consider non-borrowed reserves an alternative instrument of monetary policy.
In order to provide some preliminary evidence in favour of our empirical model to investigate the Fed’s balance sheet shock on stock returns, we plot in Fig. 1 the rolling standard deviation of weekly changes in the Fed’s total assets for the period 2008-2020. As the Figure shows, there are clearly some episodes of high and low volatility in the changes of the size of the balance sheet indicating two periods of volatility that could be used to identify the model.
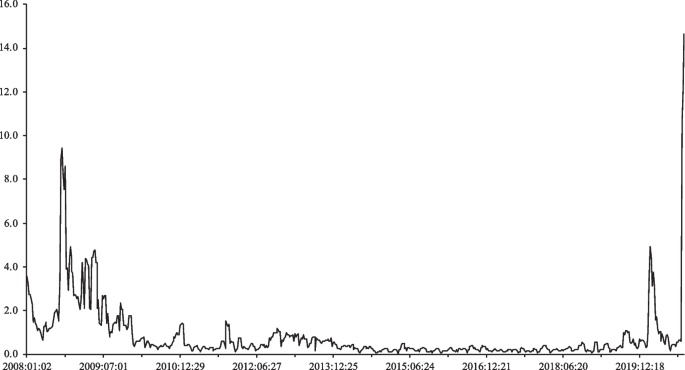
Volatility in the size of the Fedral Reserve’s balance sheet
Our modelling framework allows us to investigate the relationship between the Fed’s balance sheet approach of monetary policy and the stock market, after incorporating the rapidly changing information content of the high frequency dataset. We understand that there remains to be a separation between the announcement and the implementation of the policy regarding changes in the size of the Fed’s balance sheet. The forward looking market participants react right after the Fed’s intention about these changes, as they know that the Fed is committed to adhere to the announced policy. However, as shown in Kuttner (2001), markets may adjust overtime to the unexpected component of the announced policy that may not be priced into the market right after the announcement. In this sense, our methodology is able to capture some announcement effects on weekly basis, but completely capture the impact on the financial market during and after the implementation of the Fed’s announced policy.
Our empirical estimates are primarily based on bivariate structural VAR models, using weekly data on the size of the Fed’s balance sheet and different types of US stock market returns that include aggregate and disaggregate returns. These estimates clearly suggest that the Fed’s unconventional and expansionary monetary policy, in general, has positive and statistically significant effects on stock market returns. A one standard deviation shock to the size of the Fed’s balance sheet leads to a cumulative increase of 0.3% in stock returns in the first four weeks after the shock. This estimate reflects the flow effects of the balance sheet shock on stock market, as we are using weekly changes in total assets and stock prices, in contrast to the stock effect that is primarily based on changes in the variables in discrete time periods.
We extend our analysis to include disaggregate data on a set of group and industry returns to support our main findings. The responses of industry returns due to the Fed’s unconventional policy shock reasonably align with those of aggregate returns. We, however, observe considerable evidence of heterogeneity in these responses based on the nature of the industry and it’s relation to the business cycle. On the other hand, although group returns respond in a positive way to the Fed’s balance sheet shock supporting our main empirical results, we identify asymmetries in these responses. In a pairwise comparison of the effects of the shock on the returns of six different groups, we find that the Fed’s unconventional monetary policy has larger effects on the returns of the firms that are small in size, earn low profit, and maintain a high BE/ME ratio. There are also asymmetric responses of group returns based on high dividend yield and growth index compared to those based on earnings yield and value index, respectively.
The paper makes a contribution to the literature on the relationship between the Fed’s unconventional monetary policy and financial markets on several aspects. Our empirical approach, for example, is widely different from others. As mentioned before, the literature primarily falls into two groups: event studies and structural vector autoregression (VAR) approach. The event study generally follows a narrative approach to identify the effects of the policy announcement on asset prices using a high frequency dataset. Estimates based on event studies, however, are sometimes questionable due to problems related to simultaneity bias, as unconventional monetary policy in our case might itself respond to any changes in the financial market. Our heteroskedasticity based estimator is able to handle the concern of simultaneity bias. On the other hand, in order to identify the exogenous monetary policy shock, although the VAR based studies are free from simultaneity bias in narrow time windows, they usually impose restrictions that do not allow free interactions among the variables in the system, which is not necessarily supported by the data. Moreover, as indicated in Bouakez et al (2013), these restrictions are rarely testable under the general assumption that the monetary policy shocks are conditionally homoscedastic. We try to overcome this shortcoming in our simple VAR framework by using relevant information in our dataset to identify the monetary policy shock. This allows us to impose minimum identification restrictions.
In addition to the modeling framework, our paper uses weekly changes in the size of the Fed’s balance sheet as a policy tool that has largely been ignored before to investigate the relationship between the unconventional monetary policy and stock market returns. Existing studies, for example, Bhattarai et al (2021), have used monthly data and suffered from small sample sizes when periods of the zero lower bound are considered. With a long list of parameters and consistent number of lags, the estimate of the monetary policy shock in these studies is questionable due to issues related to the degrees of freedom. As asset prices show faster responses to the monetary policy shock than most of the macroeconomic variables, these studies fail to properly consider the rapidly changing information content of the higher frequency asset price data. The use of weekly data in our model, on the other hand, allows us to capture the market reaction in a possible short time period.
The outline of the paper is as follows. In Section 2 we discuss the data and in Section 3 we briefly present the empirical model. In Section 4 we present the empirical results while the final section briefly concludes.
2 The data
We use weekly data, from 2008 to 2020, on two variables: changes in the size of the Fed’s balance sheet, \(x_{t}\), and market returns, \(y_{t}\). We consider the Fed’s total assets that substantially increased after 2007 as a driver of changes in the size of its balance sheet. The data on the various components of the balance sheet including assets are collected from the FRED database. We use data on U.S. market returns available on the Center for Research in Security Prices (CRSP). This return data is based on stock prices of all firms listed on the NYSE, AMEX, or NASDAQ and considered as the most comprehensive.
Figure 2 shows the series on the Fed’s logged total assets and their changes for our sample periods. As the figure shows, there was a big jump in the Fed’s holdings of total assets at the end of 2008 and the beginning of 2020 due to quantitative easing — the Fed’s large scale asset purchase of long-term treasuries and other securities to affect the long-term interest rates when short-term rates have already reached bottom low. Although the Fed sequentially tapers off this program at different stages, it sporadically maintains a large balance sheet until the end of 2020, which justifies the choice of our sample period. We also plot the effective federal funds rate and the size of the Fed’s balance sheet in Fig. 3, in order to show the timing of the Fed’s unconventional monetary policy. We find that the federal funds rate remained at a historically low level for considerable period of time when the Fed’s balance sheet continues to swell. In this regard, note that the effective federal funds rate started to move out of the zero lower bound in late 2016 and went back to the zero level in the beginning of 2020. Therefore, we applied our benchmark model to the data on periods excluding non-zero periods of the federal funds rate (that is, September, 2008 to December, 2016), but we do not find any major differences in our empirical findings. Finally, we plot the data on market returns as well as the logged market values of securities for 2008–2020 in Fig. 4. As it is evident, the stock market was mostly on upward trend with a marked level of volatility at the end of 2008 and the beginning of 2020, while the Fed was engaged into its quantitative easing programs. This heightened volatility in stock returns does not affect our identification, as it coincides with volatility in unconventional monetary policy shocks.
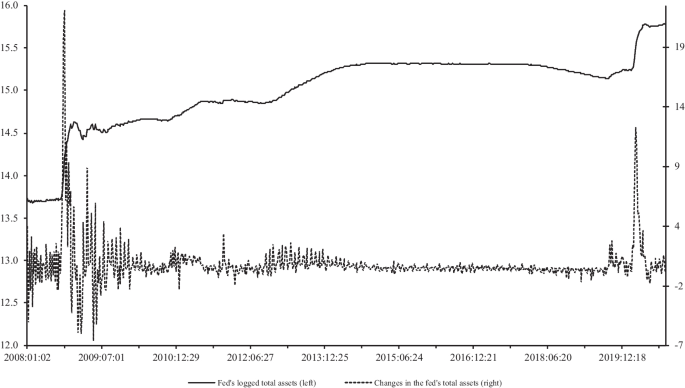
Logged total assets of the Federal Reserve and their changes
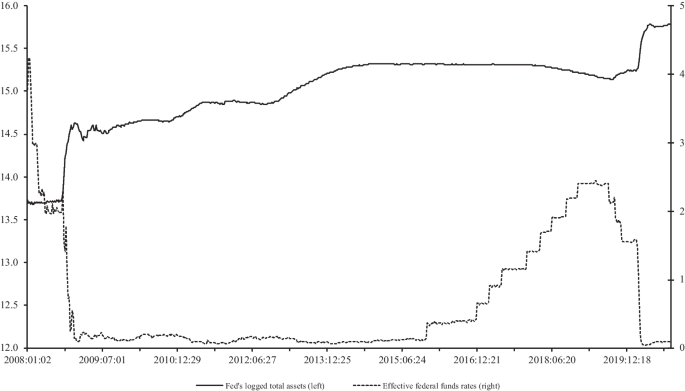
Logged total assets and effective federal funds rates
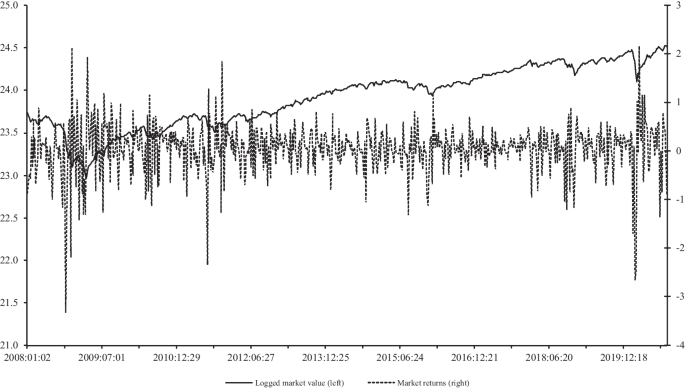
Logged market value and market returns
We examine the robustness of our empirical results by estimating disaggregate responses of stock returns to changes in the size of the Fed’s balance sheet, using data on group and industry returns. Most of these return series are readily available on CRSP while the rest are calculated using stock indices available on NetAdvantage, a subscription only database hosted by the Standard and Poor’s.
3 Econometric methodology
The empirical approach in this paper relies on the following observation based on Fig. 2: there is a marked increase in volatility in the size of the Fed’s balance sheet for several years at the beginning and the end of the sample period and much lower volatility for the rest, justifying high and low volatility regimes. This policy driven regime shifts allow us to identify the structural shocks using heteroscedasticty of weekly balance sheet data, as explained in Rigobon (2003). This identification strategy does not require any specific form of heteroscedasticity and, thus, has an advantage over ARCH/GARCH approach. In addition, the parameter estimates are still consistent in case the heteroscedasticty is misspecified.
We start with the following reduced form bivariate VAR model in order to investigate the dynamic effects of changes in the size of the Fed’s balance sheet on stock returns,
where \({\varvec{C}}\) \(_{s}\) is a \(2\times 1\) parameter vector, \(\varvec{\Phi }(j)\), \(j=1,\ldots ,p\), is a \(2\times 2\) parameter matrix, and \(\varvec{u}\) \(_{t}\sim N\left( {\varvec{0,}}\varvec{\Omega }\right)\), with \(\varvec{\Omega }\) being the variance-covariance matrix. We assume that the reduced form errors \({\varvec{u}}_{t}\), are related to a \(2\times 1\) vector of underlying independent structural shocks, \({\varvec{e}}\) \(_{t}\), as follows
In order to identify the Fed’s balance sheet shock, we follow (Wright 2012) and consider two periods of variances in the components of the Fed’s balance sheet, high and low. We assume that the balance sheet shock has mean zero and variance \(\sigma _{l}^{2}\) in low variance periods and \(\sigma _{h}^{2}\) in high variance periods. Following Rigobon and Sack (2003), periods of high variance are defined as when the four-weeks rolling variance of the residuals of the balance sheet components is more than one standard deviation above its average. We also assume that \(\sigma _{l}^{2}\ne \sigma _{h}^{2}\) and that the other structural shock is identically distributed with mean zero and variance one in all periods. If \(\mathbf {\Omega }_{l}\) and \(\mathbf {\Omega }_{h}\) are used to denote the variance-covariance matrix of the reduced form errors in low and high variance periods, respectively, then (since we are interested in identifying the balance sheet shocks only)
where
Equation (2) identifies \({\varvec{B}}\) if the normalization \(\sigma _{h}^{2}-\sigma _{l}^{2}=1\) is imposed.
In order to estimate the parameters in \({\varvec{B}}\), we estimate equation (1), identify residuals in high and low volatility periods based on the identification strategy explained before. We then use the residuals to construct the sample variance-covariance matrices, \(\hat{\mathbf {\Omega }}_{h}\) and \(\hat{\mathbf {\Omega }}_{l}\), and solve the following minimum distance problem
where \(\widehat{{{\varvec{V}}}}_{h}\) and \(\widehat{{{\varvec{V}}}}_{l}\) are estimates of the variance-covariance matrices of vech(\(\hat{\varvec{\Omega }}_{h}\)) and vech(\(\hat{\varvec{\Omega }}_{l}\)), respectively. In solving the model, we use an autoregressive lag length based on the Akaike information criterion.
The impulse response functions that show the effects of the balance sheet shock on stock returns can be calculated in the usual way. We use the bootstrap procedure described in Wright (2012) to calculate the confidence intervals.
4 Empirical evidence
In this section, we investigate the effects of an unanticipated increase in the size of the Fed’s balance sheet on aggregate and disaggregate stock returns based on the empirical model that identifies structural shocks using volatility in the size of the Fed’s balance sheet. In doing that, we calculated impulse responses over an horizon of 24 weeks and include 68% confidence intervals. In general, they are slightly fluctuating around the mean level and show a moderate level of persistence, indicating the transitory effects of the policy shock on financial markets. This is not highly surprising, as we use weekly data compared to other studies that are primarily based on the lower frequency monthly data.
4.1 Effects on stock returns
Panel A of Fig.5 shows the cumulative response of stock returns to a one standard deviation shock to the Fed’s holdings of assets. This is equivalent of increasing the growth of the Fed’s total assets by 1.265%. We find that this shock has a positive effect on stock returns. In particular, an unanticipated increase in the assets of the Federal Reserve causes a cumulative increase of around 0.3% in the stock returns in the first four weeks after the shock and gradually diminish after that. Note that the shock to the Fed’s assets produces certain results regarding the sign of its effects on stock returns, as we do not find any statistically significant negative effects.
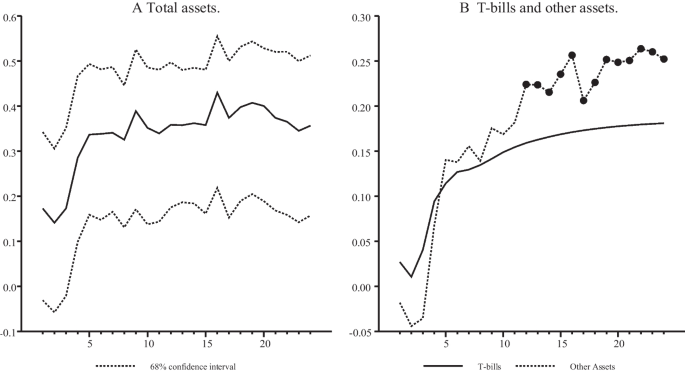
Effects on stock returns due to changes in the size of the Fed’s balance sheet. Panel A shows cumulative responses of stock returns to a shock to the Fed’s holdings of total assets. Panel B shows cumulative responses of stock returns to a shock to the Fed’s holdings of T-bills and other assets, after grou** total assets into two broad categories. Dots indicate significance of responses at 68% confidence interval
In addition to the effects of the Fed’s total assets on stock returns, we are also interested in investigating how changes in the size of different categories of assets in the Fed’s balance sheet independently affect the US stock market. Although T-bills largely cover the Fed’s portfolio of assets most often, the Fed attempted to expand its balance sheet during our sample period, by purchasing nonconventional assets through special entities and programs, such as the Commercial Paper Funding Facility, Central Bank Swap lines, Term Auction Facility, and the MBS purchase program. Based on the availability of data, we group all assets held by the Fed into two broad categories — T-bills and the other remaining assets including those purchased by the Fed through its special purchase programs. We reestimate the model after replacing total assets with each of these two broad categories of assets and show the effects on stock returns of sudden increases in the Fed’s holdings of these assets in panel B of Fig. 5. As the figure shows, stock returns significantly increase after a one standard deviation shock to other assets that exclude T-bills, indicating a similar pattern of responses as those reported in panel A in case of aggregate assets. On the other hand, increases in the holdings of only T-bills by the Fed has statistically insignificant effects on stock returns throughout the horizon. This suggests a larger independent contribution of nonconventional assets in affecting the stock returns than the conventional T-bills during the Fed’s attempt to expand its balance sheet.
Having discussed the positive effects of the Fed’s balance sheet shock on stock returns, we next focus on the transmission of this shock. In particular, the Fed’s large scale asset purchase programs during our sample period increase the level of reserves that banks hold in their accounts with the Fed and lead to an increase in the monetary base. An increase in base money usually causes a multiplicative increase in money supply which typically increases aggregate demand for goods and services and, consequently, has a positive impact on the stock market. On the other hand, the explosive growth of the Fed’s assets allows banks to issue more commercial and industrial loans, ultimately affecting the supply side of the economy. This may also benefit the stock market, as credit easing helps the firms to expand their business.
4.2 Disaggregate responses
We extend our analysis on the effects of the Fed’s balance sheet shocks on stock returns that are disaggregated into different groups and industries, in order to investigate if the positive responses of aggregate returns still hold in case of disaggregate returns. In doing so, we substitute the aggregate returns in equation (1) with each of the group and industry returns, and reestimate our empirical model using an autoregressive lag length based on the Akaike Information Criterion, as before. We then calculate the responses of disaggregate returns to a one standard deviation shock to the Fed’s balance sheet. The size of the shock is almost equal except for a group that considers earning yield factor, as the data for this group is only available from 2010. In this particular case, we adjust the shock size in order to make the group returns comparable to each other.
4.2.1 Responses of group returns
Panels A-D in Fig. 6 show the cumulative effects of the balance sheet shock on group returns based on a set of characteristics, such as firm size, operating profitability, investment, and book to market ratio. They are in general considered important factors, in addition to the overall market factor, in predicting the returns of a particular stock.
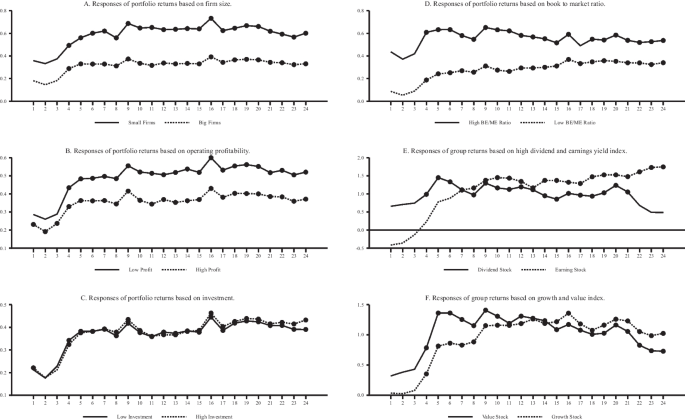
Asymmetric effects on disaggregate returns due to changes in the size of the Fed’s balance sheet. Each line in the panel shows the cumulative weekly responses of portfolio returns to a shock to the Fed’s balance sheet. Dots indicate significance of responses at 68% confidence interval
In almost all of these cases, we find positive but asymmetric effects on stock returns due to an unexpected increase in the size of the Fed’s balance sheet. For example, in Panel (A) which shows the cumulative responses of group returns based on the firm size, there are larger effects on the stock returns of the small firms than those of the big firms. The stock returns of small firms increase by about 0.60% within the first six weeks of the shock, compared to an increase of 0.32% in the returns of big firms. It clearly suggests that, in receiving the benefits of the Fed’s aggressive balance sheet expansion, smaller firms that mostly rely on bank-based financing have an edge over big firms that primarily depend on the capital market for their financing.
Similar types of patterns are also present in Panel (B) that shows the cumulative responses of group returns after considering another factor, profitability. Returns of the firms with low profitability respond more to the Fed’s balance sheet shock than returns of the firms that earn high profit. For example, there are peak responses of 0.48% for the low profit group in the first six weeks, whereas the returns of the high profit group increase at most by 0.36% during the same period. If profitability is taken as indicative of growth potential for the firms, we conclude that firms with low growth are comparatively more befitted from the Fed’s balance sheet expansion than the firms with high growth. On the other hand, there is less evidence of asymmetry if groups are constructed using the investment factor, which is primarily defined as the change in firms’ total assets over two consecutive periods. In particular, as Panel (C) shows, although the effects of the Fed’s balance sheet shock on the returns of the high and low investment groups are positive, they are almost identical in magnitude. This suggests that the Fed’s unconventional policy shock induces market participants to remain largely indifferent in choosing stocks between low and high investment firms. Finally, in Panel D we further identify positive asymmetric effects of the Fed’s balance sheet shock on group returns that consider the book to market ratio. The returns in case of low BE/ME ratio increase by 0.25% in the first six weeks, compared to 0.63% for those with high BE/ME ratio in the same period. This indicates that in making the investment decision, the Fed’s unconventional monetary policy prompts the investor to care more about the accounting values of the firms than their market values.
In Panels (E) and (F) of Fig. 6, we next consider the effects of a shock to the Fed’s balance sheet on groups of returns that are calculated using a set of stock indices based on different criteria such as dividend yield, company earnings, their growth, and intrinsic values of the stocks. Panel E shows the cumulative responses of S &P Aristocrats returns, that include stocks of companies offering consistently increasing dividend every year for at least twenty years. We find that the Fed’s expansionary monetary policy driven by a positive shock to its balance sheet creates a high demand for high dividend paying stocks, as their returns significantly increase within the first month of the shock. On the other hand, since earnings are one of the main determinants of stock prices in addition to dividend payments, in Panel E of Fig. 6, we also examine the effects of the Fed’s balance sheet shock on a group of stock returns that largely considers the earnings yield factor. These returns are calculated from the MSCI USA Barra Earnings Yield Index. Unlike the S &P Aristocrats returns, high earning stocks insignificantly decrease on impact before they increase in the later part of the horizon. This may happen due to the market sentiment that usually goes against high earning stocks during recessionary periods, when corporate earnings are adversely affected. However, the evidence of asymmetry is still present here, as there are considerable differences in the magnitude of responses for these two groups of stock returns over the whole forecasting horizon.
We finally investigate how the Fed’s unconventional monetary policy affects the returns of growth and value stocks. Growth stocks, as the name indicates, are stocks of those companies that show high growth potential in the future and usually do not offer dividends. Hence, they are generally demanded by those investors who mostly care about capital gains. Investors also care about value stocks that consider high dividend pay out ratios and are usually traded under their intrinsic values based on the financial status of the companies. In Panel F, we show the cumulative responses of returns, calculated using S &P growth and value indices, to an unexpected increase in the holdings of the Fed’s assets. The responses are mostly similar, as stock returns in both cases increase due to the shock, although it appears that investors care more about value stocks than the growth ones, indicating the presence of asymmetric responses for these two groups of stock returns to a shock to the Fed’s unconventional monetary policy. This is evident after comparing responses of returns in Panel F, as returns for the value stocks shot up by about 1.36% within six weeks after the shock, compared to a 0.86% increase in the returns for the growth stocks. This finding is consistent with what we reported before in Panel A (Low Profit Vs. High Profit), which indicates a higher effect on group returns of the balance sheet shock with low profit than the returns with high profit.
4.2.2 Responses of stock returns by industry
Our empirical results in the previous section suggest that the unconventional expansionary monetary policy shock leads to an increase in group returns that are based on different criteria. In this section, we further check the robustness of our main results by applying the bivariate model (1) to industry returns. These returns data are available on CRSP, as mentioned before. The portfolios are constructed by assigning Compustat four-digit SIC codes, or CRSP SIC codes if Compustat codes are not available, to each of the stocks listed in NYSE, AMEX, and NASDAQ. They include a range of sectors such as agriculture, mining, construction, manufacturing, transportation and public utilities, wholesale and retail trade, finance, insurance and real estate, and services. The complete list of the 4-digit SIC industries is available on the CRSP website.
We calculate the cumulative responses of industry returns to a one standard deviation shock to the Fed’s balance sheet and, in order to conserve space, we only report the maximum responses in Table 1. As the table shows, there is heterogeneity in the effects of the unconventional policy shock on industry returns over the industries, with manufacturing, consumer discretionary, energy, materials, real-estate, and financials showing higher level of responses than the others. For example, an unexpected increase in the size of Fed’s balance sheet raises stock returns of the industries, such as paper, textiles, ships, building materials, autos, coal, rubber, mines, and real-estates, by more than 0.7%. Similarly, the industry returns of electrical equipment, transportation, chemical, clothes, and wholesale products increase by 0.5% -0.7%. The large responses of all of these industries are not at all surprising, as these industries are involved in producing capital intensive as well as durable goods that are pro-cyclical, especially in the event of the Fed’s large-scale monetary expansion triggered by the balance sheet shock when the interest rate is already low.
On the other hand, we find limited cumulative increases, around 0.25%, in the returns of those industries that produce household, food, beverage, and retail items. These are staples and non-durables producing companies that face relatively stable demand for their products regardless of the business cycle. In addition, their stock returns may not respond to a full extent in the early stage of the recovery, initiated by the Fed’s policy action, due to low inflation. We also observe muted responses for the stock returns of drugs and utilities, as production activities in these industries are also not sensitive to business cycle expansions and contractions.
Finally, Fed’s unconventional monetary policy has mixed effects on the returns of the Information Technology (IT). As the Table 1 shows, while the balance sheet shock has strong effects on returns of the chip manufacturing firms, there are relatively much lower effects on returns of the hardware and software firms. It is generally expected that stock returns of the IT industry should exhibit a much stronger response in earlier stage of the recovery in anticipation of picking up the demand for their products later in a more mature stage. In addition, since the financial industry in general is highly linked to the Fed’s monetary policy, it is also expected that there will be relatively stronger responses of financial industry returns due to the Fed’s unconventional monetary policy shock. However, as reported in Table 1, we find statistically insignificant increases of 0.9% and 0.71% in the returns of the banking and finance industry.
In order to compare the empirical findings in Table 1 with the sensitivity of industry returns to the overall market move, we finally compute beta for each of the industries by regressing its returns on aggregate returns and report it in Table 1. We find that the responses of industry returns to an unconventional monetary policy shock are in general consistent with the betas. For example, industries that are relatively more volatile, such as energy, materials, real estate, consumer discretionary, manufacturing, and financials, with betas greater than one show larger responses to the monetary policy shock. On the other hand, industries such as information technology, consumer staples, health, household products, and utility, that indicate moderate or low level of responses due to an unexpected change in the Fed’s balance sheet have betas equal to or less than one.
5 Conclusion
This paper uses weekly changes in the size of the Fed’s balance sheet as a policy tool that has largely been ignored in the literature to explore the relationship between the Fed’s unconventional monetary policy and the stock market. We specify a simple structural VAR that is identified on heteroscedasticity of the Fed’s weekly balance sheet data and investigate the effects of the policy shock on market returns. We find empirical evidence that unexpected increases in the size of the Fed’s balance sheet have statistically significant positive effects on the stock market. A one standard deviation shock to the Fed’s balance sheet in our model increases cumulative returns by 0.3% in four weeks.
We extend our whole analysis by substituting aggregate returns with different groups and industry specific stock returns in order to find additional empirical evidence. Similar to aggregate returns, most of the industry returns increase due to a shock to the Fed’s balance sheet, but there is evidence of heterogeneity in these responses. We also observe consistent responses of group returns to the Fed’s unconventional policy shock, but it generates variations in responses when making a pairwise comparison of group returns, indicating an evidence of asymmetry.
Data Availability
Data will be supplied upon request.
References
Bhattarai S, Chatterjee A, Park WY (2021) Effects of US quantitative easing on emerging market economies. Journal of Economic Dynamic and Control 121:104031
Bouakez H, Essid B, Normandin M (2013) Stock Returns and monetary policy: Are there any ties? Journal of Macroeconomics 36:33–50
Christiano LJ, Eichenbaum M, Evans C (1996) The effects of monetary policy shocks: evidence from the flow of funds. The Review of Economics and Statistics 78:16–34
C’urdia, V, M Woodford, (2011) The central-bank balance sheet as an instrument of monetary policy. Journal of Monetary Economics 58:1–34
Gambacorta L, Hofmann B, Peersman G (2014) The effectiveness of unconventional monetary policy at the zero lower bound: A cross country analysis. Journal of Money, Credit and Banking 46:615–642
Gilchrist S, Yankov V, Zakrajsek E (2009) Credit market shocks and economic fluctuations: Evidence from corporate bond and stock markets. Journal of Monetary Economics 56:471–493
Kuttner NK (2001) Monetary policy surprises and interest rates: Evidence from the Fed funds futures market. Journal of Monetary Economics 47:523–544
Liu P, Theodoridis K, Mumtaz H, Zanetti F (2019) Changing macroeconomic dynamics at the zero lower bound. Journal of Business and Economic Statistics 37:391–404
Rigobon R (2003) Identification through Heteroskedasticity. The Review of Economics and Statistics 85:777–792
Rigobon R, Sack B (2003) Measuring the reaction of monetary policy to the stock market. Quarterly Journal of Economics 118:639–669
Wright JH (2012) What does monetary policy do to long-term interest rates at the zero lower bound. Economic Journal 122:F447–F466
Author information
Authors and Affiliations
Corresponding author
Ethics declarations
Conflicts of interest
We have no conflicts of interest.
Additional information
Publisher's Note
Springer Nature remains neutral with regard to jurisdictional claims in published maps and institutional affiliations.
Rights and permissions
Springer Nature or its licensor (e.g. a society or other partner) holds exclusive rights to this article under a publishing agreement with the author(s) or other rightsholder(s); author self-archiving of the accepted manuscript version of this article is solely governed by the terms of such publishing agreement and applicable law.
About this article

Cite this article
Rahman, S., Serletis, A. Unconventional monetary policy and the stock market. J Econ Finan 47, 707–722 (2023). https://doi.org/10.1007/s12197-023-09624-z
Accepted:
Published:
Issue Date:
DOI: https://doi.org/10.1007/s12197-023-09624-z