
Abstract
Due to the need for generalizable and rapidly delivered evidence to inform healthcare decision-making, real-world data have grown increasingly important to answer causal questions. However, causal inference using observational data poses numerous challenges, and relevant methodological literature is vast. We endeavored to identify underlying unifying themes of causal inference using real-world healthcare data and connect them into a single schema to aid in observational study design, and to demonstrate this schema using a previously published research example. A multidisciplinary team (epidemiology, biostatistics, health economics) reviewed the literature related to causal inference and observational data to identify key concepts. A visual guide to causal study design was developed to concisely and clearly illustrate how the concepts are conceptually related to one another. A case study was selected to demonstrate an application of the guide. An eight-step guide to causal study design was created, integrating essential concepts from the literature, anchored into conceptual grou**s according to natural steps in the study design process. The steps include defining the causal research question and the estimand; creating a directed acyclic graph; identifying biases and design and analytic techniques to mitigate their effect, and techniques to examine the robustness of findings. The cardiovascular case study demonstrates the applicability of the steps to develo** a research plan. This paper used an existing study to demonstrate the relevance of the guide. We encourage researchers to incorporate this guide at the study design stage in order to elevate the quality of future real-world evidence.
1 Introduction
Approximately 50 new drugs are approved each year in the United States (Mullard 2022). For all new drugs, randomized controlled trials (RCTs) are the gold-standard by which potential effectiveness (“efficacy”) and safety are established. However, RCTs cannot guarantee how a drug will perform in a less controlled context. For this reason, regulators frequently require observational, post-approval studies using “real-world” data, sometimes even as a condition of drug approval. The “real-world” data requested by regulators is often derived from insurance claims databases and/or healthcare records. Importantly, these data are recorded during routine clinical care without concern for potential use in research. Yet, in recent years, there has been increasing use of such data for causal inference and regulatory decision making, presenting a variety of methodologic challenges for researchers and stakeholders to consider (Arlett et al. 2022; Berger et al. 2017; Concato and ElZarrad 2022; Cox et al. 2009; European Medicines Agency 2023; Franklin and Schneeweiss 2017; Girman et al. 2014; Hernán and Robins 2016; International Society for Pharmacoeconomics and Outcomes Research (ISPOR) 2022; International Society for Pharmacoepidemiology (ISPE) 2020; Stuart et al. 2013; U.S. Food and Drug Administration 2018; Velentgas et al. 2013).
Current guidance for causal inference using observational healthcare data articulates the need for careful study design (Berger et al. 2017; Cox et al. 2009; European Medicines Agency 2023; Girman et al. 2014; Hernán and Robins 2016; Stuart et al. 2013; Velentgas et al. 2013). In 2009, Cox et al. described common sources of bias in observational data and recommended specific strategies to mitigate these biases (Cox et al. 2009). In 2013, Stuart et al. emphasized counterfactual theory and trial emulation, offered several approaches to address unmeasured confounding, and provided guidance on the use of propensity scores to balance confounding covariates (Stuart et al. 2013). In 2013, the Agency for Healthcare Research and Quality (AHRQ) released an extensive, 200-page guide to develo** a protocol for comparative effectiveness research using observational data (Velentgas et al. 2013). The guide emphasized development of the research question, with additional chapters on study design, comparator selection, sensitivity analyses, and directed acyclic graphs (Velentgas et al. 2013). In 2014, Girman et al. provided a clear set of steps for assessing study feasibility including examination of the appropriateness of the data for the research question (i.e., ‘fit-for-purpose’), empirical equipoise, and interpretability, stating that comparative effectiveness research using observational data “should be designed with the goal of drawing a causal inference” (Girman et al. 2014). In 2017, Berger et al. described aspects of “study hygiene,” focusing on procedural practices to enhance confidence in, and credibility of, real-world data studies (Berger et al. 2017). Currently, the European Network of Centres for Pharmacoepidemiology and Pharmacovigilance (ENCePP) maintains a guide on methodological standards in pharmacoepidemiology which discusses causal inference using observational data and includes an overview of study designs, a chapter on methods to address bias and confounding, and guidance on writing statistical analysis plans (European Medicines Agency 2023). In addition to these resources, the “target trial framework” provides a structured approach to planning studies for causal inferences from observational databases (Hernán and Robins 2016; Wang et al. 2023b). This framework, published in 2016, encourages researchers to first imagine a clinical trial for the study question of interest and then to subsequently design the observational study to reflect the hypothetical trial (Hernán and Robins 2016).
While the literature addresses critical issues collectively, there remains a need for a framework that puts key components, including the target trial approach, into a simple, overarching schema (Loveless 2022) so they can be more easily remembered, and communicated to all stakeholders including (new) researchers, peer-reviewers, and other users of the research findings (e.g., practicing providers, professional clinical societies, regulators). For this reason, we created a step-by-step guide for causal inference using administrative health data, which aims to integrate these various best practices at a high level and complements existing, more specific guidance, including those from the International Society for Pharmacoeconomics and Outcomes Research (ISPOR) and the International Society for Pharmacoepidemiology (ISPE) (Berger et al. 2017; Cox et al. 2009; Girman et al. 2014). We demonstrate the application of this schema using a previously published paper in cardiovascular research.
2 Methods
This work involved a formative phase and an implementation phase to evaluate the utility of the causal guide. In the formative phase, a multidisciplinary team with research expertise in epidemiology, biostatistics, and health economics reviewed selected literature (peer-reviewed publications, including those mentioned in the introduction, as well as graduate-level textbooks) related to causal inference and observational healthcare data from the pharmacoepidemiologic and pharmacoeconomic perspectives. The potential outcomes framework served as the foundation for our conception of causal inference (Rubin 2005). Information was grouped into the following four concepts: (1) Defining the Research Question; (2) Defining the Estimand; (3) Identifying and Mitigating Biases; (4) Sensitivity Analysis. A step-by-step guide to causal study design was developed to distill the essential elements of each concept, organizing them into a single schema so that the concepts are clearly related to one another. References for each step of the schema are included in the Supplemental Table.
In the implementation phase we tested the application of the causal guide to previously published work (Dondo et al. 2017). The previously published work utilized data from the Myocardial Ischaemia National Audit Project (MINAP), the United Kingdom’s national heart attack register. The goal of the study was to assess the effect of β-blockers on all-cause mortality among patients hospitalized for acute myocardial infarction without heart failure or left ventricular systolic dysfunction. We selected this paper for the case study because of its clear descriptions of the research goal and methods, and the explicit and methodical consideration of potential biases and use of sensitivity analyses to examine the robustness of the main findings.
3 Results
3.1 Overview of the eight steps
The step-by-step guide to causal inference comprises eight distinct steps (Fig. 1) across the four concepts. As scientific inquiry and study design are iterative processes, the various steps may be completed in a different order than shown, and steps may be revisited.
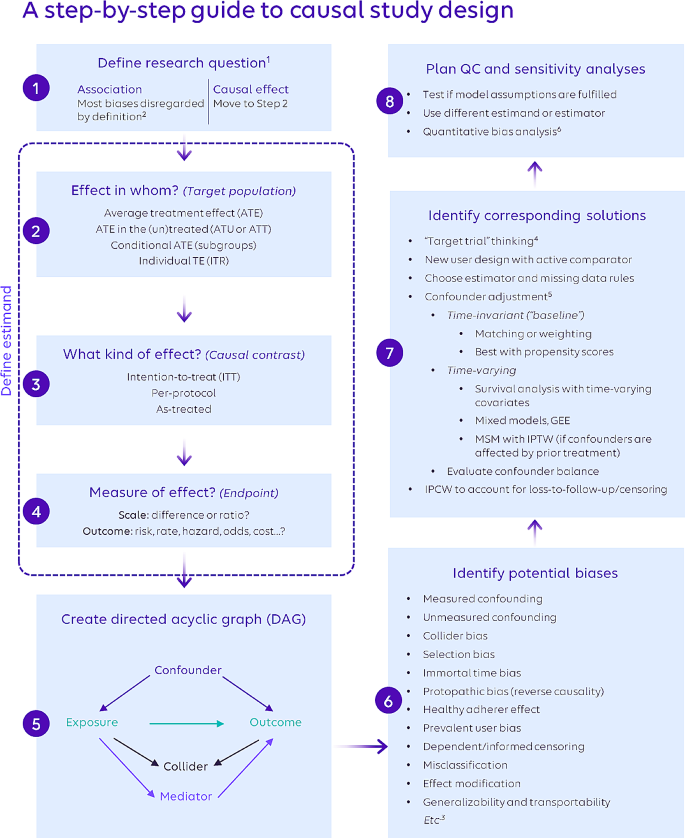
A step-by-step guide for causal study design
Abbreviations: GEE: generalized estimating equations; IPC/TW: inverse probability of censoring/treatment weighting; ITR: individual treatment response; MSM: marginal structural model; TE: treatment effect
Please refer to the Supplemental Table for references providing more in-depth information.
1 Ensure that the exposure and outcome are well-defined based on literature and expert opinion.
2 More specifically, measures of association are not affected by issues such as confounding and selection bias because they do not intend to isolate and quantify a single causal pathway. However, information bias (e.g., variable misclassification) can negatively affect association estimates, and association estimates remain subject to random variability (and are hence reported with confidence intervals).
3 This list is not exhaustive; it focuses on frequently encountered biases.
4 To assess bias in a nonrandomized study following the target trial framework, use of the ROBINS-I tool is recommended (https://www.bmj.com/content/355/bmj.i4919 ).
5 Only a selection of the most popular approaches is presented here. Other methods exist; e.g., g-computation and g-estimation for both time-invariant and time-varying analysis; instrumental variables; and doubly-robust estimation methods. There are also program evaluation methods (e.g., difference-in-differences, regression discontinuities) that can be applied to pharmacoepidemiologic questions. Conventional outcome regression analysis is not recommended for causal estimation due to issues determining covariate balance, correct model specification, and interpretability of effect estimates.
6 Online tools include, among others, an E-value calculator for unmeasured confounding (https://www.evalue-calculator.com/) and the P95 outcome misclassification estimator (http://apps.p-95.com/ISPE/).
3.2 Defining the Research question (step 1)
The process of designing a study begins with defining the research question. Research questions typically center on whether a causal relationship exists between an exposure and an outcome. This contrasts with associative questions, which, by their nature, do not require causal study design elements because they do not attempt to isolate a causal pathway from a single exposure to an outcome under study. It is important to note that the phrasing of the question itself should clarify whether an association or a causal relationship is of interest. The study question “Does statin use reduce the risk of future cardiovascular events?” is explicitly causal and requires that the study design addresses biases such as confounding. In contrast, the study question “Is statin use associated with a reduced risk of future cardiovascular events?” can be answered without control of confounding since the word “association” implies correlation. Too often, however, researchers use the word “association” to describe their findings when their methods were created to address explicitly causal questions (Hernán 2018). For example, a study that uses propensity score-based methods to balance risk factors between treatment groups is explicitly attempting to isolate a causal pathway by removing confounding factors. This is different from a study that intends only to measure an association. In fact, some journals may require that the word “association” be used when causal language would be more appropriate; however, this is beginning to change (Flanagin et al. 2024).
3.3 Defining the estimand (steps 2, 3, 4)
The estimand is the causal effect of research interest and is described in terms of required design elements: the target population for the counterfactual contrast, the kind of effect, and the effect/outcome measure.
In Step 2, the study team determines the target population of interest, which depends on the research question of interest. For example, we may want to estimate the effect of the treatment in the entire study population, i.e., the hypothetical contrast between all study patients taking the drug of interest versus all study patients taking the comparator (the average treatment effect; ATE). Other effects can be examined, including the average treatment effect in the treated or untreated (ATT or ATU).When covariate distributions are the same across the treated and untreated populations and there is no effect modification by covariates, these effects are generally the same (Wang et al. 2017). In RCTs, this occurs naturally due to randomization, but in non-randomized data, careful study design and statistical methods must be used to mitigate confounding bias.
In Step 3, the study team decides whether to measure the intention-to-treat (ITT), per-protocol, or as-treated effect. The ITT approach is also known as “first-treatment-carried-forward” in the observational literature (Lund et al. 2015). In trials, the ITT measures the effect of treatment assignment rather than the treatment itself, and in observational data the ITT can be conceptualized as measuring the effect of treatment as started. To compute the ITT effect from observational data, patients are placed into the exposure group corresponding to the treatment that they initiate, and treatment switching or discontinuation are purposely ignored in the analysis. Alternatively, a per-protocol effect can be measured from observational data by classifying patients according to the treatment that they initiated but censoring them when they stop, switch, or otherwise change treatment (Danaei et al. 2013; Yang et al. 2014). Finally, “as-treated” effects are estimated from observational data by classifying patients according to their actual treatment exposure during follow-up, for example by using multiple time windows to measure exposure changes (Danaei et al. 2013; Yang et al. 2014).
Step 4 is the final step in specifying the estimand in which the research team determines the effect measure of interest. Answering this question has two parts. First, the team must consider how the outcome of interest will be measured. Risks, rates, hazards, odds, and costs are common ways of measuring outcomes, but each measure may be best suited to a particular scenario. For example, risks assume patients across comparison groups have equal follow-up time, while rates allow for variable follow-up time (Rothman et al. 2008). Costs may be of interest in studies focused on economic outcomes, including as inputs to cost-effectiveness analyses. After deciding how the outcome will be measured, it is necessary to consider whether the resulting quantity will be compared across groups using a ratio or a difference. Ratios convey the effect of exposure in a way that is easy to understand, but they do not provide an estimate of how many patients will be affected. On the other hand, differences provide a clearer estimate of the potential public health impact of exposure; for example, by allowing the calculation of the number of patients that must be treated to cause or prevent one instance of the outcome of interest (Tripepi et al. 2007).
3.4 Identifying and mitigating biases (steps 5, 6, 7)
Observational, real-world studies can be subject to multiple potential sources of bias, which can be grouped into confounding, selection, measurement, and time-related biases (Prada-Ramallal et al. 2019).
In Step 5, as a practical first approach in develo** strategies to address threats to causal inference, researchers should create a visual map** of factors that may be related to the exposure, outcome, or both (also called a directed acyclic graph or DAG) (Pearl 1995). While creating a high-quality DAG can be challenging, guidance is increasingly available to facilitate the process (Ferguson et al. 2020; Gatto et al. 2022; Hernán and Robins 2020; Rodrigues et al. 2022; Sauer 2013). The types of inter-variable relationships depicted by DAGs include confounders, colliders, and mediators. Confounders are variables that affect both exposure and outcome, and it is necessary to control for them in order to isolate the causal pathway of interest. Colliders represent variables affected by two other variables, such as exposure and outcome (Griffith et al. 2020). Colliders should not be conditioned on since by doing so, the association between exposure and outcome will become distorted. Mediators are variables that are affected by the exposure and go on to affect the outcome. As such, mediators are on the causal pathway between exposure and outcome and should also not be conditioned on, otherwise a path between exposure and outcome will be closed and the total effect of the exposure on the outcome cannot be estimated. Mediation analysis is a separate type of analysis aiming to distinguish between direct and indirect (mediated) effects between exposure and outcome and may be applied in certain cases (Richiardi et al. 2013). Overall, the process of creating a DAG can create valuable insights about the nature of the hypothesized underlying data generating process and the biases that are likely to be encountered (Digitale et al. 2022). Finally, an extension to DAGs which incorporates counterfactual theory is available in the form of Single World Intervention Graphs (SWIGs) as described in a 2013 primer (Richardson and Robins 2013).
In Step 6, researchers comprehensively assess the possibility of different types of bias in their study, above and beyond what the creation of the DAG reveals. Many potential biases have been identified and summarized in the literature (Berger et al. 2017; Cox et al. 2009; European Medicines Agency 2023; Girman et al. 2014; Stuart et al. 2013; Velentgas et al. 2013). Every study can be subject to one or more biases, each of which can be addressed using one or more methods. The study team should thoroughly and explicitly identify all possible biases with consideration for the specifics of the available data and the nuances of the population and health care system(s) from which the data arise. Once the potential biases are identified and listed, the team can consider potential solutions using a variety of study design and analytic techniques.
In Step 7, the study team considers solutions to the biases identified in Step 6. “Target trial” thinking serves as the basis for many of these solutions by requiring researchers to consider how observational studies can be designed to ensure comparison groups are similar and produce valid inferences by emulating RCTs (Labrecque and Swanson 2017; Wang et al. 2023b). Designing studies to include only new users of a drug and an active comparator group is one way of increasing the similarity of patients across both groups, particularly in terms of treatment history. Careful consideration must be paid to the specification of the time periods and their relationship to inclusion/exclusion criteria (Suissa and Dell’Aniello 2020). For instance, if a drug is used intermittently, a longer wash-out period is needed to ensure adequate capture of prior use in order to avoid bias (Riis et al. 2015). The study team should consider how to approach confounding adjustment, and whether both time-invariant and time-varying confounding may be present. Many potential biases exist, and many methods have been developed to address them in order to improve causal estimation from observational data. Many of these methods, such as propensity score estimation, can be enhanced by machine learning (Athey and Imbens 2019; Belthangady et al. 2021; Mai et al. 2022; Onasanya et al. 2024; Schuler and Rose 2017; Westreich et al. 2010). Machine learning has many potential applications in the causal inference discipline, and like other tools, must be used with careful planning and intentionality. To aid in the assessment of potential biases, especially time-related ones, and the development of a plan to address them, the study design should be visualized (Gatto et al. 2022; Schneeweiss et al. 2019). Additionally, we note the opportunity for collaboration across research disciplines (e.g., the application of difference-in-difference methods (Zhou et al. 2016) to the estimation of comparative drug effectiveness and safety).
3.5 Quality Control & sensitivity analyses (step 8)
Causal study design concludes with Step 8, which includes planning quality control and sensitivity analyses to improve the internal validity of the study. Quality control begins with reviewing study output for prima facie validity. Patient characteristics (e.g., distributions of age, sex, region) should align with expected values from the researchers’ intuition and the literature, and researchers should assess reasons for any discrepancies. Sensitivity analyses should be conducted to determine the robustness of study findings. Researchers can test the stability of study estimates using a different estimand or type of model than was used in the primary analysis. Sensitivity analysis estimates that are similar to those of the primary analysis might confirm that the primary analysis estimates are appropriate. The research team may be interested in how changes to study inclusion/exclusion criteria may affect study findings or wish to address uncertainties related to measuring the exposure or outcome in the administrative data by modifying the algorithms used to identify exposure or outcome (e.g., requiring hospitalization with a diagnosis code in a principal position rather than counting any claim with the diagnosis code in any position). As feasible, existing validation studies for the exposure and outcome should be referenced, or new validation efforts undertaken. The results of such validation studies can inform study estimates via quantitative bias analyses (Lanes and Beachler 2023). The study team may also consider biases arising from unmeasured confounding and plan quantitative bias analyses to explore how unmeasured confounding may impact estimates. Quantitative bias analysis can assess the directionality, magnitude, and uncertainty of errors arising from a variety of limitations (Brenner and Gefeller 1993; Lash et al. 2009, 2014; Leahy et al. 2022).
3.6 Illustration using a previously published research study
In order to demonstrate how the guide can be used to plan a research study utilizing causal methods, we turn to a previously published study (Dondo et al. 2017) that assessed the causal relationship between the use of 𝛽-blockers and mortality after acute myocardial infarction in patients without heart failure or left ventricular systolic dysfunction. The investigators sought to answer a causal research question (Step 1), and so we proceed to Step 2. Use (or no use) of 𝛽-blockers was determined after discharge without taking into consideration discontinuation or future treatment changes (i.e., intention-to-treat). Considering treatment for whom (Step 3), both ATE and ATT were evaluated. Since survival was the primary outcome, an absolute difference in survival time was chosen as the effect measure (Step 4). While there was no explicit directed acyclic graph provided, the investigators specified a list of confounders.
Robust methodologies were established by consideration of possible sources of biases and addressing them using viable solutions (Steps 6 and 7). Table 1 offers a list of the identified potential biases and their corresponding solutions as implemented. For example, to minimize potential biases including prevalent-user bias and selection bias, the sample was restricted to patients with no previous use of 𝛽-blockers, no contraindication for 𝛽-blockers, and no prescription of loop diuretics. To improve balance across the comparator groups in terms of baseline confounders, i.e., those that could influence both exposure (𝛽-blocker use) and outcome (mortality), propensity score-based inverse probability of treatment weighting (IPTW) was employed. However, we noted that the baseline look-back period to assess measured covariates was not explicitly listed in the paper.
Quality control and sensitivity analysis (Step 8) is described extensively. The overlap of propensity score distributions between comparator groups was tested and confounder balance was assessed. Since observations in the tail-end of the propensity score distribution may violate the positivity assumption (Crump et al. 2009), a sensitivity analysis was conducted including only cases within 0.1 to 0.9 of the propensity score distribution. While not mentioned by the authors, the PS tails can be influenced by unmeasured confounders (Sturmer et al. 2021), and the findings were robust with and without trimming. An assessment of extreme IPTW weights, while not included, would further help increase confidence in the robustness of the analysis. An instrumental variable approach was employed to assess potential selection bias due to unmeasured confounding, using hospital rates of guideline-indicated prescribing as the instrument. Additionally, potential bias caused by missing data was attenuated through the use of multiple imputation, and separate models were built for complete cases only and imputed/complete cases.
4 Discussion
We have described a conceptual schema for designing observational real-world studies to estimate causal effects. The application of this schema to a previously published study illuminates the methodologic structure of the study, revealing how each structural element is related to a potential bias which it is meant to address. Real-world evidence is increasingly accepted by healthcare stakeholders, including the FDA (Concato and Corrigan-Curay 2022; Concato and ElZarrad 2022), and its use for comparative effectiveness and safety assessments requires appropriate causal study design; our guide is meant to facilitate this design process and complement existing, more specific, guidance.
Existing guidance for causal inference using observational data includes components that can be clearly mapped onto the schema that we have developed. For example, in 2009 Cox et al. described common sources of bias in observational data and recommended specific strategies to mitigate these biases, corresponding to steps 6–8 of our step-by-step guide (Cox et al. 2009). In 2013, the AHRQ emphasized development of the research question, corresponding to steps 1–4 of our guide, with additional chapters on study design, comparator selection, sensitivity analyses, and directed acyclic graphs which correspond to steps 7 and 5, respectively (Velentgas et al. 2013). Much of Girman et al.’s manuscript (Girman et al. 2014) corresponds with steps 1–4 of our guide, and the matter of equipoise and interpretability specifically correspond to steps 3 and 7–8. The current ENCePP guide on methodological standards in pharmacoepidemiology contains a section on formulating a meaningful research question, corresponding to step 1, and describes strategies to mitigate specific sources of bias, corresponding to steps 6–8 (European Medicines Agency 2023). Recent works by the FDA Sentinel Innovation Center (Desai et al. 2024) and the Joint Initiative for Causal Inference (Dang et al. 2023) provide more advanced exposition of many of the steps in our guide. The target trial framework contains guidance on develo** seven components of the study protocol, including eligibility criteria, treatment strategies, assignment procedures, follow-up period, outcome, causal contrast of interest, and analysis plan (Hernán and Robins 2016). Our work places the target trial framework into a larger context illustrating its relationship with other important study planning considerations, including the creation of a directed acyclic graph and incorporation of prespecified sensitivity and quantitative bias analyses.
Ultimately, the feasibility of estimating causal effects relies on the capabilities of the available data. Real-world data sources are complex, and the investigator must carefully consider whether the data on hand are sufficient to answer the research question. For example, a study that relies solely on claims data for outcome ascertainment may suffer from outcome misclassification bias (Lanes and Beachler 2023). This bias can be addressed through medical record validation for a random subset of patients, followed by quantitative bias analysis (Lanes and Beachler 2023). If instead, the investigator wishes to apply a previously published, claims-based algorithm validated in a different database, they must carefully consider the transportability of that algorithm to their own study population. In this way, causal inference from real-world data requires the ability to think creatively and resourcefully about how various data sources and elements can be leveraged, with consideration for the strengths and limitations of each source. The heart of causal inference is in the pairing of humility and creativity: the humility to acknowledge what the data cannot do, and the creativity to address those limitations as best as one can at the time.
4.1 Limitations
As with any attempt to synthesize a broad array of information into a single, simplified schema, there are several limitations to our work. Space and useability constraints necessitated simplification of the complex source material and selections among many available methodologies, and information about the relative importance of each step is not currently included. Additionally, it is important to consider the context of our work. This step-by-step guide emphasizes analytic techniques (e.g., propensity scores) that are used most frequently within our own research environment and may not include less familiar study designs and analytic techniques. However, one strength of the guide is that additional designs and techniques or concepts can easily be incorporated into the existing schema. The benefit of a schema is that new information can be added and is more readily accessed due to its association with previously sorted information (Loveless 2022). It is also important to note that causal inference was approached as a broad overarching concept defined by the totality of the research, from start to finish, rather than focusing on a particular analytic technique, however we view this as a strength rather than a limitation.
Finally, the focus of this guide was on the methodologic aspects of study planning. As a result, we did not include steps for drafting or registering the study protocol in a public database or for communicating results. We strongly encourage researchers to register their study protocols and communicate their findings with transparency. A protocol template endorsed by ISPOR and ISPE for studies using real-world data to evaluate treatment effects is available (Wang et al. 2023a). Additionally, the steps described above are intended to illustrate an order of thinking in the study planning process, and these steps are often iterative. The guide is not intended to reflect the order of study execution; specifically, quality control procedures and sensitivity analyses should also be formulated up-front at the protocol stage.
5 Conclusion
We outlined steps and described key conceptual issues of importance in designing real-world studies to answer causal questions, and created a visually appealing, user-friendly resource to help researchers clearly define and navigate these issues. We hope this guide serves to enhance the quality, and thus the impact, of real-world evidence.
Data availability
No datasets were generated or analysed during the current study.
References
Arlett, P., Kjaer, J., Broich, K., Cooke, E.: Real-world evidence in EU Medicines Regulation: Enabling Use and establishing value. Clin. Pharmacol. Ther. 111(1), 21–23 (2022)
Athey, S., Imbens, G.W.: Machine Learning Methods That Economists Should Know About. Annual Review of Economics 11(Volume 11, 2019): 685–725. (2019)
Belthangady, C., Stedden, W., Norgeot, B.: Minimizing bias in massive multi-arm observational studies with BCAUS: Balancing covariates automatically using supervision. BMC Med. Res. Methodol. 21(1), 190 (2021)
Berger, M.L., Sox, H., Willke, R.J., Brixner, D.L., Eichler, H.G., Goettsch, W., Madigan, D., Makady, A., Schneeweiss, S., Tarricone, R., Wang, S.V., Watkins, J.: and C. Daniel Mullins. 2017. Good practices for real-world data studies of treatment and/or comparative effectiveness: Recommendations from the joint ISPOR-ISPE Special Task Force on real-world evidence in health care decision making. Pharmacoepidemiol Drug Saf. 26(9): 1033–1039
Brenner, H., Gefeller, O.: Use of the positive predictive value to correct for disease misclassification in epidemiologic studies. Am. J. Epidemiol. 138(11), 1007–1015 (1993)
Concato, J., Corrigan-Curay, J.: Real-world evidence - where are we now? N Engl. J. Med. 386(18), 1680–1682 (2022)
Concato, J., ElZarrad, M.: FDA Issues Draft Guidances on Real-World Evidence, Prepares to Publish More in Future [accessed on 2022]. (2022). https://www.fda.gov/drugs/news-events-human-drugs/fda-issues-draft-guidances-real-world-evidence-prepares-publish-more-future
Cox, E., Martin, B.C., Van Staa, T., Garbe, E., Siebert, U., Johnson, M.L.: Good research practices for comparative effectiveness research: Approaches to mitigate bias and confounding in the design of nonrandomized studies of treatment effects using secondary data sources: The International Society for Pharmacoeconomics and Outcomes Research Good Research Practices for Retrospective Database Analysis Task Force Report–Part II. Value Health. 12(8), 1053–1061 (2009)
Crump, R.K., Hotz, V.J., Imbens, G.W., Mitnik, O.A.: Dealing with limited overlap in estimation of average treatment effects. Biometrika. 96(1), 187–199 (2009)
Danaei, G., Rodriguez, L.A., Cantero, O.F., Logan, R., Hernan, M.A.: Observational data for comparative effectiveness research: An emulation of randomised trials of statins and primary prevention of coronary heart disease. Stat. Methods Med. Res. 22(1), 70–96 (2013)
Dang, L.E., Gruber, S., Lee, H., Dahabreh, I.J., Stuart, E.A., Williamson, B.D., Wyss, R., Diaz, I., Ghosh, D., Kiciman, E., Alemayehu, D., Hoffman, K.L., Vossen, C.Y., Huml, R.A., Ravn, H., Kvist, K., Pratley, R., Shih, M.C., Pennello, G., Martin, D., Waddy, S.P., Barr, C.E., Akacha, M., Buse, J.B., van der Laan, M., Petersen, M.: A causal roadmap for generating high-quality real-world evidence. J. Clin. Transl Sci. 7(1), e212 (2023)
Desai, R.J., Wang, S.V., Sreedhara, S.K., Zabotka, L., Khosrow-Khavar, F., Nelson, J.C., Shi, X., Toh, S., Wyss, R., Patorno, E., Dutcher, S., Li, J., Lee, H., Ball, R., Dal Pan, G., Segal, J.B., Suissa, S., Rothman, K.J., Greenland, S., Hernan, M.A., Heagerty, P.J., Schneeweiss, S.: Process guide for inferential studies using healthcare data from routine clinical practice to evaluate causal effects of drugs (PRINCIPLED): Considerations from the FDA Sentinel Innovation Center. BMJ. 384, e076460 (2024)
Digitale, J.C., Martin, J.N., Glymour, M.M.: Tutorial on directed acyclic graphs. J. Clin. Epidemiol. 142, 264–267 (2022)
Dondo, T.B., Hall, M., West, R.M., Jernberg, T., Lindahl, B., Bueno, H., Danchin, N., Deanfield, J.E., Hemingway, H., Fox, K.A.A., Timmis, A.D., Gale, C.P.: beta-blockers and Mortality after Acute myocardial infarction in patients without heart failure or ventricular dysfunction. J. Am. Coll. Cardiol. 69(22), 2710–2720 (2017)
European Medicines Agency: ENCePP Guide on Methodological Standards in Pharmacoepidemiology [accessed on 2023]. (2023). https://www.encepp.eu/standards_and_guidances/methodologicalGuide.shtml
Ferguson, K.D., McCann, M., Katikireddi, S.V., Thomson, H., Green, M.J., Smith, D.J., Lewsey, J.D.: Evidence synthesis for constructing directed acyclic graphs (ESC-DAGs): A novel and systematic method for building directed acyclic graphs. Int. J. Epidemiol. 49(1), 322–329 (2020)
Flanagin, A., Lewis, R.J., Muth, C.C., Curfman, G.: What does the proposed causal inference Framework for Observational studies Mean for JAMA and the JAMA Network Journals? JAMA (2024)
U.S. Food and Drug Administration: Framework for FDA’s Real-World Evidence Program [accessed on 2018]. (2018). https://www.fda.gov/media/120060/download
Franklin, J.M., Schneeweiss, S.: When and how can Real World Data analyses substitute for randomized controlled trials? Clin. Pharmacol. Ther. 102(6), 924–933 (2017)
Gatto, N.M., Wang, S.V., Murk, W., Mattox, P., Brookhart, M.A., Bate, A., Schneeweiss, S., Rassen, J.A.: Visualizations throughout pharmacoepidemiology study planning, implementation, and reporting. Pharmacoepidemiol Drug Saf. 31(11), 1140–1152 (2022)
Girman, C.J., Faries, D., Ryan, P., Rotelli, M., Belger, M., Binkowitz, B., O’Neill, R.: and C. E. R. S. W. G. Drug Information Association. 2014. Pre-study feasibility and identifying sensitivity analyses for protocol pre-specification in comparative effectiveness research. J. Comp. Eff. Res. 3(3): 259–270
Griffith, G.J., Morris, T.T., Tudball, M.J., Herbert, A., Mancano, G., Pike, L., Sharp, G.C., Sterne, J., Palmer, T.M., Davey Smith, G., Tilling, K., Zuccolo, L., Davies, N.M., Hemani, G.: Collider bias undermines our understanding of COVID-19 disease risk and severity. Nat. Commun. 11(1), 5749 (2020)
Hernán, M.A.: The C-Word: Scientific euphemisms do not improve causal inference from Observational Data. Am. J. Public Health. 108(5), 616–619 (2018)
Hernán, M.A., Robins, J.M.: Using Big Data to emulate a target Trial when a Randomized Trial is not available. Am. J. Epidemiol. 183(8), 758–764 (2016)
Hernán, M., Robins, J.: Causal Inference: What if. Chapman & Hall/CRC, Boca Raton (2020)
International Society for Pharmacoeconomics and Outcomes Research (ISPOR): Strategic Initiatives: Real-World Evidence [accessed on 2022]. (2022). https://www.ispor.org/strategic-initiatives/real-world-evidence
International Society for Pharmacoepidemiology (ISPE): Position on Real-World Evidence [accessed on 2020]. (2020). https://pharmacoepi.org/pub/?id=136DECF1-C559-BA4F-92C4-CF6E3ED16BB6
Labrecque, J.A., Swanson, S.A.: Target trial emulation: Teaching epidemiology and beyond. Eur. J. Epidemiol. 32(6), 473–475 (2017)
Lanes, S., Beachler, D.C.: Validation to correct for outcome misclassification bias. Pharmacoepidemiol Drug Saf. (2023)
Lash, T.L., Fox, M.P., Fink, A.K.: Applying Quantitative bias Analysis to Epidemiologic data. Springer (2009)
Lash, T.L., Fox, M.P., MacLehose, R.F., Maldonado, G., McCandless, L.C., Greenland, S.: Good practices for quantitative bias analysis. Int. J. Epidemiol. 43(6), 1969–1985 (2014)
Leahy, T.P., Kent, S., Sammon, C., Groenwold, R.H., Grieve, R., Ramagopalan, S., Gomes, M.: Unmeasured confounding in nonrandomized studies: Quantitative bias analysis in health technology assessment. J. Comp. Eff. Res. 11(12), 851–859 (2022)
Loveless, B.: A Complete Guide to Schema Theory and its Role in Education [accessed on 2022]. (2022). https://www.educationcorner.com/schema-theory/
Lund, J.L., Richardson, D.B., Sturmer, T.: The active comparator, new user study design in pharmacoepidemiology: Historical foundations and contemporary application. Curr. Epidemiol. Rep. 2(4), 221–228 (2015)
Mai, X., Teng, C., Gao, Y., Governor, S., He, X., Kalloo, G., Hoffman, S., Mbiydzenyuy, D., Beachler, D.: A pragmatic comparison of logistic regression versus machine learning methods for propensity score estimation. Supplement: Abstracts of the 38th International Conference on Pharmacoepidemiology: Advancing Pharmacoepidemiology and Real-World Evidence for the Global Community, August 26–28, 2022, Copenhagen, Denmark. Pharmacoepidemiology and Drug Safety 31(S2). (2022)
Mullard, A.: 2021 FDA approvals. Nat. Rev. Drug Discov. 21(2), 83–88 (2022)
Onasanya, O., Hoffman, S., Harris, K., Dixon, R., Grabner, M.: Current applications of machine learning for causal inference in healthcare research using observational data. International Society for Pharmacoeconomics and Outcomes Research (ISPOR) Atlanta, GA. (2024)
Pearl, J.: Causal diagrams for empirical research. Biometrika. 82(4), 669–688 (1995)
Prada-Ramallal, G., Takkouche, B., Figueiras, A.: Bias in pharmacoepidemiologic studies using secondary health care databases: A sco** review. BMC Med. Res. Methodol. 19(1), 53 (2019)
Richardson, T.S., Robins, J.M.: Single World Intervention Graphs: A Primer [accessed on 2013]. (2013). https://www.stats.ox.ac.uk/~evans/uai13/Richardson.pdf
Richiardi, L., Bellocco, R., Zugna, D.: Mediation analysis in epidemiology: Methods, interpretation and bias. Int. J. Epidemiol. 42(5), 1511–1519 (2013)
Riis, A.H., Johansen, M.B., Jacobsen, J.B., Brookhart, M.A., Sturmer, T., Stovring, H.: Short look-back periods in pharmacoepidemiologic studies of new users of antibiotics and asthma medications introduce severe misclassification. Pharmacoepidemiol Drug Saf. 24(5), 478–485 (2015)
Rodrigues, D., Kreif, N., Lawrence-Jones, A., Barahona, M., Mayer, E.: Reflection on modern methods: Constructing directed acyclic graphs (DAGs) with domain experts for health services research. Int. J. Epidemiol. 51(4), 1339–1348 (2022)
Rothman, K.J., Greenland, S., Lash, T.L.: Modern Epidemiology. Wolters Kluwer Health/Lippincott Williams & Wilkins, Philadelphia (2008)
Rubin, D.B.: Causal inference using potential outcomes. J. Am. Stat. Assoc. 100(469), 322–331 (2005)
Sauer, B.V.: TJ. Use of Directed Acyclic Graphs. In Develo** a Protocol for Observational Comparative Effectiveness Research: A User’s Guide, edited by P. Velentgas, N. Dreyer, and P. Nourjah: Agency for Healthcare Research and Quality (US) (2013)
Schneeweiss, S., Rassen, J.A., Brown, J.S., Rothman, K.J., Happe, L., Arlett, P., Dal Pan, G., Goettsch, W., Murk, W., Wang, S.V.: Graphical depiction of longitudinal study designs in Health Care databases. Ann. Intern. Med. 170(6), 398–406 (2019)
Schuler, M.S., Rose, S.: Targeted maximum likelihood estimation for causal inference in Observational studies. Am. J. Epidemiol. 185(1), 65–73 (2017)
Stuart, E.A., DuGoff, E., Abrams, M., Salkever, D., Steinwachs, D.: Estimating causal effects in observational studies using Electronic Health data: Challenges and (some) solutions. EGEMS (Wash DC) 1(3). (2013)
Sturmer, T., Webster-Clark, M., Lund, J.L., Wyss, R., Ellis, A.R., Lunt, M., Rothman, K.J., Glynn, R.J.: Propensity score weighting and trimming strategies for reducing Variance and Bias of Treatment Effect estimates: A Simulation Study. Am. J. Epidemiol. 190(8), 1659–1670 (2021)
Suissa, S., Dell’Aniello, S.: Time-related biases in pharmacoepidemiology. Pharmacoepidemiol Drug Saf. 29(9), 1101–1110 (2020)
Tripepi, G., Jager, K.J., Dekker, F.W., Wanner, C., Zoccali, C.: Measures of effect: Relative risks, odds ratios, risk difference, and ‘number needed to treat’. Kidney Int. 72(7), 789–791 (2007)
Velentgas, P., Dreyer, N., Nourjah, P., Smith, S., Torchia, M.: Develo** a Protocol for Observational Comparative Effectiveness Research: A User’s Guide. Agency for Healthcare Research and Quality (AHRQ) Publication 12(13). (2013)
Wang, A., Nianogo, R.A., Arah, O.A.: G-computation of average treatment effects on the treated and the untreated. BMC Med. Res. Methodol. 17(1), 3 (2017)
Wang, S.V., Pottegard, A., Crown, W., Arlett, P., Ashcroft, D.M., Benchimol, E.I., Berger, M.L., Crane, G., Goettsch, W., Hua, W., Kabadi, S., Kern, D.M., Kurz, X., Langan, S., Nonaka, T., Orsini, L., Perez-Gutthann, S., Pinheiro, S., Pratt, N., Schneeweiss, S., Toussi, M., Williams, R.J.: HARmonized Protocol Template to enhance reproducibility of hypothesis evaluating real-world evidence studies on treatment effects: A good practices report of a joint ISPE/ISPOR task force. Pharmacoepidemiol Drug Saf. 32(1), 44–55 (2023a)
Wang, S.V., Schneeweiss, S., Initiative, R.-D., Franklin, J.M., Desai, R.J., Feldman, W., Garry, E.M., Glynn, R.J., Lin, K.J., Paik, J., Patorno, E., Suissa, S., D’Andrea, E., Jawaid, D., Lee, H., Pawar, A., Sreedhara, S.K., Tesfaye, H., Bessette, L.G., Zabotka, L., Lee, S.B., Gautam, N., York, C., Zakoul, H., Concato, J., Martin, D., Paraoan, D.: and K. Quinto. Emulation of Randomized Clinical Trials With Nonrandomized Database Analyses: Results of 32 Clinical Trials. JAMA 329(16): 1376-85. (2023b)
Westreich, D., Lessler, J., Funk, M.J.: Propensity score estimation: Neural networks, support vector machines, decision trees (CART), and meta-classifiers as alternatives to logistic regression. J. Clin. Epidemiol. 63(8), 826–833 (2010)
Yang, S., Eaton, C.B., Lu, J., Lapane, K.L.: Application of marginal structural models in pharmacoepidemiologic studies: A systematic review. Pharmacoepidemiol Drug Saf. 23(6), 560–571 (2014)
Zhou, H., Taber, C., Arcona, S., Li, Y.: Difference-in-differences method in comparative Effectiveness Research: Utility with unbalanced groups. Appl. Health Econ. Health Policy. 14(4), 419–429 (2016)
Funding
The authors received no financial support for this research.
Author information
Authors and Affiliations
Contributions
SH, NG, JS, AT, CC, MG are employees of Carelon Research, a wholly owned subsidiary of Elevance Health, which conducts health outcomes research with both internal and external funding, including a variety of private and public entities. XC was an employee of Elevance Health at the time of study conduct. YY was an employee of Carelon Research at the time of study conduct. SH, MG, and JLS are shareholders of Elevance Health. SdR receives funding from GlaxoSmithKline for a project unrelated to the content of this manuscript and conducts research that is funded by state and federal agencies.
Corresponding author
Ethics declarations
Competing interests
The authors declare no competing interests.
Additional information
Publisher’s Note
Springer Nature remains neutral with regard to jurisdictional claims in published maps and institutional affiliations.
Electronic supplementary material
Below is the link to the electronic supplementary material.
Rights and permissions
Open Access This article is licensed under a Creative Commons Attribution 4.0 International License, which permits use, sharing, adaptation, distribution and reproduction in any medium or format, as long as you give appropriate credit to the original author(s) and the source, provide a link to the Creative Commons licence, and indicate if changes were made. The images or other third party material in this article are included in the article’s Creative Commons licence, unless indicated otherwise in a credit line to the material. If material is not included in the article’s Creative Commons licence and your intended use is not permitted by statutory regulation or exceeds the permitted use, you will need to obtain permission directly from the copyright holder. To view a copy of this licence, visit http://creativecommons.org/licenses/by/4.0/.
About this article

Cite this article
Hoffman, S.R., Gangan, N., Chen, X. et al. A step-by-step guide to causal study design using real-world data. Health Serv Outcomes Res Method (2024). https://doi.org/10.1007/s10742-024-00333-6
Received:
Revised:
Accepted:
Published:
DOI: https://doi.org/10.1007/s10742-024-00333-6