Abstract
Natural population growth is an intrinsic property of demographic systems that depends on (spatially) non-stationary processes of fertility and mortality. Assuming distinctive demographic dynamics as a characteristic attribute of urban, suburban and rural systems, analysis of spatial variability in natural population growth delineates nonlinear stages of metropolitan expansion, possibly reflecting divergent responses to socioeconomic stimuli. The present study investigates endogenous population growth (1956–2019) and the relationship with demographic density as basic attributes of individual stages of the city life cycle in Athens (Greece), a mono-centric metropolitan region in Southern Europe. A spatially explicit analysis of natural balance rates at local scale identified two stages of growth, namely compact urbanization (mid-1950s to late 1970s)—with agglomeration strengthening the polarization in demographically dynamic and shrinking districts—and spatially decentralized suburbanization (early 1980s to late 2010s)—with a less defined role of agglomeration economies and more heterogeneous demographic processes. However, the impact of population density on endogenous growth was stronger in recent decades, suggesting how demographic dynamics may still respond to agglomeration stimuli, at least during recessions. At the same time, the spatial structure of natural balance rates became more mixed, likely reflecting the importance of heterogeneous demographic behaviors at the individual level.
1 Introduction
Designing frameworks that investigate the long-term evolution of metropolitan systems is a challenging issue in both urban science and regional demography (Berry, 1976; Bocquier & Bree, 2018; Capello et al., 2015; Scott & Storper, 2015). Although cities have envisaged as open systems, their evolutionary trajectories reveal peculiarities that often reflect a self-organized, decentralized development (Carbonaro et al., 2018; Di Feliciantonio et al., 2018; Martinez-Fernandez et al., 2012). Nonlinear interactions among composing elements—intended as a basic characteristic of self-organized metropolitan systems—imply the sharp influence of economic shocks amplifying internal fluctuations (and external perturbations) in urban populations (Salvati & Serra, 2016). Such alterations impact a given system’s trajectory causing persistence (or increased volatility) of the related socioeconomic context at both regional and local scale (Benassi & Salvati, 2020; Buzar et al., 2007; Hoekveld, 2015).
Analysis of metropolitan systems was grounded on evaluation of their intrinsic dynamics and the emergence of latent, critical properties (Kabisch & Haase, 2011). Selection of properties at the base of long-term evolution of urban regions is a key aspect of ‘complex system’ thinking (Salvati et al., 2016). While properties are sometimes identified with specific attributes of local communities (Van Nimwegen, 2013), a particular attention should be deserved to processes regulating size and distribution of population and settlements (Coleman, 2008; Lutz et al., 2006; Vobetkà & Piguet, 2012). These are reflective of patterns that depend on both speed and intensity of their spatial interactions at different geographical scales (Serra et al., 2014). In these regards, interpretation and prediction of metropolitan cycles are relevant to both stakeholders, policymakers, and practitioners (Arbaci & Tapada-Berteli, 2012; Champion, 2001; Hank, 2001). Distinctive, local-scale development paths make identification of cycle’s stages a particularly challenging task that requires a nonlinear exploratory understanding of complex demographic dynamics (Rontos et al., 2016; Salvati et al., 2013; Zambon et al., 2017).
Complexification of urban trends worldwide confirms the importance of novel approaches to analysis of demographic transformations in metropolitan regions (Domingo & Gil-Alonso, 2007). In a context of social fragmentation and economic uncertainty (Dura-Guimera, 2003; Panori et al., 2019; Vaughan & Arbaci, 2011), such dynamics involve adaptive agents and communities with a consolidated ability to growth and change (Dijkstra et al., 2015; Liu, 2005; Martinez-Fernandez et al., 2012). Being criticized for rigid assumptions—mainly on the existence of linear and sequential expansion waves (Morelli et al., 2014)—predictions of the ‘spatial cycle theory’ identify basic patterns and processes of growth (i.e., the urbanization–suburbanization–counterurbanization–reurbanization sequence), and provide a partial (and sometimes, biased) interpretation of metropolitan transformations, and the associated demographic dynamics (e.g., Cuberes, 2011; Di Feliciantonio & Salvati, 2015; Lerch, 2013, 2019).
On the contrary, system thinking provides a coherent representation of economic and territorial dynamics, emphasizing the emergence and consolidation of new urban structures, socioeconomic functions, and the aggregate demographic response to metropolitan change (Boyle, 2003; Buzar et al., 2007; Carbonaro et al., 2018; Salvati et al., 2016). Assuming spatial heterogeneity in demographic processes as a basic property of adaptive metropolitan systems, a spatially explicit analysis of population dynamics based on appropriate statistical indicators may provide a refined interpretation of complex mechanisms of urban growth (Bayona & Gil-Alonso, 2012). Flexible, exploratory approaches were proposed to delineate growth waves (e.g., Salvati & Serra, 2016), bringing an original contribution to urban science, regional demography, applied economics, and spatial planning (Coleman, 2006; Lee & Reher, 2011; Rubiera Morollòn et al., 2016).
Complex relationships between form and functions require a careful analysis of metropolitan growth, assuming that the progressive delocalization of population, settlements, and activities—a dominant trend in advanced economies—has fueled social change and local development (Berry, 1976). Cities underwent intense demographic changes as a result of fertility decline, mortality at older ages, and reduction in international immigration with crisis (Couch et al., 2007). While accelerated population dynamics were observed in central districts of some metropolises responding to re-urbanization impulses, other cities were intrinsically bounded in a sort of ‘late suburbanization,’ experiencing fringe expansion and shrinkage of inner districts and rural areas (Salvati and De Rosa, 2014). By increasing social disparities, economic downturns have affected demographic dynamics and contributed to different stages of the metropolitan cycle in a distinctive manner (Garcia-Lopez, 2010). Higher suburban fertility and differential mortality rates between central and peripheral locations explain the intrinsic variation of endogenous population growth in metropolitan regions (e.g., Gavalas et al., 2014).
Fringe settlements were considered dynamic contexts because of particularly high fertility and low mortality (Kulu & Boyle, 2009). However, despite a wealth of macro/micro-information on the contribution of economic conditions on long-term population dynamics, empirical analyses document the validity of this assumption only partly and exclusively for recent decades (e.g., Hatz, 2009; Helbich, 2012; Nijkamp & Kourtit, 2013). In this perspective, analyses of economic processes at the base of endogenous population dynamics contribute to holistic understanding of metropolitan growth and informed design of developmental policies toward resilient urbanization processes (Carlucci et al., 2018). Research on the intimate nexus of local development with population dynamics and economic agglomeration may orient urban strategies and spatial planning toward environmental sustainability and social equity (Chelleri et al., 2015; Chorianopoulos et al., 2010; Domingo & Gil-Alonso, 2007).
The present study investigates endogenous population dynamics as a latent property of a given metropolitan system, integrating knowledge and methodologies of urban science with a spatially explicit approach typical of regional demography (Balbo et al., 2013; Billari & Kohler, 2004; Bocquier & Bree, 2018). More specifically, our study delineates the intrinsic linkage between urban cycles and spatial heterogeneity in a representative demographic indicator, illustrating how the inherent shift in the spatial regime of natural population balance rates may contribute to a refined identification of distinctive stages of a given cycle (Champion, 2001). By shedding further light on long-term mechanisms of urban expansion, these findings suggest the appropriateness of an explicit analysis of agglomeration and the role of social contexts (e.g., Salvati et al., 2019), achieving a comparative overview of long-term development paths under volatile social conditions and heterogeneous economic downturns (Coleman, 2008; Kabisch et al., 2012; Kurek et al., 2015).
Sequential and irregular phases of expansion and decline have characterized cities at the ‘European periphery’ for a long time (Carlucci et al., 2017). For instance, processes of urbanization without industrialization qualified Mediterranean cities as representative examples of a class of metropolises under a sort of ‘persistent crisis,’ whose boundaries encompass economic, social, demographic, and territorial conditions (Delladetsima, 2006; De Muro et al., 2011; Salvati and De Rosa, 2014). While Southern European cities have experienced an intense transformation of socio-demographic structures (Benassi & Salvati, 2020), a complete expansion cycle—with population dynamics intrinsically correlated with urban agglomeration—was rarely investigated in this region (Morelli et al., 2014).
In such a perspective, the individual contribution of vital dynamics and migration to urban population growth requires additional conceptualization in the Mediterranean region (Balbo et al., 2013; Gavalas et al., 2014; Kabisch & Haase, 2011; Lesthaeghe, 2010). While migration balance was taken as the main engine of urban growth in advanced economies—especially when the local effects of the first demographic transition slowed down—this component was increasingly volatile in Mediterranean cities (Cuadrado Ciuraneta et al., 2017; Panori et al., 2019; Perez, 2010; Rontos et al., 2016). Using data that cover a relatively long time period (1985–2015), a recent study by Menashe-Oren and Bocquier (2021) demonstrated how urbanization is no longer driven by migration in low- and middle-income countries. Focusing on different data and approaches, Benassi and Salvati (2020) reached the same conclusion for some European countries.
Taking specific motivation from such empirical findings, our study assumes natural balance as a spatially robust attribute of local communities, both urban and rural (Kroll & Kabisch, 2012), since it reflects the intrinsic population age structure—a basic characteristic of local systems (Kabisch et al., 2012; Kulu & Boyle, 2009; Lerch, 2013). Moreover, natural balance contributed to total population growth more intensively during crisis times, because of the inherent decline of migration flows (Bayona & Gil-Alonso, 2012; Vobetka & Piguet, 2012), reflecting—at least indirectly—the impact of sequential economic downturns (Hatz, 2009; Helbich, 2012). Finally—considering together the impact of temporary fertility recovery (or decline) and progressive aging—natural balance responds less rapidly than migration balance to external shocks (Billari & Kohler, 2004; Kurek et al., 2015; Liu, 2005), and for such reason may represent—better than other indicators—a reliable proxy of long-term demographic patterns and processes (Menashe-Oren & Bocquier, 2021). Endogenous population growth slowed down (more or less rapidly) in the last years following a generalized population aging in advanced economies (Van Nimwegen, 2013). COVID-19 pandemic has accelerated such dynamics, both impacting mortality rates (positively) and fertility rates (negatively).
Based on these premises, how recent population dynamics influence, and possibly redesign, metropolitan systems, require an extensive investigation. The present work investigates long-term endogenous population dynamics in Athens (Greece) with the final aim at identifying distinctive ‘demographic’ stages of long-term metropolitan growth. The study covers a time interval between 1956 and 2019 using official statistics and administrative analysis’ units. Athens has been regarded as a paradigmatic example of social stratification, economic fragmentation, and deregulated planning intimately associated with a complex interplay of demographic forces (Cecchini et al., 2019; Chorianopoulos et al., 2010; De Rosa and Salvati, 2016; Gospodini, 2009; Salvati et al., 2013). Considering together the impact of economic downturns, social dynamics, demographic transitions, and territorial transformations, results of a specific analysis of population density and natural balance were generalized to broader contexts as a novel contribution to population science and urban theory.
2 Methodology
2.1 Study area
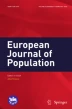
The study area covers the largest part of the administrative region of Attica in Central Greece, and coincides with the Urban Atlas Athens’ metropolitan region (https://land.copernicus.eu/local/urban-atlas/urban-atlas-2018). Seven regional units (Central, Western, Northern and Southern Athens, Piraeus, Western and Eastern Attica) and 115 municipalities administer a surface land extending 3025 km2 with 3.7 million resident inhabitants (Fig. 1). Most of the population (3.1. million inhabitants) settled in 56 municipalities of the Greater Athens’ area (430 km2). As a typical industrial city up to the late 1940s, Athens has experienced a shift toward advanced services and tourism, kee** a strong economic base grounded on construction, commerce, and public administration (Di Feliciantonio et al., 2018). Metropolitan growth has been particularly intense since the 1950s, and the highest population concentration was recorded in the 1970s (> 15,000 inhabitants/km2). Dispersed and discontinuous settlements expanded along the sea coastline since the late 1970s (Fig. 2).

A map illustrating the administrative structure of the Athens’ metropolitan region (left) and the position of the study area in Greece (right)

Expansion of urban fabric in the Athens’ metropolitan region (left: 1948; middle: 1975; right: 2018; black indicates settlements)
Athens’ population increased substantially between 1951 and 2020 from 1.5 to 3.7 million inhabitants (Chorianopoulos et al., 2014). A young demographic structure characterized post-war Athens, leading to positive natural balances until the great recession (2010). In the last decade, natural balance rates decreased to values below 1, with total deaths stably overpassing total births. Natural balance felt to 0.72 in 2020, the lowest value ever recorded in the area, and is estimated at 0.69 in 2021, because of the inherent decline of fertility and rising mortality as a consequence of COVID-19 pandemic (Fig. 3). Migrations have fueled demographic dynamics in Attica until the early 1970s (Rontos et al., 2016); migration balance was positive but declining progressively in the following decade (Gounaridis et al., 2018), and recovering only moderately in the 1990s and the 2000s (Salvati, 2016). With recession, migration balance turned out to be negative (Panori et al., 2019).

Natural population balance in the Athens’ region, 2013–2021* (*provisional estimate)
2.2 Indicators
Long-term population dynamics in Athens and the intrinsic relationship with agglomeration processes were investigated using vital statistics (births and deaths) collected and disseminated by ELSTAT (National Statistical Authority of Greece, Piraeus) by year and municipality. Municipalities represent an easily interpretable analysis’ scale that allows estimation of the impact of multiple socioeconomic conditions on the intrinsic mechanisms governing metropolitan growth (Gil-Alonso et al., 2016; Rontos et al., 2016; Salvati et al., 2019). Based on these figures, we calculated the natural population growth rate at 8 years over the study period (1956, 1960, 1970, 1980, 1990, 2000, 2009, and 2019). This time schedule allowed a comparative analysis of population dynamics under different socio-demographic contexts, i.e., covering the transition from high to low fertility—and from high to low mortality (Lerch, 2019; Lesthaeghe, 2010; Liu, 2005). At the same time, the enough long time interval investigated here makes possible the estimation of (direct and/or indirect) impacts of economic expansions and recessions (Lee & Reher, 2011).
Natural balance was calculated as the crude rate of births-to-deaths, reflecting changes over time in the number of births over 100 deaths (Menashe-Oren & Bocquier, 2021). Taken as the local outcome of natural population growth, this index assumes values above one when births exceed deaths (net (natural) population growth) and below-one values when deaths exceed births (net (natural) population shrinkage). Natural balances were aggregated within concentric rings at increasing distances from downtown Athens (< 10 km, 10–20 km, 20–30 km, > 30 km). These partitions provided an overview of long-term population dynamics in urban, suburban, and rural districts (Morelli et al., 2014). Assuming Athens as a purely mono-centric model (Salvati & Serra, 2016), population density derived from diachronic census data (1951, 1961, 1971, 1981, 1991, 2001, and 2011) was considered representative of agglomeration processes at the municipal scale (Salvati et al., 2013).
2.3 Data analysis
We adopted a multi-step analysis considering together descriptive statistics, map**, nonparametric correlations, hierarchical clustering, and regression models (both parametric and nonparametric, under both spatially implicit and spatially explicit logic). These statistical techniques identify characteristic trends of natural population growth in the study area, elaborating on data structures intrinsically complex over time and space (Salvati & Serra, 2016). Integration of different analytical tools contributes to a better identification of (apparent and latent) relationships between population dynamics and agglomeration processes (Di Feliciantonio & Salvati, 2015), profiling individual stages of a complete city life cycle (Ciommi et al., 2019).
2.3.1 Descriptive statistics
The statistical distribution of natural balance (crude rates) across municipalities was preliminary analyzed computing nine metrics of central tendency (arithmetic mean), dispersion (coefficient of variation, normalized range, percentile range), and form (median-to-mean ratio, harmonic-to-arithmetic mean ratio, geometric-to-arithmetic mean ratio, kurtosis, asymmetry). Changes over time in central tendency, dispersion, and form metrics were reflective of the inherent shift in the spatial regime of endogenous population growth at the base of distinct stages of metropolitan growth (Benassi & Salvati, 2020). Choropleth maps have been realized to illustrate the spatial distribution of natural balance by year and municipality. Average natural balance rates were finally tabulated aggregating municipalities within one of five geographical belts at increasing distances (km) from downtown Athens (Morelli et al., 2014): (i) the central municipality of Athens, (ii) municipalities < 10 km far away from Athens (including Piraeus and the largest part of the Greater Athens’ centers), (iii) municipalities at a distance between 10 and 20 km from Athens (including most of Athens’ suburbs), (iv) municipalities at a distance between 20 and 30 km from Athens (including rural, dynamics areas in Messoghia and Thriasio districts), and (v) municipalities > 30 km far away from Athens (including rural, peripheral locations in Attica).
2.3.2 Correlation analysis
To identify similarities or abrupt changes in endogenous population dynamics over time, the statistical distribution of natural balance (crude rates) across municipalities was compared at two consecutive time points (e.g., 1956 vs. 1960, 1960 vs. 1970,…, 2009 vs. 2019) testing for both linear and nonlinear associations. Bravais-Pearson linear coefficients, nonparametric Spearman rank coefficients, and Kendall co-graduation coefficients, were run on the whole sample of 115 municipalities testing for significant correlations at p < 0.05 after application of the Bonferroni’s correction for multiple comparisons (Salvati et al., 2019). Similar values of Pearson, Spearman, and Kendall coefficients indicate a linear association between variables (Ciommi et al., 2019).
2.3.3 Hierarchical clustering
To explore aggregate demographic trends over a sufficiently long time interval in Athens, hierarchical clustering based on Euclidean distances’ amalgamation measure and Ward’s agglomeration rule was run on a data matrix including descriptive statistics illustrated above (nine columns) by years (eight rows). Hierarchical clustering is a multivariate technique producing dendrograms that allow investigation of complex data matrices under the assumption that both cases and variables will simultaneously contribute to the uncovering of meaningful latent patterns (Di Feliciantonio et al., 2018). To identify temporal breakpoints and spatial discontinuities in long-term demographic dynamics, hierarchical clustering was run separately on a data matrix including natural balance (crude rates) at 8 years (columns) and 115 municipalities (rows).
2.3.4 A spatially explicit analysis of natural balance
This study makes extensive use of spatially explicit approaches with the aim at assessing changes over time in the spatial structure of natural balance rates that may reflect distinctive stages of the Athens’ expansion (Rontos et al., 2016). A global Moran’s index of spatial autocorrelation (z-score) was calculated for natural balance rates at three bandwidths (5, 20, and 40 km), testing for spatial dependence at p < 0.01. Changes over time in Moran’s coefficients at different bandwidths estimate intensity and extent of spatial interactions between the elementary analysis’ domains over the study area (Salvati et al., 2019). Significant z-scores indicate a spatial pattern toward clustering at a given bandwidth, and non-significant scores indicate spatial heterogeneity in natural balance rates (Salvati & Serra, 2016). A diachronic analysis of dynamic and shrinking clusters was run calculating local Moran’s coefficients of spatial autocorrelation (z-scores) for each municipality of the study area (Morelli et al., 2014). Scores were calculated separately for each time interval and illustrated using choropleth maps (Serra et al., 2014). Based on the local Moran’s coefficient, municipalities were classified as (i) hotspots of endogenous population growth (labelled as ‘HH’) or decline (‘LL’) when z-score > 2, or (ii) locations with heterogeneous local dynamics delineating a steep gradient of growth-to-decline (‘HL’) or decline-to-growth (‘LH’) when z-score < -2.
2.3.5 Testing the role of density gradients in endogenous population dynamics
The relationship between natural balance and population density was investigated using a U-shaped, polynomial model that assumes a highly positive natural balance at intermediate distances from the inner city (suburban locations) and a less intense (positive or even negative) natural balance at both lower (urban locations) and higher (rural locations) distances (e.g., Lutz et al., 2006). Taking Athens as a mono-centric region (Morelli et al., 2014), this hypothesis is in line with the prediction of the ‘suburban fertility hypothesis’ (Kulu, 2013). For each decade, model’s goodness-of-fit was estimated considering the adjusted global R2, the Akaike Information Criterion (AIC) and a Fisher–Snedecor F statistic testing for significance at p < 0.01 against the null hypothesis of a non-significant model. The highest (estimated) value of population density (Max(d)), and the highest (estimated) value of natural balance (Max(n)) were also reported.
The outcomes of the polynomial model were compared with results of a nonparametric spline regression carried out separately by year using the same dependent variable (natural balance) and predictor (population density) at the municipal scale. These data were fitted to a smoothing spline, a sequence of third-order polynomials continuous up to the second derivative. Multiple data points at the same X value were collapsed to a single point by weighted averaging and calculation of a combined standard deviation using a “LOWESS” (LOcally WEighted Scatterplot Smoothing) algorithm (Cleveland, 1981). Given a number of points n and a smoothing parameter q, the algorithm fits the nq points around each point to a straight line, with a weighting function decreasing with distance. The new smoothed point is the value of the fitted linear function at the original x position. Based on these results, (i) window width, (ii) the highest (estimated) value of population density (Max(d)), and (iii) the highest (estimated) value of natural balance (Max(n)) were reported.
2.3.6 Identifying a local relationship between natural balance and population density
Local-scale variability in the relationship between natural balance and population density was investigated with the use of Geographically Weighted Regressions (GWR) producing global and local models (Benassi & Salvati, 2020). To identify significant predictors of the spatial variability in natural balance rates, a GWR model was specified where natural balance is the dependent variable at location s (a given municipality), and municipal population density (inhabitants/km2) as the predictor. To investigate the distinctive contribution of multiple stages of the City Life Cycle, GWRs were run separately for each time interval, and provide a dynamic distribution of estimated parameters (adjusted R2 and slope coefficients) at both global (study area) and local (municipal) scale (Carlucci et al., 2018). Maps illustrating the local-scale impact of population density and the goodness of fit (adjusted R2) of each model summarized the spatial outcomes of regression analysis (Salvati et al., 2019).
3 Results
3.1 Changes over time in the spatial distribution of natural population balance
Descriptive statistics were used to illustrate long-term population trends characteristic of the Athens’ metropolitan region (Table 1). Natural balance decreased from 3.0 (1956) to 0.8 (2019), with the only exception of 2009. The ratio of median-to-mean crude rates of natural balance decreased between 1956 (0.94) and 1980 (0.85), reflecting the increased polarization in demographically dynamic and stagnant districts. The maximum value of the coefficient of variation in natural balance rates across municipalities observed in 1980 confirmed the intrinsic consolidation of this demographic divide. The percentile (75th–25th) range followed the same trend over time. In recent decades, this index displayed a more balanced and symmetric statistical distribution that reflects demographically stagnant communities. Kurtosis, asymmetry, and normalized range indicated 1990 and 2019 as the years with an irregular distribution of natural balance rates. The largest asymmetry across municipalities was associated with a particularly low fertility, observed in Greece at the beginning of the 1990s and at the end of the 2010s.
A hierarchical clustering was run with the aim at identifying similarities over time in the descriptive statistics reported above (Fig. 4, left). Results of the analysis were illustrated in a dendrogram clustering together arithmetic average and the normalized range of natural balance rates. A second cluster included dispersion measures (coefficient of variation, percentile range) and distributional metrics (median-to-mean, the ratios of geometric mean (or harmonic mean) to arithmetic mean, and asymmetry). Kurtosis was classified as an outlier. A separate dendrogram evidenced how the spatial distribution of natural balance rates was comparable between 1956 and 1980 and between 1990 and 2019 (Fig. 4, right). Hierarchical clustering identified two different spatial regimes in natural balance rates, respectively, associated with high fertility and low mortality (1956–1980), and low fertility and high mortality (1990–2019).

Hierarchical clustering (Euclidean distance and Ward agglomeration rule) profiling similarities (left) in the metrics assessing the spatial distribution of natural balance rates and (right) in the statistical distribution of natural balance rates over time
Despite a continuous fertility decline and huge increase in mortality, the evolution of natural balance over time was differentiated at the regional scale (Fig. 5). Downtown Athens’ natural balance maintained above 1 up to the early 1990s and decreased in the subsequent decades. Rural municipalities (> 30 km from central Athens) experienced a continuous decline from 2 to 1. The most intense decreases were observed in peri-urban spaces: natural balance reduced from 3.5 (1956) to 0.9 (2019) in the Greater Athens’ area. A temporary fertility recovery in 2009 was not enough intense to push natural balance above 1.5. Fringe municipalities (10–20 km far from Athens) had a dynamic population (three births out of one death in 1956) recovering after the 1990s decline (two births out of one death in 2009). A particularly intense decline, however, was observed in 2019. Municipalities at intermediate distances from Athens (20–30 km) had a less dynamic population, with diverging natural balance trends in regard to both strictly urban and more rural contexts.

Natural balance dynamics by distance from downtown Athens (km) and year
Maps of natural balance (Fig. 6) indicate that complex spatial patterns were more evident in correspondence with urban concentration (1980) and fertility recovery (2009). The most rapid change in the spatial distribution of natural balance rates was observed in 1980. These findings are in line with results of a pair-wise correlation analysis of natural balance rates across municipalities at two consecutive time points. The highest correlation (i.e., reflecting the same spatial regime) was observed for 1970 and 1980 (Table 2); parametric and nonparametric correlations provided similar results. The degree of correlation decreased in the subsequent period, reaching the minimum value for 2009 and 2019. More heterogeneous natural balance rates over space were associated with low fertility levels.

Spatial distribution of natural balance by year and municipality in the study area (crude rates < 1 indicate declining populations)
3.2 A spatially explicit analysis of natural population balance
A global Moran autocorrelation index run at three bandwidths (5 km, 20 km, and 40 km) was run to investigate the spatial structure of natural balance rates, assumed to reflect demographic dynamics at different spatial scales (from local to regional). Results indicate a significant dependence regime in the spatial distribution of natural balance rates (Table 3). Moran’s coefficients were always statistically significant, and a more intense spatial dependence was recorded at the intermediate bandwidth (20 km). However, spatial autocorrelation rates decreased quite rapidly over time, with the exception of 2009. The most intense spatial dependency was recorded for 1960 and 2009; the less intense spatial structure was observed for 2019. The degree of spatial autocorrelation was directly correlated with natural population growth rates. Higher growth rates were intrinsically associated with clustered spatial structures.
Local Moran indexes of spatial autocorrelation (Fig. 7) delineate the spatial structure of natural population balance in Athens. High–High hotspots indicate demographically dynamic and homogeneous socioeconomic conditions in fringe districts West of Athens. An intense polarization in high–high (peri-urban) and low–low (rural) clusters was observed between 1956 and 1980. Since 1990, only rural and peripheral municipalities West of Athens were classified as low–low hotspots. In 2009, sparse municipalities (both rural and urban) were classified as low–low hotspots, confirming the intrinsic dynamism of fringe districts. Despite a strong decline in fertility and increased mortality rates, the 2019 spatial structure of natural balance rates was similar to those observed in earlier years.

Local Moran’s spatial autocorrelation coefficient by year in the study area (High–High hotspot: HH, Low–Low hotspot: LL, High–Low cluster: HL, Low–High cluster: LH)
3.3 Spatial variability of natural population balance along density gradients
The relationship between population density and natural balance was tested at the municipal scale separately for each of the 8 years under investigation using three models (square polynomial, LOWESS spline, and Geographically Weighted Regression). Results of polynomial fits and LOWESS splines are given in Table 4. A comparative analysis of models’ goodness-of-fit is shown in Fig. 8. These models produced comparable results for years 1956, 1960, 1970, and 1980, delineating a relatively weak role of density in endogenous population growth. Adjusted R2 ranged between 0.15 and 0.25 for all models and decreased between 1990 and 2019, with the exception of Geographically Weighted Regressions (global R2 coefficients between 0.3 and 0.4 in 2009 and 2019). Depending on the observation year, the highest rates of natural population balance were estimated in correspondence with densities between 900 and 2500 inhabitants/km2. The corresponding estimate of population balance decreased from 3.5 (1956) to 0.9 (2019). A similar trend was observed for LOWESS spline estimators. The highest rate of natural population balance was estimated at a density of 3500 inhabitants/km2 (1970). Natural balance was the highest in demographically dynamic contexts at intermediate densities (fringe districts and suburban municipalities). The highest natural balance rates were observed at higher densities at the end of compact urbanization (1980), and at lower densities at the end of suburbanization (2019).

Trends over time in global R2 coefficients of models regressing natural balance rates against population density (log-transformed) in the study area
In line with findings of hierarchical clustering (Fig. 4) and spatially implicit regressions (Fig. 8), GWR results (local R2 and slope coefficients) confirm the existence of two spatial regimes characteristic of the relationship between population density and natural balance. Local R2 coefficients decreased from rural areas to urban contexts (Fig. 9). Local regression coefficients were positive and significant in both rural and peri-urban municipalities. These findings document the higher rates of natural balance at medium–high densities between 1956 and 1980. Results for years between 1980 and 2019 outline a different spatial regime. Model’s best fit was recorded in sparse and marginal locations, reflecting a spatially heterogeneous relationship between population density and natural balance. Local regression coefficients were positive in peripheral municipalities of Northern and Eastern Attica and negative in central locations. These results confirm the progressive shrinkage of inner Athens.

Results of a Geographically Weighted Regression with natural balance rate as dependent variable and population density as predictor (upper line: local R2; lower line: spatial distribution of significant (p < 0.05) slope coefficients by sign)
4 Discussion
While demographic transitions have contributed largely to metropolitan transformations in Europe, the role of vital dynamics and migration was heterogeneous over time and space (Hank, 2001; Van Nimwegen, 2013; Vobetkà & Piguet, 2012). Recognized as the most effective driver of metropolitan growth in the 1990s and the 2000s, migration decreased with 2007–2008 recession. Especially in Southern Europe, one of the most affected regions in the continent, emigration at working age—especially younger people, university students, and high-tech professionals—rose significantly, minimizing the contribution of migration in total population growth (Benassi & Salvati, 2020). COVID-19 pandemic accelerated this process, reducing rural-to-urban divides and fueling counterurbanization (but see also Gkartzios, 2013).
With this perspective in mind, analysis of long-term variations in endogenous population growth contributes to a more comprehensive understanding of demographic dynamics in Mediterranean urban areas. More specifically, our study investigates natural population balance to shed further light on (apparent and latent) mechanisms of metropolitan growth (Bocquier & Bree, 2018). Latent trends in natural balance components allow identification of the socioeconomic factors more polarized along density gradients, shedding light on differential patterns of urban and suburban growth (Di Feliciantonio et al., 2018; Dura-Guimera, 2003; Perez, 2010). Likely for the first time in literature, our study interpreted such dynamics in a holistic perspective, delineating the intrinsic relationship between location factors, social change, territorial and population trends in the study area (Salvati & Serra, 2016).
The empirical results of our study outline a breakpoint in the spatial structure of natural balance rates in the early 1980s. Endogenous population growth rates were higher in urban and peri-urban areas between the mid-1950s and the late-1970s. The reverse pattern was observed between 1980 and 2019, when accelerated demographic dynamics characterized fringe locations and more remote districts (Chorianopoulos et al., 2010). The spatial structure of natural balance was clustered since the early 1980s, and became less clustered in the subsequent decades, reflecting the impact of heterogeneous micro-demographic behaviors. At the same time, natural balance showed a distinctive response to economic downturns—being less dependent on the background context (Panori et al., 2019). These findings document how endogenous population dynamics (and the spatial structure of the related growth rates) delineate distinctive stages of a metropolitan cycle (Salvati et al., 2016). The existence of an intermediate group of municipalities (in-between urban and rural locations) with accelerated population growth is in line with empirical studies qualifying suburbs as the most dynamic places in contemporary metropolitan regions—thanks to the positive impact of higher fertility (e.g., the ‘suburban fertility hypothesis’ sensu Kulu, 2013) and younger age structures, with intrinsically lower death rates (Gavalas et al., 2014).
In contrast with the predictions of the ‘city life cycle’ theory (i.e., prefiguring four stages of growth, from urbanization to re-urbanization: Van den Berg et al., 1982), analysis of diachronic indicators (land-use, demography, economic structure, and social transformations), together with an extensive literature (e.g., Chorianopoulos et al., 2014; Gospodini et al., 2009; Morelli et al., 2014; Rontos et al., 2016; Salvati & Serra, 2016), delineates only two distinctive growth stages in Athens (compact urbanization, 1956–1980, and dispersed suburbanization, 1980–2019), emphasizing the correspondence of our interpretative model with urban reality (Table 5). Exogenous population growth is the result of (i) the intimate structure of population by age, dependent on past trends (e.g., demographic transitions), (ii) the net impact of economic downturns on population dynamics, and (iii) the increasing importance of the social background at both the community and individual levels (Gil-Alonso et al., 2016; Nijkamp & Kourtit, 2013; Rubiera-Morollòn et al., 2016). The prevalence of one dimension against the others prefigures a specific direction of growth in the study area (Salvati et al., 2013).
The first time period (1956–1980) reflected homogeneous processes of urban expansion responding rapidly to economic stimuli and less rapidly to social change, under demographic dynamics typical of the first transition and territorial transformations associated with compact/vertical growth, intense building activity, and moderate (per-capita) land consumption (Gkartzios, 2013; De Rosa and Salvati, 2014; Di Feliciantonio et al., 2018). The second period (1980–2019) corresponded with heterogeneous processes of urban expansion responding more rapidly to social change than to economic stimuli. The underlying population dynamics were typical of the second demographic transition (Balbo et al., 2013), with territorial transformations being associated with discontinuous and horizontal growth, moderate building activity, and intense (per-capita) land consumption (Bayona & Gil-Alonso, 2012; Benassi & Salvati, 2020; Cecchini et al., 2019).
This classification confirms the importance of three dimensions characteristic of the long-term distribution of natural population balance across municipalities in Athens. First, the intrinsic linkage between average and spatial variability in natural balance suggests how spatially homogeneous rates were associated with less dynamic (demographic) contexts (Gounaridis et al., 2018). Second, a strong similarity between spatial heterogeneity and distribution metrics (i.e., symmetry) indicates how spatial heterogeneity was intrinsically associated with a normal distribution of natural balance rates (Rontos et al., 2016). Third, the most intense demographic polarization in urban and rural areas was observed in 1980, being associated with an asymmetric spatial distribution of natural balance rates across municipalities (Morelli et al., 2014). Global and local models performed better respectively in the first (1956–1980) and second (1980–2019) time interval. In recent times, these results suggest how local models have captured more efficiently the latent heterogeneity associated with individual behaviors and (rapidly evolving) social contexts (e.g., Arbaci & Tapada-Berteli, 2012; Salvati et al., 2019; Serra et al., 2014).
The empirical results of this study definitely demonstrate that the contribution of endogenous population growth to total growth was very heterogeneous and depends on the specific phase of the metropolitan cycle. These findings encompasses the specificity of the Athens’ case, and give some pertinent insights to a more general investigation of urban-demographic dynamics in European metropolitan regions. For instance, reconnecting local-scale demographic dynamics with the City Life Cycle theory demonstrates how endogenous population growth (and, more relevant, its contribution in total growth) is dependent on the specific stage of the cycle (e.g., urbanization, suburbanization). Linking basic population dynamics with the (rapidly) evolving socioeconomic context in a comparative perspective was the approach used here to test this hypothesis. Our findings seem to confirm the assumption that intrinsic spatiotemporal dynamics of endogenous population balance were more intensively influencing the last part of the urban cycle—because of recession and COVID pandemics—and will impact even more significantly any future demographic pattern, more or less grounded on medium-term. At the same time, international and internal migrations, a key component of the total population balance in past time, were losing some strength especially in the last decade, declining rapidly in the last two years because of the pandemics (Menashe-Oren & Bocquier, 2021).
Further studies are required to document if this pattern is uniquely associated with the exceptional conditions determined by COVID pandemics, or it is only the beginning of a stable trend depending on persistent population aging and a structurally low fertility. In this regard, the contribution of population age structure is surely relevant and should be studied more accurately. At the same time, natural population balance is also sensitive to the past migration history of metropolitan regions (Gil-Alonso et al., 2016), because fertility rates can be influenced by the ethnic composition of population (likely displaying different childbearing propensity) due to the stratification of distinctive international migration waves (Coleman, 2008). Based on these premises, a specific focus on short-term dynamics of natural balance will also contribute to refined population projections for urban/metropolitan areas, under the assumption that data-driven policy-making and regional planning require an advanced knowledge of the latent mechanisms of urban expansion (Boyle, 2003; Capello et al., 2015; Zambon et al., 2017). In these regards, our study indicates how a diachronic analysis of official statistics appropriately illustrates the (evolving) spatial organization of metropolitan regions (Gkartzios, 2013). Demographic indicators assessing formation (and consolidation) of fringe settlements are especially appropriate when planning future urban development in Southern Europe and, more generally, across the continent (Chorianopoulos et al., 2010).
Results of our approach definitely suggest future directions in urban studies and regional demography (Morelli et al., 2014). Metropolitan expansion was demonstrated to be associated with demographic polarization in dynamic and stagnant contexts (Lerch, 2013), wealth accumulation (Buzar et al., 2007), social inequalities (Helbich, 2012), and land-use change (Delladetsima, 2006) toward higher resource consumption (Vaughan & Arbaci, 2011). In these regards, results of our study make clear how different natural population balance rates at the base of distinctive growth stages are intrinsically reflective of the complex interplay of underlying forces (economic downturns, social change, demographic transition, and territorial transformations) at multiple spatiotemporal scales (Hoekveld, 2015; Kurek et al., 2015; Zambon et al., 2017).
These findings have strong implications for spatial planning, increasingly committed to reconnect urban management with diversified population dynamics and heterogeneous socioeconomic impulses (Carbonaro et al., 2018; Kroll & Kabisch, 2012; Nijkamp & Kourtit, 2013). For instance, the effect of pandemics emerging in the last years will differently shape future growth of large metropolises in Mediterranean Europe. Diversified population dynamics in neighboring districts of the same metropolitan area delineate specific growth paths, in line with the empirical predictions of the suburban fertility hypothesis (e.g., Kulu & Boyle, 2009) or (direct or indirect) mechanisms of density-dependent regulation of population growth (Lutz et al., 2006). While providing an indirect justification to accelerated population dynamics in fringe settlements—where a positive natural balance still contributes to total population growth—demographic dynamics in line with this hypothesis will contribute to reshape sequential stages of the metropolitan cycle (Domingo & Gil-Alonso, 2007; Hank, 2001; Lerch, 2019). Comparative approaches based on high-resolution official statistics (e.g., at the scale of homogeneous neighborhoods) and use of refined spatially explicit multidimensional techniques (e.g., Wheeler & Tiefelsdorf, 2005) are the appropriate tools to shed further light on these deserving issues.
5 Conclusions
By reconnecting research on urban cycles with comparative analyses of regional demographic dynamics in advanced economies, our study develops a long-term interpretation of metropolitan growth that confirms how demographic equilibria are particularly dynamic and mostly unstable in cities. In this regard, a better comprehension of the multiple responses of social agents to urban change is at the base of integrated strategies facing the sustainable development of metropolitan spaces. Urban management should actively face with increasingly fragmented population dynamics at the fringe, prefiguring the relevance of mechanisms of spatial rebalance of inner cities, suburban settlements, and rural districts for metropolitan sustainability. Our study has demonstrated how a long-term analysis of population dynamics may highlight the latent frame of metropolitan growth, contributing to design measures for sustainable urban development. While having intrinsic limitations associated with the use of official statistics, demographic indicators seem to be reliable and robust aggregates addressing the intrinsic complexity of metropolitan growth in both advanced and emerging economies.
References
Arbaci, S., & Tapada-Berteli, T. (2012). Social inequality and urban regeneration in Barcelona city centre: Reconsidering success. European Urban and Regional Studies, 19(3), 287–311.
Balbo, N., Billari, F. C., & Mills, M. (2013). Fertility in advanced societies: A review of research. European Journal of Population, 29(1), 1–38.
Bayona, J., & Gil-Alonso, F. (2012). Suburbanisation and international immigration: The case of the Barcelona Metropolitan Region (1998–2009). Tijdschrift Voor Economische En Sociale Geografie, 103(3), 312–329.
Benassi, F., & Salvati, L. (2020). Urban cycles and long-term population trends in a Southern European City: A demographic outlook. Applied Spatial Analysis and Policy, 13(3), 777–803.
Berry, B. J. L. (1976). Urbanization and counterurbanization. Sage.
Billari, F., & Kohler, H.-P. (2004). Patterns of low and lowest-low fertility in Europe. Population Studies, 58(2), 161–176.
Bocquier, P., & Bree, S. (2018). A regional perspective on the economic determinants of urban transition in 19th-century France. Demographic Research, 38, 1535–1576.
Boyle, P. J. (2003). Population geography: Does geography matter in fertility research? Progress in Human Geography, 27(5), 615–626.
Buzar, S., Ogden, P. E., Hall, R., Haase, A., Kabisch, S., & Steinführer, A. (2007). Splintering urban populations: Emergent landscapes of reurbanisation in four European cities. Urban Studies, 44(4), 651–677.
Capello, R., Caragliu, A., & Fratesi, U. (2015). Spatial heterogeneity in the costs of the economic crisis in Europe: Are cities sources of regional resilience? Journal of Economic Geography, 15(5), 951–972.
Carbonaro, C., Leanza, M., McCann, P., & Medda, F. (2018). Demographic decline, population aging, and modern financial approaches to urban policy. International Regional Science Review, 41(2), 2010–2232.
Carlucci, M., Chelli, F. M., & Salvati, L. (2018). Toward a new cycle: Short-term population dynamics, gentrification, and re-urbanization of Milan (Italy). Sustainability (switzerland), 10(9), 3014.
Carlucci, M., Grigoriadis, E., Rontos, K., & Salvati, L. (2017). Revisiting a hegemonic concept: Long-term ‘Mediterranean urbanization’ in between city re-polarization and metropolitan decline. Applied Spatial Analysis and Policy, 10(3), 347–362.
Cecchini, M., Zambon, I., Pontrandolfi, A., Turco, R., Colantoni, A., Mavrakis, A., & Salvati, L. (2019). Urban sprawl and the ‘olive’ landscape: Sustainable land management for ‘crisis’ cities. GeoJournal, 84(1), 237–255.
Champion, A. G. (2001). A changing demographic regime and evolving polycentric urban regions: Consequences for the size, composition and distribution of city populations. Urban Studies, 38(4), 657–677.
Chelleri, L., Schuetze, T., & Salvati, L. (2015). Integrating resilience with urban sustainability in neglected neighborhoods: Challenges and opportunities of transitioning to decentralized water management in Mexico City. Habitat International, 48, 122–130.
Chorianopoulos, I., Pagonis, T., Koukoulas, S., & Drymoniti, S. (2010). Planning, competitiveness and sprawl in the Mediterranean city: The case of Athens. Cities, 27, 249–259.
Chorianopoulos, I., Tsilimigkas, G., Koukoulas, S., & Balatsos, T. (2014). The shift to competitiveness and a new phase of sprawl in the Mediterranean city: Enterprises guiding growth in Messoghia-Athens. Cities, 39, 133–143.
Ciommi, M., Chelli, F. M., & Salvati, L. (2019). Integrating parametric and non-parametric multivariate analysis of urban growth and commuting patterns in a European metropolitan area. Quality and Quantity, 53(2), 957–979.
Cleveland, W. S. (1981). A program for smoothing scatterplots by robust locally weighted fitting. The American Statistician, 35, 54.
Coleman, D. (2006). Immigration and ethnic change in low-fertility countries: A third demographic transition. Population and Development Review, 32(3), 401–446.
Coleman, D. A. (2008). New Europe, new Diversity. Population Studies, 62(1), 113–120.
Couch, C., Petschel-held, G., & Leontidou, L. (2007). Urban Sprawl in Europe: Landscapes, land-use change and policy. Blackwell.
Cuadrado-Ciuraneta, S., Durà-Guimerà, A., & Salvati, L. (2017). Not only tourism: Unravelling suburbanization, second-home expansion and “rural” sprawl in Catalonia, Spain. Urban Geography, 38(1), 66–89.
Cuberes, D. (2011). Sequential city growth: Empirical evidence. Journal of Urban Economics, 69(2), 229–239.
De Muro, P., Monni, S., & Tridico, P. (2011). Knowledge-based economy and social exclusion: Shadow and light in the roman socio-economic model. International Journal of Urban and Regional Research, 35(6), 1212–1238.
De Rosa, S., & Salvati, L. (2016). Beyond a ‘side street story’? Naples from spontaneous centrality to entropic polycentricism, towards a ‘crisis city.’ Cities, 51, 74–83.
Delladetsima, P. M. (2006). The emerging property development pattern in Greece and its impact on spatial development. European Urban and Regional Studies, 13(3), 245–278.
Di Feliciantonio, C., & Salvati, L. (2015). ‘Southern’ alternatives of urban diffusion: Investigating settlement characteristics and socio-economic patterns in three mediterranean regions. Tijdschrift Voor Economische En Sociale Geografie, 106(4), 453–470.
Di Feliciantonio, C., Salvati, L., Sarantakou, E., & Rontos, K. (2018). Class diversification, economic growth and urban sprawl: Evidences from a pre-crisis European city. Quality and Quantity, 52(4), 1501–1522.
Dijkstra, L., Garcilazo, E., & McCann, P. (2015). The effects of the global financial crisis on European regions and cities. Journal of Economic Geography, 15(5), 935–949.
Domingo, A., & Gil-Alonso, F. (2007). Immigration and changing labour force structure in the Southern European Union. Population, 62(4), 709–727.
Dura-Guimera, A. (2003). Population deconcentration and social restructuring in Barcelona, a European Mediterranean city. Cities, 20(6), 387–394.
Garcia-López, M. A. (2010). Population suburbanization in Barcelona, 1991–2005: Is its spatial structure changing? Journal of Housing Economics, 19(2), 119–132.
Gavalas, V. S., Rontos, K., & Salvati, L. (2014). Who becomes an unwed mother in Greece? Sociodemographic and geographical aspects of an emerging phenomenon. Population, Space and Place, 20(3), 250–263.
Gil-Alonso, F., Bayona-i-Carrasco, J., & Pujadas-i-Rúbies, I. (2016). From boom to crash: Spanish urban areas in a decade of change (2001–2011). European Urban and Regional Studies, 23(2), 198–216.
Gkartzios, M. (2013). ‘Leaving Athens’: Narratives of counterurbanisation in times of crisis. Journal of Rural Studies, 32, 158–167.
Gospodini, A. (2009). Post-industrial trajectories of Mediterranean European cities: The case of post-Olympics Athens. Urban Studies, 46, 1157–1186.
Gounaridis, D., Chorianopoulos, I., & Koukoulas, S. (2018). Exploring prospective urban growth trends under different economic outlooks and land-use planning scenarios: The case of Athens. Applied Geography, 90, 134–144.
Hank, K. (2001). Regional fertility differences in western Germany: An overview of the literature and recent descriptive findings. International Journal of Population Geography, 7(4), 243–257.
Hatz, G. (2009). Features and dynamics of socio-spatial differentiation in Vienna and the Vienna metropolitan region. Tijdschrift Voor Economische En Sociale Geographie, 100(4), 485–501.
Helbich, M. (2012). Beyond Postsuburbia? Multifunctional service agglomeration in Vienna’s Urban Fringe. Tijdschrift Voor Economische En Sociale Geographie, 103(1), 39–52.
Hoekveld, J. J. (2015). Spatial differentiation of population development in a declining region: The case of Saarland. Geografiska Annaler: Series B, Human Geography, 97(1), 47–68.
Kabisch, N., & Haase, D. (2011). Diversifying European agglomerations: Evidence of urban population trends for the 21st century. Population, Space and Place, 17(3), 236–253.
Kabisch, N., Haase, D., & Haase, A. (2012). Urban population development in Europe 1991–2008: The examples of Poland and UK. International Journal of Urban and Regional Research, 36(6), 1326–1348.
Kroll, F., & Kabisch, N. (2012). The relation of diverging urban growth processes and demographic change along an urban–rural gradient. Population, Space and Place, 18(3), 260–276.
Kulu, H. (2013). Why do fertility levels vary between urban and rural areas? Regional Studies, 47(6), 895–912.
Kulu, H., & Boyle, P. J. (2009). High fertility in city suburbs: Compositional or contextual effects? European Journal of Population, 25(2), 157–174.
Kurek, S., Wójtowicz, M., & Gałka, J. (2015). The changing role of migration and natural increase in suburban population growth: The case of a non-capital post-socialist city (The Krakow Metropolitan Area, Poland). Moravian Geographical Reports, 23(4), 59–70.
Lee, R. D., & Reher, D. S. (2011). Introduction: The landscape of demographic transition and its aftermath. Population and Development Review, 37(s1), 1–7.
Lerch, M. (2013). Fertility decline during Albania’s societal crisis and its subsequent consolidation. European Journal of Population, 29(2), 195–220.
Lerch, M. (2019). Regional variations in the rural-urban fertility gradient in the global South. PLoS ONE, 14(7), e0219624.
Lesthaeghe, R. (2010). The unfolding story of the second demographic transition. Population and Development Review, 36(2), 211–251.
Liu, L. (2005). Fertility trends in China’s more developed urban districts: The case of four cities. Population, Space and Place, 11(5), 411–424.
Lutz, W., Testa, M. R., & Penn, D. J. (2006). Population density is a key factor in declining human fertility. Population and Environment, 28(2), 69–81.
Martinez-Fernandez, C., Audirac, I., Fol, S., & Cunningham-Sabot, E. (2012). Shrinking cities: Urban challenges of globalization. International Journal of Urban and Regional Research, 36(2), 213–225.
Menashe-Oren, A., & Bocquier, P. (2021). Urbanization is no longer driven by migration in low- and middle-income countries (1985–2015). Population and Development Review, 47(3), 639–663.
Morelli, V. G., Rontos, K., & Salvati, L. (2014). Between suburbanisation and re-urbanisation: Revisiting the urban life cycle in a Mediterranean compact city. Urban Research and Practice, 7(1), 74–88.
Nijkamp, P., & Kourtit, K. (2013). The “new urban Europe”: Global challenges and local responses in the urban century. European Planning Studies, 21(3), 291–315.
Panori, A., Psycharis, Y., & Ballas, D. (2019). Spatial segregation and migration in the city of Athens: Investigating the evolution of urban socio-spatial immigrant structures. Population, Space and Place, 25(5), e2209.
Pérez, J. M. G. (2010). The real estate and economic crisis: An opportunity for urban return and rehabilitation policies in Spain. Sustainability, 2(6), 1571–1601.
Rontos, K., Grigoriadis, E., Sateriano, A., Syrmali, M., Vavouras, I., & Salvati, L. (2016). Lost in protest, found in segregation: Divided cities in the light of the 2015 “Οχι” referendum in Greece. City, Culture and Society, 7(3), 139–148.
Rubiera Morollón, F., González Marroquin, V. M., & Pérez Rivero, J. L. (2016). Urban sprawl in Spain: Differences among cities and causes. European Planning Studies, 24(1), 207–226.
Salvati, L. (2016). The dark side of the crisis: Disparities in per capita income (2000–12) and the urban-rural gradient in Greece. Tijdschrift Voor Economische En Sociale Geografie, 107(5), 628–641.
Salvati, L., & De Rosa, S. (2014). ‘Hidden Polycentrism’ or ‘Subtle Dispersion’? Urban growth and long-term sub-centre dynamics in three Mediterranean cities. Land Use Policy, 39, 233–243.
Salvati, L., Ciommi, M. T., Serra, P., & Chelli, F. M. (2019). Exploring the spatial structure of housing prices under economic expansion and stagnation: The role of socio-demographic factors in metropolitan Rome, Italy. Land Use Policy, 81, 143–152.
Salvati, L., Sateriano, A., & Grigoriadis, E. (2016). Crisis and the city: Profiling urban growth under economic expansion and stagnation. Letters in Spatial and Resource Sciences, 9(3), 329–342.
Salvati, L., & Serra, P. (2016). Estimating rapidity of change in complex urban systems: A multidimensional, local-scale approach. Geographical Analysis, 48(2), 132–156.
Salvati, L., Zitti, M., & Sateriano, A. (2013). Changes in city vertical profile as an indicator of sprawl: Evidence from a Mediterranean urban region. Habitat International, 38, 119–125.
Scott, A. J., & Storper, M. (2015). The nature of cities: The scope and limits of urban theory. International Journal of Urban and Regional Research, 39(1), 1–15.
Serra, P., Vera, A., Tulla, A. F., & Salvati, L. (2014). Beyond urban–rural dichotomy: Exploring socioeconomic and land-use processes of change in Spain (1991–2011). Applied Geography, 55, 71–81.
Van Den Berg, L., Drewett, L., & Klaassen, L. H. (1982). Urban Europe: A study of growth and decline. Pergamon Press.
Van Nimwegen, N. (2013). Population change in Europe: Turning challenges into opportunities. Genus, 69(1), 103–125.
Vaughan, L., & Arbaci, S. (2011). The challenges of understanding urban segregation. Built Environment, 37(2), 128–138.
Vobetká, J., & Piguet, V. (2012). Fertility, natural growth, and migration in the Czech Republic: An urban–suburban–rural gradient analysis of long-term trends and recent reversals. Population, Space and Place, 18(3), 225–240.
Wheeler, D., & Tiefelsdorf, M. (2005). Multicollinearity and correlation among local regression coefficients in geographically weighted regression. Journal of Geographical Systems, 7(2), 161–187.
Zambon, I., Serra, P., Sauri, D., Carlucci, M., & Salvati, L. (2017). Beyond the ‘Mediterranean city’: socioeconomic disparities and urban sprawl in three Southern European cities. Geografiska Annaler: Series B, Human Geography, 99(3), 319–337.
Author information
Authors and Affiliations
Corresponding author
Additional information
Publisher's Note
Springer Nature remains neutral with regard to jurisdictional claims in published maps and institutional affiliations.
Rights and permissions
About this article

Cite this article
Salvati, L. Endogenous Population Dynamics and Metropolitan Cycles: Long-Term Evidence from Athens, an Eternally Mediterranean City. Eur J Population 38, 835–860 (2022). https://doi.org/10.1007/s10680-022-09622-7
Received:
Accepted:
Published:
Issue Date:
DOI: https://doi.org/10.1007/s10680-022-09622-7