
Abstract
Background
The patellar height index is important; however, the measurement procedures are time-consuming and prone to significant variability among and within observers. We developed a deep learning-based automatic measurement system for the patellar height and evaluated its performance and generalization ability to accurately measure the patellar height index.
Methods
We developed a dataset containing 3,923 lateral knee X-ray images. Notably, all X-ray images were from three tertiary level A hospitals, and 2,341 cases were included in the analysis after screening. By manually labeling key points, the model was trained using the residual network (ResNet) and high-resolution network (HRNet) for human pose estimation architectures to measure the patellar height index. Various data enhancement techniques were used to enhance the robustness of the model. The root mean square error (RMSE), object keypoint similarity (OKS), and percentage of correct keypoint (PCK) metrics were used to evaluate the training results. In addition, we used the intraclass correlation coefficient (ICC) to assess the consistency between manual and automatic measurements.
Results
The HRNet model performed excellently in keypoint detection tasks by comparing different deep learning models. Furthermore, the pose_hrnet_w48 model was particularly outstanding in the RMSE, OKS, and PCK metrics, and the Insall–Salvati index (ISI) automatically calculated by this model was also highly consistent with the manual measurements (intraclass correlation coefficient [ICC], 0.809–0.885). This evidence demonstrates the accuracy and generalizability of this deep learning system in practical applications.
Conclusion
We successfully developed a deep learning-based automatic measurement system for the patellar height. The system demonstrated accuracy comparable to that of experienced radiologists and a strong generalizability across different datasets. It provides an essential tool for assessing and treating knee diseases early and monitoring and rehabilitation after knee surgery. Due to the potential bias in the selection of datasets in this study, different datasets should be examined in the future to optimize the model so that it can be reliably applied in clinical practice.
Trial registration
The study was registered at the Medical Research Registration and Filing Information System (medicalresearch.org.cn) MR-61-23-013065. Date of registration: May 04, 2023 (retrospectively registered).
Background
The patellar height is important in the anatomy and biomechanics of the patellofemoral joint. Recently, several studies have shown that an abnormal patellar height is associated with various knee diseases. These diseases include patellar dislocation [1, 2], patellar instability [3], Osgood–Schlatter disease [4, 5], anterior knee pain [6], chondromalacia patella [7], and anterior cruciate ligament (ACL) injuries [8, 9]. Moreover, abnormalities in the patellar height are closely linked to complications and poor recovery after total knee arthroplasty (TKA) [10,11,12], tibial osteotomy [13], and ACL reconstruction [14]. Therefore, early assessment and treatment of abnormal patellar height are vital to effectively control symptoms, prevent and alleviate related diseases, and improve patients’ quality of life.
The patellar height is typically measured directly or indirectly using radiological or magnetic resonance imaging (MRI) methods [15]. However, these standard procedures are lengthy, time-consuming, repetitive, and require additional computational support. They are prone to significant variability among and within observers, which may affect the accuracy of the measurements [16, 17].
Recently, deep-learning algorithms have been increasingly applied across various aspects of the medical field, particularly in orthopedics. Kim et al. [18] automated the detection and segmentation of lumbar vertebrae from radiographs to assess compressive fractures. Similarly, Krogue et al. [19] implemented the automatic identification and classification of hip fractures. Regarding surgical planning, Qu et al. [20] utilized MRI for the precise segmentation of pelvic bone tumors, aiding the development of effective surgical plans for tumor excision and reconstruction. Von Schacky et al. [21] segmented and classified primary bone tumors, whereas Consalvo et al. [22] have detected and differentiated Ewing’s sarcoma and acute osteomyelitis. Leung et al. [23] have predicted the risks of TKA in patients with osteoarthritis for risk assessment. Ye et al. [24] developed a deep learning-based automatic measurement algorithm using a convolutional neural network (CNN) with VGG16 as the encoder. Kwolek et al. [25] employed the YOLO neural network and U-Net for detecting and segmenting the patellofemoral joint, enabling automatic measurements of the Caton-Deschamps index (CDI) and Blackburne-Peel index.
Deep-learning algorithms are particularly effective at navigating the complex anatomical structures and variations between normal and pathological states in humans. They excel at identifying and learning intricate patterns from extensive datasets, which is crucial for accurately measuring patellar height in various radiographic images [26]. Furthermore, the automation capabilities of deep learning significantly streamline the measurement process, reducing both the variability and the time required for manual assessments [27].
Therefore, our objective was to develop a novel deep learning-based algorithm to automatically measure patellar height, to enable high-precision and rapid analysis of medical images.
Methods
Study aim, design, and setting
This multicenter retrospective study aimed to develop a deep learning-based algorithm to automatically measure patellar height parameters in lateral knee radiographs and evaluate its performance and generalization ability. We utilized a dataset containing X-ray images from three tertiary level A hospitals.
Datasets
The images used in this study’s dataset were obtained from three tertiary A-grade comprehensive hospitals: The Second Affiliated Hospital of ** knees; and (4) unclear superior or inferior poles of the patellar or patellar ligament endpoints. The osteoarthritis criteria were used to include radiographs with clear patellar height markers. We retrospectively analyzed 3,923 knee joints, of which 2,341 met the inclusion criteria. A random selection of 90% of the cases from The Second Affiliated Hospital of ** to enhance the model’s robustness and generalization ability.
Model selection
The residual network for human pose estimation (Pose_ResNet) is an advanced human pose estimation method that leverages the robustness of deep residual networks (ResNets) to effectively locate human body keypoints [28, 29]. The network initially extracts image features through convolutional layers, which can recognize complex patterns in the images and provide the necessary visual information for detecting human-body keypoints. The output is a set of heat maps, each corresponding to a specific body keypoint, representing the probabilistic distribution of the keypoint’s possible locations within the image. During training, the loss function typically compared the predicted heat maps with the true heat maps to optimize the network parameters. The final keypoint locations are determined through post-processing steps such as finding the local maxima in the heatmaps. This architecture was built on the fundamental principles of ResNet by integrating deep convolutional layers with residual connections. These connections mitigate the issue of vanishing gradients, thereby enabling the training of deeper networks to enhance feature extraction without losing crucial information during the process.
The High-Resolution Network for Human Pose Estimation (Pose_HRNet) is an efficient network for human pose estimation designed to improve keypoint detection accuracy by maintaining high-resolution feature maps throughout the process [30,31,32,33]. Starting with a high-resolution subnetwork, it progressively adds high-to-low-resolution subnetworks in more stages. Then, it connects multiresolution subnetworks in parallel to learn features on different scales. This multiscale approach enhances the robustness of the model to various challenges in pose estimation, such as occlusions and varying sizes. The global context and local detail information are effectively fused throughout the process by exchanging information across parallel multiresolution subnetworks. Finally, the keypoints are estimated on the network’s output high-resolution feature maps. This approach benefits from semantically richer and spatially precise result representations.
Performance and generalization of keypoint detection
We assessed the landmark detection performance of five models, pose_resnet_50, pose_resnet_101, pose_resnet_152, pose_hrnet_w32, and pose_hrnet_w48, using root mean square error (RMSE), object keypoint similarity (OKS), and percentage of correct keypoints (PCK). Furthermore, we compared the parameter counts and computational complexities of the models. Subsequently, an appropriate model was selected to evaluate the performance of the external test dataset. This was performed to assess the accuracy of knee joint radiographs obtained from different devices across various algorithms.
-
RMSE measures the model accuracy using the square difference between the average predicted and actual values, indicating the error magnitude.
-
OKS evaluates keypoint detection accuracy by considering object scale and keypoint distance, offering a normalized accuracy measure that penalizes larger errors more.
-
PCK calculates the share of keypoints accurately detected within a set distance from true positions, reflecting the model’s precision in keypoint localization.
Performance and generalization of insall–Salvati index (ISI) measurement
The analyses compared the average ISI test results across the three test sets. In addition, we calculated the intraclass correlation coefficient (ICC) to evaluate the reliability and consistency of the manual and automatic measurements. The ICC reflects abstract consistency, with values ≥ 0.75 considered sufficiently reliable [34]. This approach was used to assess the performance and generalizability of ISI measurements.
Statistical analysis
Statistical analyses were performed using PASW Statistics v18 (IBM Corp., Armonk, NY, USA) and Microsoft Excel 2019 (Microsoft Corp., Redmond, WA, USA). We employed ANOVA to compare the mean ages of different groups to identify any statistically significant differences in age distributions. For categorical variables such as sex, side, osteoarthritis grade, and surgery status, chi-square tests were utilized to assess the homogeneity of these variables across the groups. All statistical tests were two-tailed, and a p-value of less than 0.05 was considered to indicate statistical significance.
Results
General data distributions
In this study of 2,241 knee radiographs, the average ages of the patients forming the training, internal, first external, and second external sets, were 50.10 ± 17.77 years (range, 20–87 years), 50.76 ± 16.96 years (range, 21–83 years), 48.88 ± 15.01 years (range, 23–86 years), and 47.43 ± 13.01 years (range, 20–81 years), respectively. Table 1 presents the overall patient characteristics.
Performance and generalization of keypoint detection
Quantitative analysis
Experiments were conducted on keypoint-detection tasks using different deep-learning models. We primarily compared five models: pose_resnet_50, pose_resnet_101, pose_resnet_152, pose_hrnet_w32, and pose_hrnet_w48. We examined the impact of the input sizes of 256 × 192 and 384 × 288 pixels on model performance. In the comparative analysis, we focused on the number of model parameters (#Params), computational complexity (GFLOPs), and three performance metrics: RMSE, OKS, and PCK. The results are shown in Table 2; Figs. 4, 5 and 6.
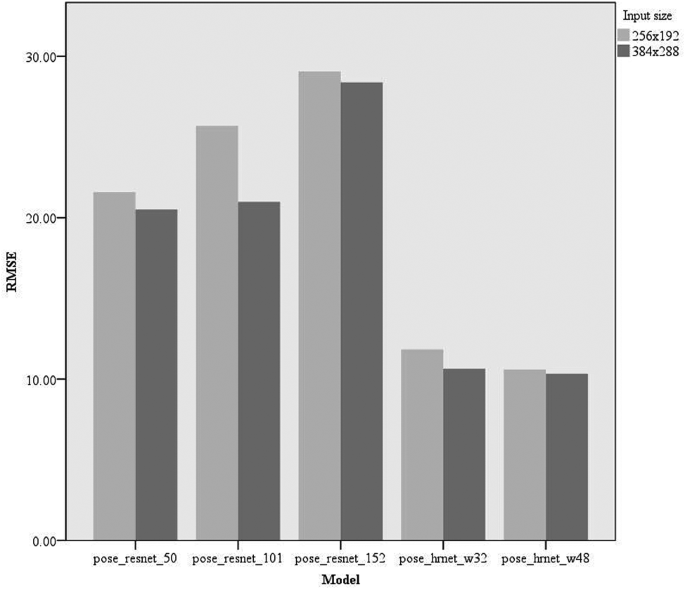
Comparison of RMSE of different models RMSE, root mean square error
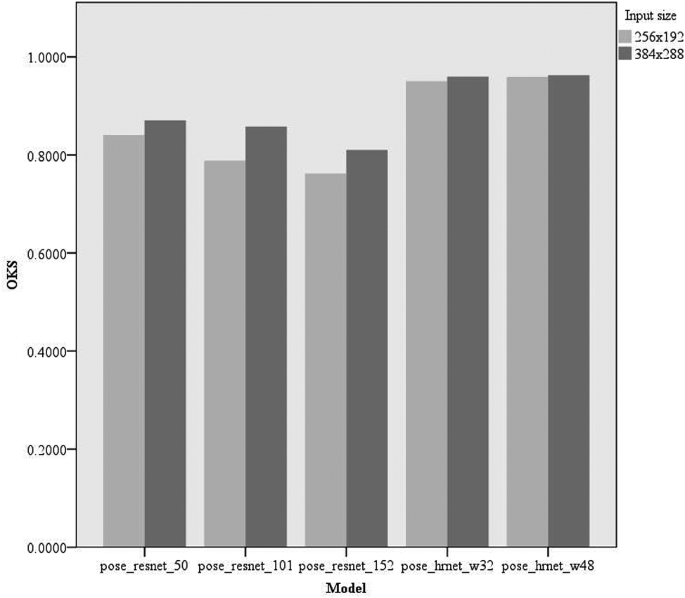
Comparison of OKS of different models OKS, object keypoint similarity
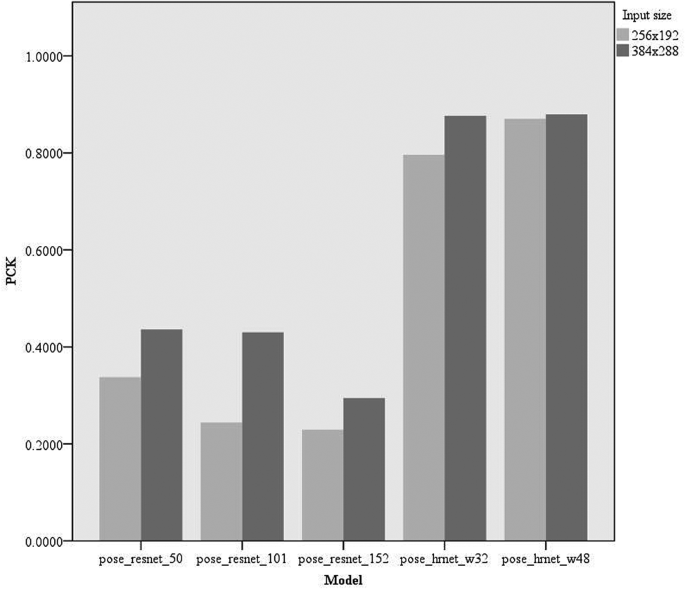
Comparison of PCK of different models PCK, percentage of correct keypoints
Model Parameters and Computational Complexity: The parameter counts for pose_resnet_50, pose_resnet_101, and pose_resnet_152 were 34.0 M, 53.0 M, and 68.6 M, respectively, with computational complexities of 8.9, 12.4, and 15.7 GFLOPs, respectively. In contrast, pose_hrnet_w32 and pose_hrnet_w48 had parameter counts of 28.5 M and 63.6 M, respectively, with computational complexities of 7.1 and 14.6 GFLOPs, respectively. A positive correlation was observed between the model parameter count and computational complexity. The results of the performance analysis are as follows:
-
RMSE: The pose_hrnet_w48 model scored 10.60 and the pose_hrnet_w32 score was 11.84. However, the pose_resnet series had higher RMSE values with pose_resnet_152 having the highest value of 29.06.
-
OKS: The pose_hrnet_w48 model scored the highest at 0.9592, while pose_hrnet_w32 scored 0.9505. In the pose_resnet series, pose_resnet_50 scored 0.8408.
-
PCK: The pose_hrnet_w48 model had the highest score of 0.8705. The pose_hrnet_w32 model scored 0.7961. The Pose_ResNet series generally exhibited lower PCK scores.
Qualitative analysis
From the image analysis perspective, our patellar height measurement system can accurately identify the patella’s upper and lower poles and the patellar tendon’s endpoints. The precision of this identification is high, with virtually no deviation discernible to the human eye (Fig. 7). Therefore, it is evident from the effectiveness diagrams of patellar keypoint detection after total knee arthroplasty that the patellar height measurement system can still effectively identify and measure keypoints even with the implantation of knee prostheses (Fig. 8).
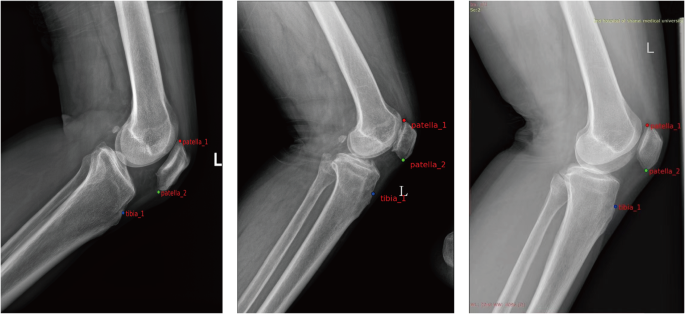
Visualized results of keypoint detection on three datasets. From left to right are the internal test set, external test set 1, and external test set 2
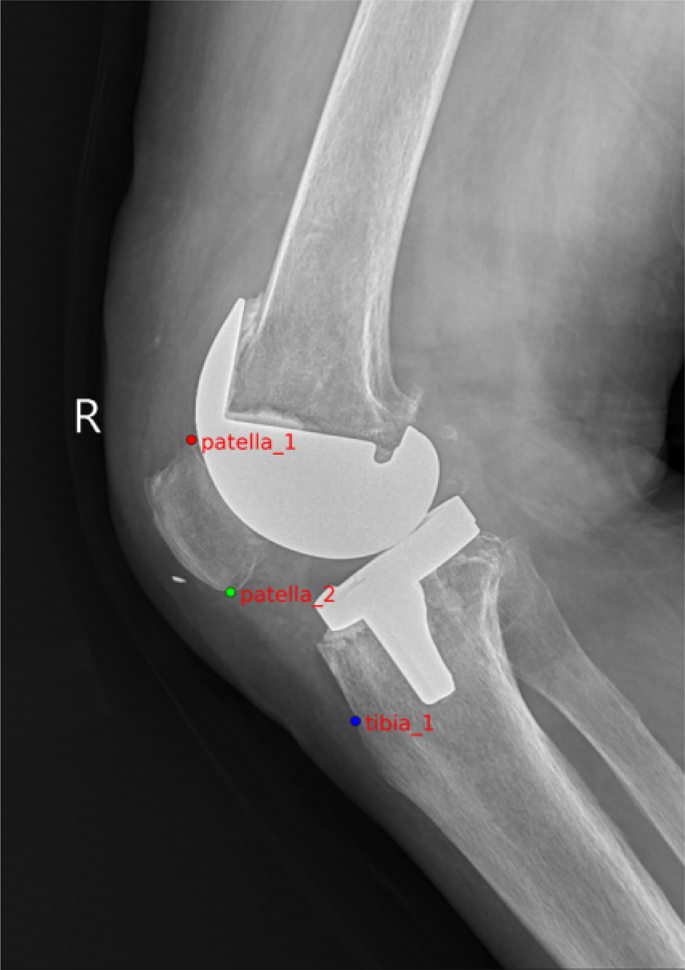
Rendering of keypoint detection after total knee replacement
Generalized analysis
Our study also included an analysis of the model’s generalizability. Tables 3 and 4 show the model’s performance on external test sets from other institutions. In the external test set 1 from ** and rotation. These methods significantly enhanced the model’s robustness. The rationale behind this setup was to test the applicability of the model trained on data from the Second Affiliated Hospital of **’an Jiaotong University in broader contexts. The successful performance of the model on datasets from various hospitals indicates its strong potential for clinical application.
In the future, the application of automated patellar height measurement will reduce human errors and variability associated with manual methods, which is critical for diagnosing diseases related to abnormal patellar heights. Accurate patellar height indices will also aid orthopedic surgeons in devising treatment strategies, including surgical planning such as alignment and balance of the patellofemoral joint in TKA. Additionally, this technology can effectively monitor disease progression and recovery post-surgery, ensuring timely and appropriate interventions that can shorten recovery times and improve overall patient outcomes.
Compared to previously developed models for automatically measuring patellar height using deep learning, this study utilizes a large, multicenter dataset and the advanced HRNet architecture, achieving notably low RMSE and high OKS and PCK scores. Despite the outstanding results achieved in this study, there were some limitations. First, training and testing the model on specific hospital datasets may not fully represent the global diversity of knee joint anatomy. Additionally, county and township hospitals may employ different imaging protocols for knee X-rays, which could impact the model’s ability to accurately detect keypoints. Second, the dataset primarily included images with clear patellar height markers, which may have affected the outcomes in patients with abnormal patellar morphology. Third, as a purely linear measurement method, the ISI only considers the patellar height parameter and fails to comprehensively evaluate other anatomical patella structures, such as the patellar type and posterior tibial slope. To mitigate these limitations, future research should train the model with datasets from different races, regions, populations, and devices and focus on optimizing specific patient groups to enhance the model’s applicability across different patient types. By integrating more closely with clinical practice, the model could be guided towards improvements and optimizations for patients with abnormal patellar morphology. Furthermore, consideration should be given to introducing more anatomical structure indicators to comprehensively assess patellar anatomy and the use of three-dimensional imaging techniques (such as computed tomography and MRI) for a comprehensive assessment of patellar anatomy and function. By implementing these measures, we anticipate effectively improving the limitations of the existing model, thereby enabling its true application in clinical settings.
Conclusions
This study successfully developed and validated a deep learning-based automatic patellar height measurement system. This system can accurately measure the patellar height index, performing on par with experienced radiologists. Extensive dataset testing demonstrated the system’s excellent generalization ability and reliability, particularly for processing radiographs from different hospitals and equipment. This measurement system is expected to help in the assessment, treatment, and postoperative monitoring of knee joint diseases, thereby providing a powerful tool for enhancing patients’ quality of life. Due to the potential bias in the selection of datasets in this study, the model still has some shortcomings. In the future, further optimizing and incorporating more anatomical structure indicators will significantly improve the application scope and accuracy of the system, offering a more precise and comprehensive assessment tool for clinical use.
Data availability
The datasets used and/or analyzed in the current study are available from the corresponding author upon reasonable request.
Abbreviations
- RMSE:
-
Root mean square error
- OKS:
-
Object keypoint similarity
- PCK:
-
Percentage of correct keypoints
- ICC:
-
Intraclass correlation coefficient
- ResNet:
-
Residual network for human pose estimation
- HRNet:
-
High-resolution network for human pose estimation
- MRI:
-
Magnetic resonance imaging
- TKA:
-
Total knee arthroplasty
- ACL:
-
Anterior cruciate ligament
- ISI:
-
Insall–Salvati index
- CNN:
-
Convolutional neural network
- VGG16:
-
Visual geometry group 16
- CDI:
-
Caton–Deschamps index
- KI:
-
Keerati index
References
Jaquith BP, Parikh SN. Predictors of recurrent patellar instability in children and adolescents after first-time dislocation. J Pediatr Orthop. 2017;37:484–90. https://doi.org/10.1097/BPO.0000000000000674.
Balcarek P, Ammon J, Frosch S, Walde TA, Schüttrumpf JP, Ferlemann KG, et al. Magnetic resonance imaging characteristics of the medial patellofemoral ligament lesion in acute lateral patellar dislocations considering trochlear dysplasia, Patella alta, and tibial tuberosity-trochlear groove distance. Arthroscopy. 2010;26:926–35. https://doi.org/10.1016/j.arthro.2009.11.004.
Dejour H, Walch G, Nove-Josserand L, Guier C. Factors of patellar instability: an anatomic radiographic study. Knee Surg Sports Traumatol Arthrosc. 1994;2:19–26. https://doi.org/10.1007/BF01552649.
Aparicio G, Abril JC, Calvo E, Alvarez L. Radiologic study of patellar height in Osgood-Schlatter disease. J Pediatr Orthop. 1997;17:63–6. https://doi.org/10.1097/01241398-199701000-00015.
Visuri T, Pihlajamäki HK, Mattila VM, Kiuru M. Elongated patellae at the final stage of Osgood-Schlatter disease: a radiographic study. Knee. 2007;14:198–203. https://doi.org/10.1016/j.knee.2007.03.003.
Luyckx T, Didden K, Vandenneucker H, Labey L, Innocenti B, Bellemans J. Is there a biomechanical explanation for anterior knee pain in patients with Patella alta? Influence of patellar height on patellofemoral contact force, contact area and contact pressure. J Bone Joint Surg Br. 2009;91:344–50. https://doi.org/10.1302/0301-620X.91B3.21592.
Lu W, Yang J, Chen S, Zhu Y, Zhu C. Abnormal patella height based on Insall-Salvati ratio and its correlation with patellar cartilage lesions: an extremity-dedicated low-field magnetic resonance imaging analysis of 1703 Chinese cases. Scand J Surg. 2016;105:197–203. https://doi.org/10.1177/1457496915607409.
Akgün AS, Agirman M. Associations between anterior cruciate ligament injuries and Patella alta and trochlear dysplasia in adults using magnetic resonance imaging. J Knee Surg. 2021;34:1220–6. https://doi.org/10.1055/s-0040-1702198.
Degnan AJ, Maldjian C, Adam RJ, Fu FH, Di Domenica M. Comparison of Insall-Salvati ratios in children with an acute anterior cruciate ligament tear and a matched control population. AJR Am J Roentgenol. 2015;204:161–6. https://doi.org/10.2214/AJR.13.12435.
Lum ZC, Saiz AM, Pereira GC, Meehan JP. Patella baja in total knee arthroplasty. J Am Acad Orthop Surg. 2020;28:316–23. https://doi.org/10.5435/JAAOS-D-19-00422.
Tischer T, Geier A, Lutter C, Enz A, Bader R, Kebbach M. Patella height influences patellofemoral contact and kinematics following cruciate-retaining total knee replacement. J Orthop Res. 2023;41:793–802. https://doi.org/10.1002/jor.25425.
Nishizawa Y, Matsumoto T, Kubo S, Muratsu H, Matsushita T, Oka S, et al. The influence of patella height on soft tissue balance in cruciate-retaining and posterior-stabilised total knee arthroplasty. Int Orthop. 2013;37:421–5. https://doi.org/10.1007/s00264-012-1749-5.
Portner O. High tibial valgus osteotomy: closing, opening or combined? Patellar height as a determining factor. Clin Orthop Relat Res. 2014;472:3432–40. https://doi.org/10.1007/s11999-014-3821-5.
Aglietti P, Buzzi R, D’andria S, Zaccherotti G. Patellofemoral problems after intraarticular anterior cruciate ligament reconstruction. Clin Orthop Relat Res. 1993;288195–204. https://doi.org/10.1097/00003086-199303000-00025.
Igoumenou VG, Dimopoulos L, Mavrogenis AF. Patellar height assessment methods: an update. JBJS Rev. 2019;7:e4. https://doi.org/10.2106/JBJS.RVW.18.00038.
Smith TO, Davies L, Toms AP, Hing CB, Donell ST. The reliability and validity of radiological assessment for patellar instability. A systematic review and meta-analysis. Skelet Radiol. 2011;40:399–414. https://doi.org/10.1007/s00256-010-0961-x.
Chen HC, Lin CJ, Wu CH, Wang CK, Sun YN. Automatic Insall-Salvati ratio measurement on lateral knee x-ray images using model-guided landmark localization. Phys Med Biol. 2010;55:6785–800. https://doi.org/10.1088/0031-9155/55/22/012.
Kim KC, Cho HC, Jang TJ, Choi JM, Seo JK. Automatic detection and segmentation of lumbar vertebrae from X-ray images for compression fracture evaluation. Comput Methods Programs Biomed. 2021;200:105833. https://doi.org/10.1016/j.cmpb.2020.105833.
Krogue JD, Cheng KV, Hwang KM, Toogood P, Meinberg EG, Geiger EJ, et al. Automatic hip fracture identification and functional subclassification with deep learning. Radiol Artif Intell. 2020;2:e190023. https://doi.org/10.1148/ryai.2020190023.
Qu Y, Li X, Yan Z, Zhao L, Zhang L, Liu C, et al. Surgical planning of pelvic tumor using multi-view CNN with relation-context representation learning. Med Image Anal. 2021;69:101954. https://doi.org/10.1016/j.media.2020.101954.
von Schacky CE, Wilhelm NJ, Schäfer VS, Leonhardt Y, Gassert FG, Foreman SC, et al. Multitask deep learning for segmentation and classification of primary bone tumors on radiographs. Radiology. 2021;301:398–406. https://doi.org/10.1148/radiol.2021204531.
Consalvo S, Hinterwimmer F, Neumann J, Steinborn M, Salzmann M, Seidl F, et al. Two-phase deep learning algorithm for detection and differentiation of ewing sarcoma and acute osteomyelitis in paediatric radiographs. Anticancer Res. 2022;42:4371–80. https://doi.org/10.21873/anticanres.15937.
Leung K, Zhang B, Tan J, Shen Y, Geras KJ, Babb JS, et al. Prediction of total knee replacement and diagnosis of osteoarthritis by using deep learning on knee radiographs: data from the osteoarthritis initiative. Radiology. 2020;296:584–93. https://doi.org/10.1148/radiol.2020192091.
Ye Q, Shen Q, Yang W, Huang S, Jiang Z, He L, et al. Development of automatic measurement for patellar height based on deep learning and knee radiographs. Eur Radiol. 2020;30:4974–84. https://doi.org/10.1007/s00330-020-06856-z.
Kwolek K, Grzelecki D, Kwolek K, Marczak D, Kowalczewski J, Tyrakowski M. Automated patellar height assessment on high-resolution radiographs with a novel deep learning-based approach. World J Orthop. 2023;14:387–98. https://doi.org/10.5312/wjo.v14.i6.387.
Bonaldi L, Pretto A, Pirri C, Uccheddu F, Fontanella CG, Stecco C. Deep learning-based medical images segmentation of Musculoskeletal anatomical structures: a survey of bottlenecks and strategies. Bioengineering. 2023;10:137. https://doi.org/10.3390/bioengineering10020137.
Sharbatdaran A, Romano D, Teichman K, Dev H, Raza SI, Goel A, et al. Deep learning automation of kidney, liver, and spleen segmentation for Organ volume measurements in autosomal Dominant polycystic kidney disease. Tomography. 2022;8:1804–19. https://doi.org/10.21873/anticanres.15937.
Papandreou G, Zhu T, Kanazawa N, Toshev A, Tompson J, Bregler C et al. Towards Accurate Multi-person Pose Estimation in the Wild; 2017. ar**v.org. Ithaca: Cornell University. Library. https://doi.org/10.1109/CVPR.2017.395.
Lee J, Kim T, Beak S, Moon Y, Jeong J. Real-time pose estimation based on ResNet-50 for rapid safety prevention and accident detection for field workers. Electronics. 2023;12:3513. https://doi.org/10.3390/electronics12163513.
Li Y, Jia S, Li Q, BalanceHRNet. An effective network for bottom-up human pose estimation. Neural Netw. 2023;161:297–305. https://doi.org/10.1016/j.neunet.2023.01.036.
Li Q, Zhang Z, **ao F, Zhang F, Bhanu B. Dite-HRNet: Dynamic Lightweight High-Resolution Network for Human Pose Estimation; 2022. ar**v.org. Ithaca: Cornell University. Library. https://doi.org/10.24963/ijcai.2022/153.
Cheng B, **ao B, Wang J, Shi H, Huang TS, Zhang L, HigherHRNet. Scale-Aware Representation Learning for Bottom-Up Human Pose Estimation. In: Proceedings of the IEEE/CVF conference on computer vision and pattern recognition 2020 (pp. 5386–5395). https://doi.org/10.48550/ar**v.1908.10357.
Wang J, Sun K, Cheng T, Jiang B, Deng C, Zhao Y, et al. Deep high-resolution representation learning for visual recognition. IEEE Trans Pattern Anal Mach Intell. 2021;43:3349–64. https://doi.org/10.1109/TPAMI.2020.2983686.
Zou GY. Sample size formulas for estimating intraclass correlation coefficients with precision and assurance. Stat Med. 2012;31:3972–81. https://doi.org/10.1002/sim.5466.
Acknowledgements
Not applicable.
Funding
This study was supported by the Key Program of Shaanxi Province (2023-YBSF-102) and the National Key Research and Development Program of China (2021YFC2401435).
Author information
Authors and Affiliations
Contributions
All the authors contributed substantially to the conception and design of this study. Zeyu Liu conceived and designed the work, collected original data, and wrote and edited the manuscript. Jiangjiang Wu analyzed and interpreted the collected data and provided the technical support required for the work. Xu Gao and Zhipeng Qin collected original data. Professor Run Tian and Chunsheng Wang directed the conception and design of the work and revised the manuscript.
Corresponding authors
Ethics declarations
Ethics approval and consent to participate
We have obtained the approval of the Medical Ethics Committee of the Second Affiliated Hospital of ** ‘an Jiaotong University (reference number 2023-025). The Medical Ethics Committee waived the requirement for informed consent based on the study’s retrospective nature.
Consent for publication
All authors have reviewed and approved the final version of the manuscript and provided consent for publication.
Competing interests
The authors declare that they have no competing interests.
Additional information
Publisher’s Note
Springer Nature remains neutral with regard to jurisdictional claims in published maps and institutional affiliations.
Rights and permissions
Open Access This article is licensed under a Creative Commons Attribution 4.0 International License, which permits use, sharing, adaptation, distribution and reproduction in any medium or format, as long as you give appropriate credit to the original author(s) and the source, provide a link to the Creative Commons licence, and indicate if changes were made. The images or other third party material in this article are included in the article’s Creative Commons licence, unless indicated otherwise in a credit line to the material. If material is not included in the article’s Creative Commons licence and your intended use is not permitted by statutory regulation or exceeds the permitted use, you will need to obtain permission directly from the copyright holder. To view a copy of this licence, visit http://creativecommons.org/licenses/by/4.0/. The Creative Commons Public Domain Dedication waiver (http://creativecommons.org/publicdomain/zero/1.0/) applies to the data made available in this article, unless otherwise stated in a credit line to the data.
About this article

Cite this article
Liu, Z., Wu, J., Gao, X. et al. Deep learning-based automatic measurement system for patellar height: a multicenter retrospective study. J Orthop Surg Res 19, 324 (2024). https://doi.org/10.1186/s13018-024-04809-6
Received:
Accepted:
Published:
DOI: https://doi.org/10.1186/s13018-024-04809-6