
Abstract
Background
Siberian wildrye (Elymus sibiricus L.) attracts considerable interest for grassland establishment and pasture recovery in the Qinghai-Tibet Plateau (QTP) due to its excellence in strong stress tolerance, high nutritional value and ease to cultivate. However, the lack of genomic information of E. sibiricus hampers its genetics study and breeding process.
Results
In this study, we performed a genome survey and developed a set of SSR markers for E. sibiricus based on Next-generation sequencing (NGS). We generated 469.17 Gb clean sequence which is 58.64× of the 6.86 Gb estimated genome size. We assembled a draft genome of 4.34 Gb which has 73.23% repetitive elements, a heterozygosity ratio of 0.01% and GC content of 45.68%. Based on the gnomic sequences we identified 67,833 SSR loci and from which four hundred were randomly selected to develop markers. Finally, 30 markers exhibited polymorphism between accessions and ten were identified as single-locus SSR. These newly developed markers along with previously reported 30 ones were applied to analyze genetic polymorphism among 27 wild E. sibiricus accessions. We found that single-locus SSRs are superior to multi-loci SSRs in effectiveness.
Conclusions
This study provided insights into further whole genome sequencing of E. sibiricus in strategy selection. The novel developed SSR markers will facilitate genetics study and breeding for Elymus species.
Background
As the largest genus in the tribe Triticeae of family Poaceae, Elymus L. contains approximately 150 species occurring in most temperate regions of the world [1]. Given its excellent resistance to drought, cold and disease, the Elymus species can provide important gene pool for improvement and breeding of related cereal crops [2]. Siberian wildrye (Elymus sibiricus L.), a model species of Elymus genus, is a perennial, cool-season and self-pollinated forage grass [1]. It widely spreads in northern Eurasia, and is especially used in the Qinghai-Tibet Plateau (QTP) for grassland establishment and restoration because of its strong adaptability, cold-resistance, high nutritional value, good palatability and ease for cultivation [3, 4]. Up to now, increasing attention has been paid to its germplasm characterization, intraspecific genetic diversity, phylogenic evolution and linkage map construction [1, 4, 5]. However, the lack of genomic sequences hinders the genetics study and breeding progress of this species compared to other Triticeae cereals such as wheat and barley.
E. sibiricus has an allotetraploid genome (StStHH, 2n = 4x = 28). The mean nuclear DNA content (C-value) of E. sibiricus was determined by flow cytometry (FCM) as being 2C = 16.61 pg, approximately twice as large as the possible diploid progenitors from genus Pseudoroegneria (StSt) and Hordeum (HH) [6]. This complexity and huge genome size pose a great challenge to whole genome sequencing of E. sibiricus. Genome survey using next-generation sequencing (NGS) with a given uniform sequencing depth is an alternative and cost-effective strategy in obtaining genome size, heterozygosity, GC and repeat contents. Furthermore, development of molecular markers based on genome survey sequencing and in silico analysis has become a practical tool for genetic study [7].
Among the various types of molecular markers, SSRs (simple sequence repeats) have many advantages including high polymorphism, codominant heredity, good reproducibility and extensive distribution in the genome [8]. These properties have proven to be of great interest for diverse genetic studies including genetic map and fingerprint construction, genetic diversity characterization, and molecular marker assisted breeding, etc. SSR markers can be developed using homology searches from either genomic libraries or transcriptome sequences and expressed sequence tags (ESTs) databases. Often, G-SSR (genomic DNA-derived SSRs) markers are considered to possess higher polymorphism than EST-SSR markers (EST-derived SSRs) due to conservation of the transcribed portions of genome. The ongoing development of next-generation sequencing (NGS) techniques e.g. genomic survey sequencing has economically allowed to access large amounts of genomic data, and can further identify genomic SSR loci by in silico searching SSR motifs in massive scaffold datasets [9,10,15]. On the contrary, compared to multi-loci SSRs, single-locus SSRs primers target a unique location in the genome and could provide more reliable scoring of genotypes in genetic study and breeding programs.
In this study genomic survey sequencing was applied in a E. sibiricus cultivar ‘Chuancao No.2’ using Illumina Hiseq X-ten platform. The first draft genome of E. sibiricus was constructed and some single-locus SSRs and multi-loci SSRs were developed based on genomic survey data. Furthermore, genetic diversity and structure of 27 wild E. sibiricus accessions were characterized using these new SSR markers plus previously published ones. Effectiveness of those markers was also compared and evaluated.
Results
Genome sequencing and characterization
Fourteen 270-bp libraries with pair-end reads of E. sibiricus were constructed and sequenced. The randomly selected 10,000 pairs of reads were then analyzed by BLAST using the NCBI databases. The BLAST result showed that Triticum aestivum and Hordeum vulgare, as the closely-related species to Elymus, were the best matching species in all libraries. In addition, reads of each library aligned with chloroplast genome of E. sibiricus showed lower than 5% matching rate, which indicated that the libraries were established without contamination (data not shown).
From fourteen libraries with 270 bp insertion size, totally 469.17 Gb of clean data were produced using an Illumina HiSeq X-ten platform. The estimated genome size of E. sibiricus was approximately 6.86 Gb with a total sequencing depth of 58.64-fold (Table 1). High quality scores of the filtered sequences were calculated, and the percentages of Q20 and Q30 (the sequencing error rate 1 and 0.1% respectively) was greater than 95.81 and 90.50% respectively, indicating the high accuracy of the sequencing process (Table 1). Then all of the clean data were subjected to 25-mer (k = 25) frequency distribution analysis. It showed that the peak value of the k-mer depth distribution emerged at 54 (Fig. 1). The heterozygosity rate and the proportion of repeat sequence was calculated to be 0.01 and 73.23% respectively according to the k-mer curve distribution.
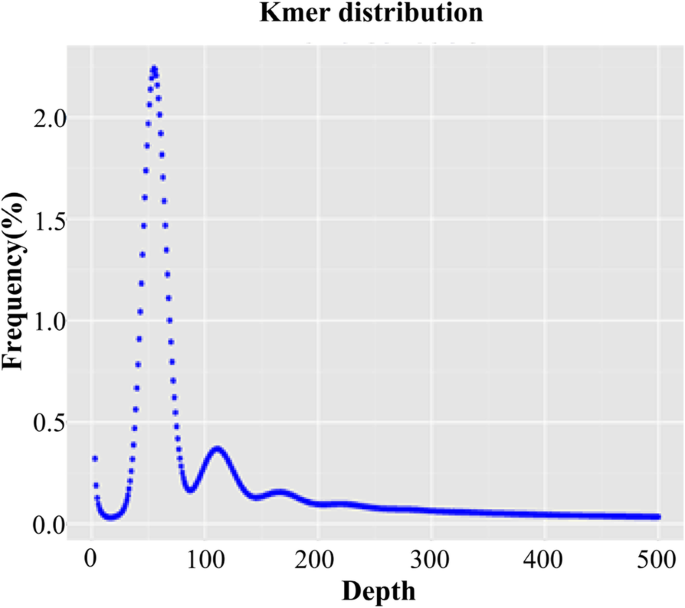
K-mer (k = 25) frequency distribution. The x-axis is depth and the y-axis represent the frequency at that depth. The genome size was calculated following ‘genome size = K-mer num/peak depth’. The two subpeaks were caused by certain repeats rate in the genome of E. sibiricus
After de novo assembly using the SOAP de novo program, all of the clean reads produced a total of 4,841,088 contigs with an N50 length of 2510 bp, which were subsequently assembled into scaffolds (Table 2). Among all those contigs, 683,040 contigs were longer than 500 bp, 352,851 contigs were longer than 1 kb and 7536 contigs were longer than 10 kb. Scaffolds larger than 100 bp were selected for further analysis. Totally 4,763,904 scaffolds were generated with an N50 of 2648, and the number of scaffolds longer than 500 bp, 1 kb and 10 kb were 684,597, 352,659 and 8040, respectively (Table 2). The assembled draft genome was approximately 4.34 Gb, accounting for 63.27% of the estimated 6.86 Gb genome. The calculated GC content of the assembled genome was 45.68% (Table 2), that was consistent with the scatter plot graph built with scaffolds larger than 500 bp (Fig. 2). A total of 25,993 genes were annotated in the E. sibiricus draft genome with an average transcript length per gene of 2632.11 bp and an average coding sequence length of 737.36 bp. The predicted average exons number per gene was 4.72 and the average exon length per transcript was 311.32 bp (Table S1).
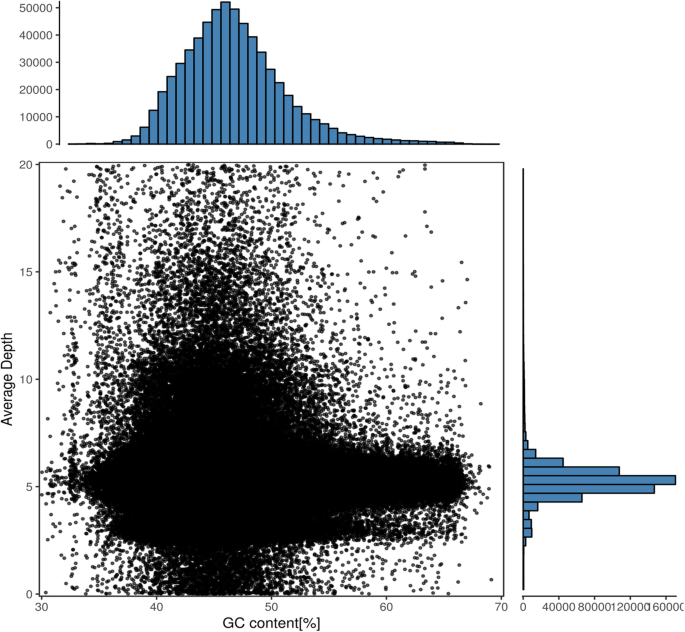
Guanine plus cytosine (GC) content and depth correlation analysis. The x-axis represents the GC content and the y-axis is the sequence depth
Using RepeatMasker software [16], we annotated the repeat regions of the draft genome, in which the most abundant repetitive elements was retroelements (16.45%), followed by DNA transposons (3.26%). The most common element in retroelements and transposons were long terminal repeat (LTR, 15.90%) and Tc1-IS630-Pogo (0.25%), respectively (Table S2).
Development of genome-wide SSR markers
About 4.34 Gb genome sequences were searched for SSR loci and resulted in 315,446 SSRs from 507,162 (20.23%) scaffolds. 22,611 (0.90%) sequences contained a single-locus SSR which was not found on other scaffolds (Table S3). In these SSRs, the mono-, di- and tri-nucleotide motifs were the most enriched, which accounted for 61.81, 21.59 and 14.55% of the total identified SSRs, respectively (Table 3). Nucleotide composition characteristics indicated that A/T (64.21%), AG/CT (27.35%), CTC/GAG (7.6%), CATG/CATG (3.38%), AAAAT/TTTTA (2.96%) and CTTTTT/GAAAAA (2.91%) were the most abundant motifs corresponding to mono- to hexa-nucleotide repeats, respectively (Fig. 3). Generally, motif abundance decreased as the motif repeat number increased for each motif type (Fig. 4). The top three abundant motif repeat number were 10, 6 and 11, whose total number of SSR motifs were 77,930, 31,980 and 31,575 respectively (Table S4). Using Primer3 software [17], a total of 67,833 SSR primer pairs were designed for above-mentioned 22,611 single-locus SSR-containing sequences. In silico analysis was then used to verify the reliability and polymorphism of these primers by aligning the flanking sequences of them to the genome sequences. Four hundred SSR markers were randomly selected to amplify the genomic DNA of eight E. sibiricus accessions (Table S5) and 30 of them displayed polymorphisms and ten showed single-locus amplicons as expected (ESGA-SL) and 20 displayed multi-loci amplicons (ESGA-ML) (Table S6 and Fig. S1).
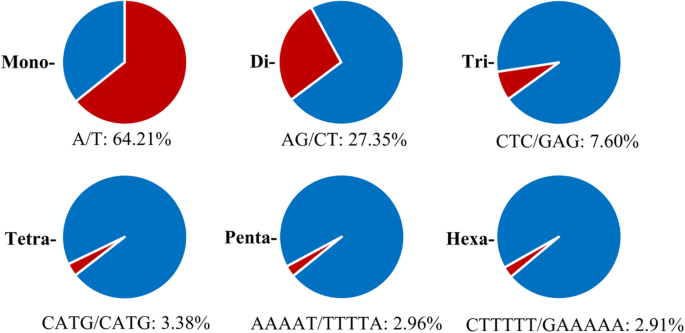
The most abundant motifs (red portion) corresponding to mono- to hexa-nucleotide repeats
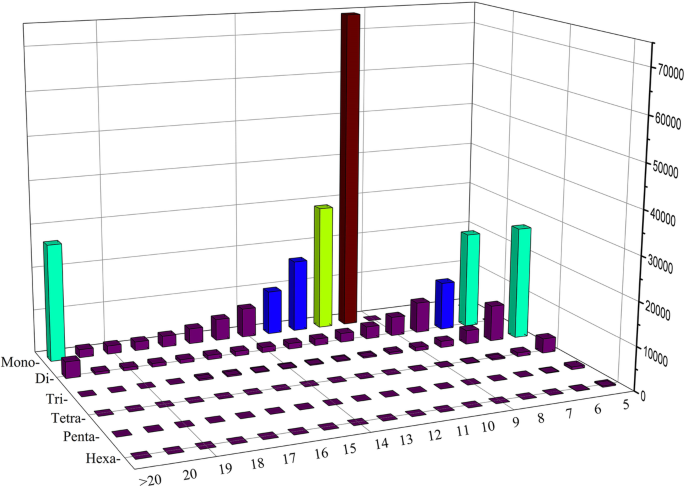
Motif frequency distributions of mono- to hexanucleotide motif types (y-axis) with different repeat numbers (from 5 to > 20, x-axis) in the de novo assembled genomic sequences of E. sibiricus. The z-axis represents the number of each type of motif
Polymorphism of novel SSR markers in E. sibiricus
Marker polymorphism evaluation
A total of 60 SSR markers (30 ESGA, 15 ES and 15 ESGS, Table S6) were used to genotype 27 E. sibiricus accessions, which were collected from Mongolia (MG), eastern Qinghai-Tibet Plateau (QTP) and Siberia (SI) respectively. A total number of 29 alleles (Na) were produced by ten ESGA-SL markers, with an average of 2.9 (Table 4). The average polymorphism information content (PIC) value of all ESGA-SL markers was 0.391, among which the ESGA-SL-7 had the highest PIC value of 0.595. The mean value of observed heterozygosity (Ho) calculated based on ESGA-SL markers was 0.480, among which ESGA-SL-10 had the highest Ho of 0.963.
For multi-loci markers, 105, 97 and 67 polymorphic bands were amplified by ESGA-ML, ESGS and ES primers, and their corresponding average polymorphism percentage was 90.52, 82.49 and 73.84%, respectively (Table S7). Newly developed ESGA-ML markers had the highest average value of PIC (0.4059) and band informativeness (BI, 0.6494) compared to other multi-loci markers (ESGS and ES). Mann Whitney test [18] indicated that there was no significant difference between ESGA-SL and multi-loci markers in view of PIC values (Table S8). For MI, BI and Rp values, the significant difference (P < 0.01) was observed between transcriptome-developed ES marker and genomic-developed ESGA-ML and ESGS markers.
Cluster and STRUCTURE analysis
Genetic memberships of the 27 tested E. sibiricus accessions based on ESGA-SL and ESGA-ML datasets were acquired via STRUCTURE 2.3.4 software (Fig. 5 and Fig. S2). The result revealed an optimal K value of 2 (K = 2), implying the tested accessions belonged to two potential genetic memberships, which was consistent with the UPGMA dendrogram and principal coordinates analysis (PCoA) using ESGA-SL markers. The 27 accessions could be divided into two clusters (Cluster I and Cluster II, Figs. 5 and 6). Cluster I included all the Mongolia (MG) and Siberia (SI) accessions, and Cluster II included all eastern QTP originated ones. Thus, the wild germplasms from different regions could be notably identified through the UPGMA and PCoA analysis, which revealed the powerful discriminability for wild accessions based on ESGA-SL markers. However, in spite of distinct characterization of tested accessions from different regions characterized via PCoA analysis based on ESGA-ML markers (Fig. S3), the topological structure of UMPGA dendrogram was ambiguous and couldn’t distinguish the 27 wild accessions clearly (Fig. S2). Furthermore, the similar result of UPGMA cluster and PCoA analysis based on ESGA-ML markers was also found in ESGS markers (Fig. S4 and Fig. S5). Besides, compared to genomic-developed markers, the transcriptome-developed ES markers could not explain their structure membership well (Fig. S6 and Fig. S7). This indicates that G-SSR markers has the superior discriminability than the EST-SSR markers for intraspecific diversity analysis.
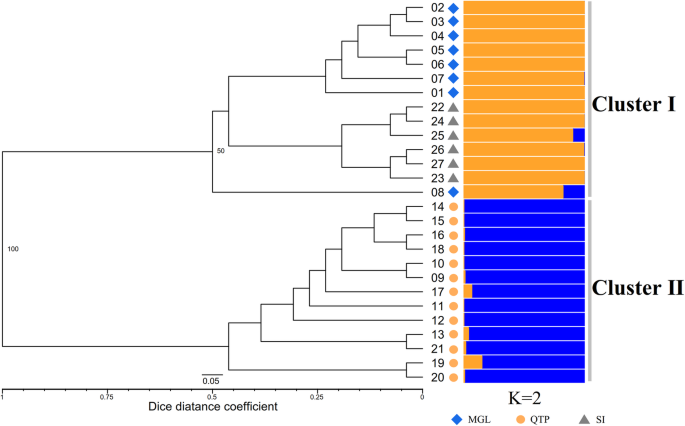
The UPGMA dendrogram and genetic structure of 27 studied E. sibiricus based on ESGA-SL markers. MGL, Mongolia; QTP, eastern Qinghai-Tibet Plateau; SI, Siberia
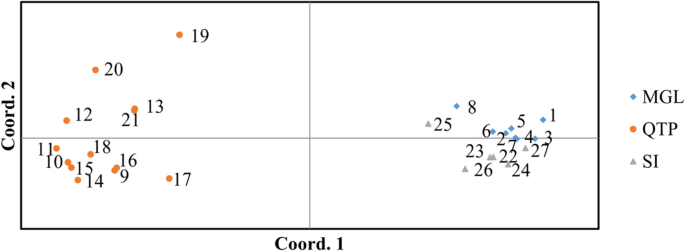
The PcoA analysis of 27 studied E. sibiricus based on ESGA-SL markers
The genetic diversity pattern of E. sibiricus based on different types of markers
Based on geographical origin, all tested wild accessions were divided into three geo-groups: MGL (Mongolia), SI (Siberia) and QTP (eastern Qinghai-Tibet Plateau). The observed heterozygosity (Ho) of each geo-group based on the ESGA-SL dataset was changing from 0.467 to 0.492 (Table 5). In general, the values of Na, Ne (effective alleles number), I (Shannon information index), He (expected heterozygosity) and PP (Percentage of polymorphic loci) of each geo-group calculated by ESGA-SL marker were higher than that of ESGA-ML (Table 5). AMOVA analysis was carried out based on both the ESGA-SL and ESGA-ML markers and coefficient of genetic differentiation (Fst) were calculated. The results showed that genetic variation of tested germplasms was mainly distributed among geo-groups with moderate genetic differentiation (Fst = 0.553 for ESGA-SL and Fst = 0.573 for ESGA-ML) (Table 6).
Discussion
Characteristics of E. sibiricus draft genome
The development of next-generation sequencing (NGS) provided researchers with an attainable and cheaper method to access the plant genomes, especially for the non-model grass species like Elymus sibiricus. Based on Illumina sequencing with fourteen 270 bp insertion size libraries, surveyed draft genome of E. sibiricus was de novo sequenced and assembled in this study. The moderate GC content (45.68%) of the draft genome indicated that the Illumina platform was excellently avoided sequencing bias. The final assembly had a N50 of 2510 bp for contigs, far less than that of Lolium perenne L. (contig N50 = 16,370 bp) [19], while slightly larger than that of allotetraploid Arachis hypogaea L. (contig N50 = 696.6 bp) [20]. This may be caused by the relatively big estimated genome size (6.86 Gb), high repetitiveness (73.23%) of E. sibiricus and the short insertion size of library. The estimated genome size of E. sibiricus (6.86 Gb) was smaller than that of related allohexaploid Triticum aestivum (17 Gb) [21], while larger than that of many other important species in Gramineae, such as Hordeum vulgare (5.1 Gb) [22], Aegilops tauschii (4.5 Gb) [23], Triticum urartu (5.0 Gb) [24], Brachypodium distachyon (260 Mb) [25], Oryza sativa (466 Mb) [26], Sorghum bicolor (730 Mb) [27], Lolium perenne (2 Gb) [28] and Zea mays (2.3 Gb) [29]. The low level of heterozygosity for E. sibiricus (0.01%) obtained via the k-mer analysis was probably caused by the self-pollinating mating system of E. sibiricus, and indicated its feasibility for genome sequencing. This is the first draft genome of E. sibiricus and it is useful in the molecular marker development and functional gene mining. This work also provided the basis for further whole-genome sequencing using larger insert libraries and new sequencing technique like the single-molecule real-time sequencing.
SSR marker development
SSR markers have been widely applied in genetic study and molecular breeding. Among all of the identified 293,362 SSRs, the vast of SSRs (97.95%) belonged to mono-, di- and tri-nucleotide motifs, which was similar to the result of restriction site associated DNA-Seq (RAD) in E. nutans [30]. However, in the transcriptome sequencing study of E. sibiricus, the tri-nucleotide motifs had the largest number [37], which is difficult for genotype scoring. In this case, single-locus SSR markers are considered as the best choice, and development of single-locus SSRs has been reported in barley, peanut and Luffa by genome survey [9, 12, 38]. In this study, 10 single-locus SSR markers were developed via the genome survey of E. sibiricus with great potential use in genetic variation study and linkage map construction.
Effectiveness comparison between single- and multi-loci markers
Genetic diversity of 27 wild E. sibiricus accessions was evaluated by 30 markers developed in this study and other 30 ones reported before. We found that the expected single-locus SSRs screened by in silico analysis still exhibited multi-loci amplicons when separated by polyacrylamide gel. This may be caused by their non-conservatism of flanking sequences [9]. Finally, only 10 single-locus (ESGA-SL) markers and 20 multi-locus (ESGA-ML) markers were obtained in this study for genetic diversity analysis of 27 wild E. sibiricus accessions.
The average amplified alleles of the 10 ESGA-SL markers was 2.9, which was close to the allotetraploid species Arachis hypogaea (3.85) and Brassica napus (3.23) [9, 37]. The PIC value of the 10 ESGA-SL markers varied from 0.069 to 0.595 with an average of 0.391, that indicated its abundant polymorphism and high application value [39]. There was no significant difference of PIC detected between ESGA-SL and other three marker systems (ESGA-ML, ES and ESGS), which may be caused by the different calculation criteria between single-locus and multi-loci marker or the limited amplification loci of single-locus markers. According to the Mann Whitney test, G-SSR (ESGA and ESGS markers) was more efficient and polymorphic than EST-SSR (ES markers) in view of PIC, MI and Rp, that may be driven by the more conservative flanking sequences of EST-SSR [40, 41]. In addition, significantly (P < 0.05) higher PIC values of ESGA-ML markers vs. ESGS markers were calculated, which demonstrate the superiority of SSR markers development method by sequencing over traditional method.
The UPGMA and PCoA derived cluster analysis based on ESGA-SL markers divided the 27 wild E. sibiricus accessions into two groups, and the structure analysis based on Bayesian algorithm also revealed the same pattern. However, the other three types of multi-loci markers exhibited inferior ability than ESGA-SL marker in revealing actual genetic relationships. One should note that all the genetic diversity parameters (Na, Ne, I, He and PP) of each geo-group calculated based on ESGA-SL markers were higher than that of ESGA-ML, which suggested that the single-locus marker reveals more accurate genetic information, so it is more suitable for further genetic analysis [37]. However, slightly higher pairwise Fst values were observed among each geo-group based on ESGA-ML markers. Given that multi-loci SSRs possesses characteristic like multiple amplification sites in the genome location, a part of genetic information was unavoidably covered. The advantage of single-locus markers over multi-loci markers was manifested in this study, however, vast number of single-locus markers that covering the entire genome of E. sibiricus are required further be identified or developed. In this case, higher quality genome-wide sequencing and assembling for E. sibiricus are necessary.
Conclusions
In this study, the de novo whole genomic survey of E. sibiricus was performed and a 4.34 Gb reference genome sequence was obtained with 73.23% repetitive elements, 0.01% heterozygosity and 45.68% GC content. Totally 293,362 SSR markers were identified from the draft genome and 67,833 potential markers were screened by in silico analysis. Subsequently, ten single-locus (ESGA-SL) markers and 20 multi-locus (ESGA-ML) markers were verified by gel electrophoresis and exhibited polymorphism in 27 E. sibiricus accessions. The single-locus marker was proved more efficient and informativeness in genetic study than multi-loci marker. This survey of the genome and the developed SSR markers will facilitate further whole genome sequencing, molecular breeding and phylogenetic study of E. sibiricus and related Triticeae species.
Methods
Plant materials
E. sibiricus cultivar ‘Chuancao No.2’ provided by Sichuan Academy of Grassland Sciences (Chengdu, China) was adopted after identification as tetraploid by flow cytometry (Fig. S8) and planted in the growth chamber (25 °C, 300 μmols·m2·s− 1, 16-h photoperiod). The total genomic DNA of ‘Chuancao No.2’ was isolated from fresh young and clean leaves using a DNA extraction kit (Tiangen, Bei**g, China). DNA concentration and purity were checked on a BioPhotometer (Eppendorf, Germany) and the quality was detected by 1% agarose gel electrophoresis.
Library construction and Illumina sequencing
Fourteen genomic paired-end (PE) libraries with 270-bp insertions were prepared following the manufacturer’s instructions and then sequenced on an Illumina HiSeq X-ten platform. Clean reads were obtained abide by the following filtration and correction criterion [9]: less than 10% unidentified nucleotides (N); no more than 10 nt aligned to the adaptor, allowing for at most 10% mismatches; with at most 50% bases having a phred quality of < 5. Putative PCR duplicates generated during PCR amplification in the library construction process was excluded. In addition, to investigate the potential contaminating effect, 10,000 pairs of clean reads were randomly selected and searched against the NCBI database using BLAST [42]. Finally, to evaluate the content of extra-nuclear DNA in the aforementioned fourteen libraries, BLAST was performed using SOAP [43] with the chloroplast genome of E. sibiricus (MK775250, 135,075 bp).
Genome assembly, annotation and guanine plus cytosine (GC) content analysis
The filtered high-quality sequences were assembled by SOAPdenovo2 [49].
SSRs evaluation based on the genetic diversity of E. sibiricus germplasm
Four hundred pairs of SSR markers were randomly selected for synthesis, then PCR and electrophoresis were performed for screening and validation. Primers with only 0–2 amplified bands were recognized as single-locus SSR and those possessing polymorphism was named ‘E. sibiricus genome assembly single locus’ (ESGA-SL) marker. Analogously, primers with more than 2 amplified bands simultaneously polymorphic was called ‘E. sibiricus genome assembly multi loci’ (ESGA-ML) marker. In addition, 30 pairs of multi loci markers including fifteen G-SSR markers (ESGS [40]) developed based on magnetic bead enrichment, and fifteen pairs of EST-SSR markers (ES [31]) based on E. sibiricus transcriptome were also selected to amplified the same 27 E. sibiricus accessions DNA (Table S5, Supplementary file).
Amplified bands were recorded following genotypes (single locus marker) or 0/1 binary matrix (multi loci marker). Nei’s genetic distance (GD) matrix among 27 accessions was calculated by Freetree [50] with 10,000 bootstrap value, and the UPGMA dendrogram was constructed then visualized in Figtree [50]. The principal coordinate analysis (PCoA) was performed via NTSYS v2.2 [51]. STRUCTURE v2.3.4 [52] was performed based on a Bayesian model to the illustration of genetic membership. The parameters were set to 50,000 burn-in and 100,000 Monte Carlo Markov chain (MCMC) with an admixture model. The STRUCTURE HARVESTER [53] was then applied to estimate the “optimum K”. The hierarchical analysis of molecular variance (AMOVA) was carried out using GenAlEx [54] to calculate the number of alleles (Na), effective alleles (Ne), Shannon diversity index (I), expected heterozygosity (He), polymorphic site proportion (PP) and other genetic diversity parameters. Finally, the observed heterozygosity (Ho) and gene flow (Nm) of single-locus SSRs were calculated.
Availability of data and materials
All datasets supporting the conclusions of this article are included within the article and its additional file. The raw DNA sequencing data are available on the NCBI SRA database with the citation accession ‘PRJNA680324’.
Abbreviations
- NGS:
-
Next-generation sequencing
- QTP:
-
Qinghai-Tibet Plateau
- FCM:
-
Flow cytometry
- SSRs:
-
Simple sequence repeats
- ESTs:
-
Expressed sequence tags
- G-SSR:
-
Genomic DNA-derived SSRs
- ESGA-SL:
-
E. sibiricus genome assembly single locus marker
- ESGA-ML:
-
E. sibiricus genome assembly multi loci marker
References
Ma X, Chen SY, Zhang XQ, Zhou YH, Bai SQ, Liu W. Genetic diversity of gliadin in worldwide germplasm collections of Elymus sibiricus. Acta Pratacul Sin. 2009;18:59–66.
Dewey DR, Barkworth ME. The genomic system of classification as a guide to intergeneric hybridization with the perennial Triticeae. Genet. Manipulation Plant Breed., Proc., Int. Symp. 1984;35:202.
Yan JJ, Bai SQ, Ma X, Gan YM, Zhang JB. Genetic diversity of Elymus sibiricus and its breeding in China. Chin Bull Bot. 2007;24:226–31.
Ma X, Zhang XQ, Zhou YH, Bai SQ, Liu W. Assessing genetic diversity of Elymus sibiricus (Poaceae: Triticeae) populations from Qinghai-Tibet plateau by ISSR markers. Biochem Syst Ecol. 2008;36:514–22.
Yan JJ, Bai SQ, Zhang XQ, You MH, Zhang CB, Li DX, Zeng Y. Genetic diversity of wild Elymus sibiricus germplasm from the Qinghai-Tibetan plateau in China detected by SRAP markers. Acta Pratacul Sin. 2010;19:173–83.
Vogel KP, Arumuganathan K, Jensen KB. Nuclear DNA content of perennial grasses of the Triticeae. Crop Sci. 1999;39:661–7.
Zhou W, Hu YY, Sui ZH, Fu F, Wang JG, Chang LP, Guo WH, Li BB. Genome survey sequencing and genetic background characterization of Gracilariopsis lemaneiformis (Rhodophyta) based on next-generation sequencing. PLoS One. 2013;8:e69909.
Jiang GL. Molecular marker-assisted breeding: a plant breeder's review. Cham: Springer; 2015. p. 431–72.
Zhou XJ, Dong Y, Zhao JJ, Huang L, Ren XP, Chen YN, Huang SM, Liao BS, Lei Y, Yan LY, Jiang HF. Genomic survey sequencing for development and validation of single-locus SSR markers in peanut (Arachis hypogaea L.). BMC Genomics. 2016;17:420.
Sharma MK, Sharma R, Cao PJ, Jenkins J, Bartley LE, Qualls M, Grimwood J, Schmutz J, Rokhsar D, Ronald PC. A genome-wide survey of switchgrass genome structure and organization. PLoS One. 2012;7:e33892.
**ao J, Zhao J, Liu MJ, Liu P, Dai L, Zhao ZH. Genome-wide characterization of simple sequence repeat (SSR) loci in chinese jujube and jujube SSR primer transferability. PLoS One. 2015;10:e127812.
An JY, Yin MQ, Zhang Q, Gong DT, Jia XW, Guan YJ, Hu J. Genome survey sequencing of Luffa Cylindrica L. and microsatellite high resolution melting (SSR-HRM) analysis for genetic relationship of Luffa genotypes. Int J Mol Sci. 2017;18:1942.
Fluch S, Burg A, Kopecky D, Homolka A, Spiess N, Vendramin GG. Characterization of variable EST SSR markers for Norway spruce (Picea abies L.). BMC Res. Notes. 2011;4:401.
Zhang Q, Li J, Zhao YB, Korban SS, Han YP. Evaluation of genetic diversity in Chinese wild apple species along with apple cultivars using SSR markers. Plant Mol Biol Rep. 2012;30:539–46.
Chen S, Nelson MN, Ghamkhar K, Fu T, Cowling WA. Divergent patterns of allelic diversity from similar origins: the case of oilseed rape (Brassica napus L.) in China and Australia. Genome. 2008;51:1–10.
Tempel S. Using and understanding RepeatMasker. Evry: Humana Press; 2012. p. 29–51.
Untergasser A, Cutcutache I, Koressaar T, Ye J, Faircloth BC, Remm M, Rozen SG. Primer3--new capabilities and interfaces. Nucleic Acids Res. 2012;40:e115.
Rahardja D, Zhao YD, Qu Y. Sample size determinations for the wilcoxon–mann–Whitney test: a comprehensive review. Stats in Biopharmaceutical Research. 2009;1:317–22.
Byrne SL, Nagy I, Pfeifer M, Armstead I, Swain S, Studer B, Mayer K, Campbell JD, Czaban A, Hentrup S, Panitz F, Bendixen C, Hedegaard J, Caccamo M, Asp T. A synteny-based draft genome sequence of the forage grass Lolium perenne: for cell and molecular biology. Plant J. 2015;84:816–26.
Bertioli DJ, Jenkins J, Clevenger J, Dudchenko O, Gao DC, Seijo G, Leal-Bertioli SCM, Ren LH, Farmer AD, Pandey MK. The genome sequence of segmental allotetraploid peanut Arachis hypogaea. Nat Genet. 2019;51:877–84.
Zimin AV, Puiu D, Hall R, Kingan S, Clavijo BJ, Salzberg SL. The first near-complete assembly of the hexaploid bread wheat genome. Triticum aestivum Gigascience. 2017;6:1–7.
Mascher M, Gundlach H, Himmelbach A, Beier S, Twardziok SO, Wicker T, Radchuk V, Dockter C, Hedley PE, Russell J. A chromosome conformation capture ordered sequence of the barley genome. Nature. 2017;544:427–33.
Zhao GY, Zou C, Li K, Wang K, Li TB, Gao LF, Zhang XX, Wang HJ, Yang ZJ, Liu X. The Aegilops tauschii genome reveals multiple impacts of transposons. Nat Plants. 2017;3:946–55.
Ling HQ, Zhao SC, Liu DC, Wang JY, Sun H, Zhang C, Fan HJ, Li D, Dong LL, Tao Y. Draft genome of the wheat A-genome progenitor Triticum urartu. Nature. 2013;496:87–90.
The International Brachypodium Initiative. Genome sequencing and analysis of the model grass Brachypodium distachyon. Nature. 2010;463:763–8.
International Rice Genome Sequencing Project. The map-based sequence of the rice genome. Nature. 2005;436:793–800.
Paterson AH, Bowers JE, Bruggmann R, Dubchak I, Grimwood J, Gundlach H, Haberer G, Hellsten U, Mitros T, Poliakov A. The Sorghum bicolor genome and the diversification of grasses. Nature. 2009;457:511–6.
Byrne S, Panitz F, Hedegaard J, Bendixen C, Studer B, Farrell JD, Swain S, Armstead I, Caccamo M, Asp T. De novo genome sequencing of perennial ryegrass (Lolium perenne). Int Plant & Animal Genome Conference XX. 2011.
Jiao YP, Peluso P, Shi JH, Liang T, Stitzer MC, Wang B, Campbell MS, Stein JC, Wei XH, Chin CS. Improved maize reference genome with single-molecule technologies. Nature. 2017;546:524–7.
Liu RJ, Lu XW, Dou QW. Development of SSR markers in Elymus nutans based on reduced-representation genome sequencing. Mol Plant Breed. 2018;16:1888–94.
Zhou Q, Luo D, Ma LC, **e WG, Wang Y, Wang YR, Liu ZP. Development and cross-species transferability of EST-SSR markers in Siberian wildrye (Elymus sibiricus L.) using Illumina sequencing. Sci. Rep. 2016;6:20549.
Blanca J, Canizares J, Roig C, Ziarsolo P, Nuez F, Picó B. Transcriptome characterization and high throughput SSRs and SNPs discovery in Cucurbita pepo (Cucurbitaceae). BMC Genomics. 2011;12:104.
Kantety RV, Rota ML, Matthews DE, Sorrells ME. Data mining for simple sequence repeats in expressed sequence tags from barley, maize, rice, sorghum and wheat. Plant Mol Biol. 2002;48:501–10.
Qin Z, Cai ZQ, **a GM, Wang MC. Synonymous codon usage bias is correlative to intron number and shows disequilibrium among exons in plants. BMC Genomics. 2013;14:56.
Tóth G, Gáspári Z, Jurka J. Microsatellites in different eukaryotic genomes: survey and analysis. Genome Res. 2000;10:967–81.
Shulaev V. The genome of woodland strawberry (Fragaria vesca). Nat Genet. 2011;43:109–16.
Li HT, Younas M, Wang XF, Li XM, Chen L, Zhao B, Chen X, Xu JS, Hou F, Hong BH. Development of a core set of single-locus SSR markers for allotetraploid rapeseed (Brassica napus L.). Theor. Appl. Genet. 2013;126:937–47.
Varshney RK, Thiel T, Sretenovic-Rajicic T, Baum M, Valkoun J, Guo P, Grando S, Ceccarelli S, Graner A. Identification and validation of a core set of informative genic SSR and SNP markers for assaying functional diversity in barley. Mol Breed. 2008;22:1–13.
Botstein D, White RL, Skolnick M. Construction of a genetic linkage map in man using restriction fragment length polymorphisms. Am J Hum Genet. 1980;32:314.
Lei YT, Zhao YY, Yu F, Li Y, Dou QW. Development and characterization of 53 polymorphic genomic-SSR markers in Siberian wildrye (Elymus sibiricus L.). Conserv Genet Resour. 2014;6:861–4.
Eujayl I, Sorrells ME, Baum M, Wolters P, Powell W. Isolation of EST-derived microsatellite markers for genoty** the a and B genomes of wheat. Theor Appl Genet. 2002;104:399–407.
Altschul SF. Basic local alignment search tool (BLAST). J Mol Biol. 1990;215:403–10.
Li RQ, Li YR, Kristiansen K, Wang J. SOAP: short oligonucleotide alignment program. Bioinformatics. 2008;24:713–4.
Luo RB, Liu BH, **e YL, Li ZY, Huang WH, Yuan JY, He GZ, Chen YX, Pan Q, Liu YJ. SOAPdenovo2: an empirically improved memory-efficient short-read de novo assembler. Gigascience. 2012;1:18.
The International Barley Genome Sequencing Consortium. A physical, genetic and functional sequence assembly of the barley genome. Nature. 2012;491:711–6.
Lowe TM, Chan PP. tRNAscan-SE on-line: integrating search and context for analysis of transfer RNA genes. Nucleic Acids Res. 2016;44:W54–7.
Bao W, Kojima KK, Kohany O. Repbase update, a database of repetitive elements in eukaryotic genomes. Mob DNA. 2015;6:11.
Thiel T, Michalek W, Varshney R, Graner A. Exploiting EST databases for the development and characterization of gene-derived SSR-markers in barley (Hordeum vulgare L.). Theor. Appl. Genet. 2003;106:411–22.
Schuler GD. Sequence map** by electronic PCR. Genome Res. 1997;7:541–50.
Hampl V, Pavlicek A, Flegr J. Construction and bootstrap analysis of DNA fingerprinting-based phylogenetic trees with the freeware program FreeTree: application to trichomonad parasites. Int J Syst Evol Microbiol. 2001;51:731–5.
Rohlf FJ. NTSYS-pc: microcomputer programs for numerical taxonomy and multivariate analysis. Am Stat. 1987;41:330.
Falush D, Stephens M, Pritchard JK. Inference of population structure using multilocus genotype data: dominant markers and null alleles. Mol Ecol Notes. 2007;7:574–8.
Earl DA, Vonholdt BM. STRUCTURE HARVESTER: a website and program for visualizing STRUCTURE output and implementing the Evanno method. Conserv Genet Resour. 2012;4:359–61.
Peakall R, Smouse PE. Genalex 6: genetic analysis in excel. Population genetic software for teaching and research. Mol. Ecol. Notes. 2006;6:288–95.
Acknowledgements
The authors thank NPGS (USDA National Plant Germplasm System) for kindly supplying part of plant materials, namely, accessions with PI numbers.
Funding
This work was supported by the National Natural Science Foundation of China (3177131276) and the Key Laboratory of Superior Forage Germplasm in the Qinghai-Tibetan plateau (2020-ZJ-Y03). These funding bodies did not conduct the design of the study and collection, analysis, and interpretation of data and writing the manuscript.
Author information
Authors and Affiliations
Contributions
MX, WWD and LWH conceived and designed the work; XY, XYL, DZX and YJ performed the experiment; XY, LX and XYL analyzed the data and wrote this manuscript. BSQ and YQQ reviewed this manuscript. All authors read and approved the manuscript.
Corresponding author
Ethics declarations
Ethics approval and consent to participate
The authors complied with all relevant institutional, national and international guidelines.
Consent for publication
Not applicable.
Competing interests
The authors declare that they have no conflict of interest.
Additional information
Publisher’s Note
Springer Nature remains neutral with regard to jurisdictional claims in published maps and institutional affiliations.
Supplementary Information
Additional file 1: Table S1.
Predicted gene information of E. sibiricus and its related species.
Additional file 2: Table S2.
Length and ratio of repetitive elements in E. sibiricus.
Additional file 3: Table S3.
Statistics of SSRs in E. sibiricus genome.
Additional file 4: Table S4.
Statistics of SSR motif with different repeat number.
Additional file 5: Table S5.
Wild E. sibiricus accessions used in this study.
Additional file 6: Table S6.
SSR primers used in this study.
Additional file 7: Table S7.
. Genetic indexes of multi loci markers.
Additional file 8: Table S8.
Statistical significance of Mann-Whitney test among PIC, MI, BI and Rp of different markers
Additional file 9: Figure S1.
Example of PAGE electrophoretic picture of single-loci (ESGA-SL-2 and ESGA-SL-9) and multi-locus (ESGA-ML-7 and ESGA-ML-10) markers in this study.
Additional file 10: Figure S2
. The UPGMA dendrogram and genetic structure of 27 studied E. sibiricus based on ESGA-ML markers.
Additional file 11: Figure S3
. The PcoA analysis of 27 studied E. sibiricus based on ESGA-ML markers.
Additional file 12: Figure S4.
The UPGMA dendrogram and genetic structure of 27 studied E. sibiricus based on ESGS markers.
Additional file 13: Figure S5.
The PcoA analysis of 27 studied E. sibiricus based on ESGS markers.
Additional file 14: Figure S6.
The UPGMA dendrogram and genetic structure of 27 studied E. sibiricus based on ES markers.
Additional file 15: Figure S7.
The PcoA analysis of 27 studied E. sibiricus based on ES markers.
Additional file 16: Figure S8.
E. sibiricus cultivar ‘Chuancao No.2’ was identified as tetraploid by flow cytometry. Red color is diploid Hordeum vulgare L., yellow is E. sibiricus cultivar ‘Chuancao No.2’ and pink is hexaploid Triticum aestivum.
Rights and permissions
Open Access This article is licensed under a Creative Commons Attribution 4.0 International License, which permits use, sharing, adaptation, distribution and reproduction in any medium or format, as long as you give appropriate credit to the original author(s) and the source, provide a link to the Creative Commons licence, and indicate if changes were made. The images or other third party material in this article are included in the article's Creative Commons licence, unless indicated otherwise in a credit line to the material. If material is not included in the article's Creative Commons licence and your intended use is not permitted by statutory regulation or exceeds the permitted use, you will need to obtain permission directly from the copyright holder. To view a copy of this licence, visit http://creativecommons.org/licenses/by/4.0/. The Creative Commons Public Domain Dedication waiver (http://creativecommons.org/publicdomain/zero/1.0/) applies to the data made available in this article, unless otherwise stated in a credit line to the data.
About this article

Cite this article
**ong, Y., Lei, X., Bai, S. et al. Genomic survey sequencing, development and characterization of single- and multi-locus genomic SSR markers of Elymus sibiricus L. BMC Plant Biol 21, 3 (2021). https://doi.org/10.1186/s12870-020-02770-0
Received:
Accepted:
Published:
DOI: https://doi.org/10.1186/s12870-020-02770-0