
Abstract
Recent European guidelines have introduced the concept of exercise pulmonary hypertension (ex-PH). However, the clinical characteristics of ex-PH in systemic sclerosis (SSc) remains unknown. We aimed to investigate the characteristics of exercise pulmonary hypertension (ex-PH) in patients with systemic sclerosis (SSc), which are unknown. We retrospectively examined 77 patients with SSc who underwent symptom-limited exercise testing using a cycle ergometer with right heart catheterization at our hospital. Nineteen patients with postcapillary PH were excluded. Fifty-eight patients (median age, 63 years; 55 women) were divided into the overt-PH (n = 18, mean pulmonary arterial pressure [PAP] > 20 mmHg and pulmonary vascular resistance > 2 Wood units at rest), ex-PH (n = 19, mean PAP/cardiac output slope > 3), and non-PH (n = 21) groups. Exercise tolerance and echocardiography results were compared among the groups. Peak oxygen consumption was high in the non-PH group, intermediate in the ex-PH group, and low in the overt-PH group (14.5 vs. 13.0 vs. 12.5 mL/kg/min, p = 0.043), and the minute ventilation/peak carbon dioxide production slope was also intermediate in the ex-PH group (32.2 vs. 32.4 vs. 43.0, p = 0.003). The tricuspid annular plane systolic excursion/systolic PAP ratio decreased from non-PH to ex-PH to overt-PH (0.73 vs. 0.69 vs. 0.55 mm/mmHg, p = 0.018). In patients with SSc, exercise PH may represent an intermediate condition between not having PH and overt PH, according to the new guidelines.
Introduction
Systemic sclerosis (SSc) is a multisystem autoimmune disease characterized by vascular damage and fibrosis of the skin and internal organs. Pulmonary hypertension (PH) affects approximately 7–12% of patients with SSc and is recognized as a major cause of mortality1,2,3. The prognosis of SSc-associated PH (SSc-PH) remains poor, with a reported median survival of 4 years4. Specific immunosuppressive agents and selective pulmonary vasodilators have limited efficacy on SSc-PH, and therapeutic interventions that improve the prognosis have not been established5,6,7.
Recently, attention has been given to the impact of early detection of borderline PH. Borderline PH in patients with SSc is associated with worse outcomes than normal pulmonary arterial pressure (PAP)8. A patient with SSc with borderline PH is also highly likely to progress to overt PH9,10,11, which is recognized as "pre-pulmonary arterial pulmonary hypertension” condition12. Among patients with SSc with a mean PAP > 20 mmHg, one third progress to a mean PAP ≥ 25 within 3 years, with a reported mortality rate of 18% within this period9. The latest European Society of Cardiology (ESC)/European Respiratory Society (ERS) guidelines have introduced changes in the hemodynamic diagnostic criteria for PH13 by lowering the mean PAP threshold from 25 to 20 mmHg. In addition, the guidelines give a class I recommendation for annual risk assessment for PH in patients with SSc, signaling an increasing emphasis on early intervention.
Exercise testing reportedly facilitates early detection of PH, allowing for early intervention and the opportunity to improve outcomes14,15,16,17,18, as well as being useful in characterizing multifactorial exercise intolerance19,20,21,22. In a previous study, compared with normal exercise hemodynamics, exercise PH was associated with increased mortality among patients with SSc (5 years survival: exercise PH vs. non-PH = 82% vs. 93%)23. Exercise PH was also mentioned in the 2022 ESC/ERS guidelines, defined as a mean PAP/cardiac output (CO) slope > 3 mmHg/L/min24. Exercise PH in SSc is considered an early form of PH and is associated with the future development of PH; furthermore, it is known to be closely associated with borderline PH together with worse functional capacity25,26. Although exercise PH is assumed to have similar clinical significance to borderline PH, research on the characteristics of exercise PH in patients with SSc based on the new lower criteria for PH is limited. The clinical features of exercise PH in patients with SSc, such as functional capacity and right heart function, also remain unclear, and elucidating these characteristics may aid in develo** a non-invasive method for early detection of SSc-PH.
Therefore, this study aimed to investigate the characteristics of exercise PH in patients with SSc who underwent exercise stress right heart catheterization (RHC), including echocardiographic parameters and exercise tolerance.
Results
Baseline patient characteristics
The patient flowchart is presented in Fig. 1. Among 77 eligible patients, 19 with postcapillary PH (including exercise hemodynamics), defined as pulmonary arterial wedge pressure (PAWP) > 15 mmHg at rest and/or PAWP ≥ 25 mmHg at peak exercise, were excluded from the study. Therefore, 58 patients (age, 63 [51, 71] years; men/women, 3/55) were included for analysis.
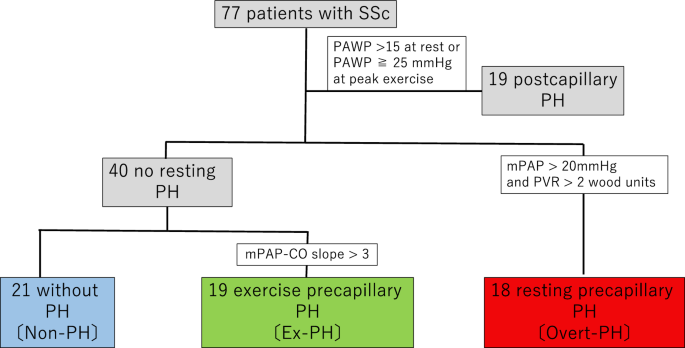
Flowchart of patients with SSc who underwent cardiopulmonary exercise testing with right heart catheterization. CO, cardiac output; ex-PH, exercise pulmonary hypertension, mPAP, mean pulmonary arterial pressure; PAWP, pulmonary arterial wedge pressure; PH, pulmonary hypertension; PVR, pulmonary vascular resistance; SSc, systemic sclerosis.
According to the definition in the 2022 ESC guidelines, 21 of the patients were included in the non-PH group, 19 in the ex-PH group, and 18 in the overt-PH group. According to a previous definition in 201527, there were 47 patients without PH (mean PAP < 25 mmHg) including 15 with borderline PH (mean PAP: 21–24 mmHg). Among those 15 patients, 7 (including 4 with mean PAP/CO slope > 3 mmHg/L/min) were re-classified into the overt-PH group according to the 2022 definition.
Baseline characteristics of the non-PH, ex-PH, and overt-PH groups, defined using the 2022 definition, are summarized in Table 1. The groups did not significantly differ in terms of age, hemoglobin and brain natriuretic peptide concentrations, comorbidities, pulmonary function (except for DLCO % predicted), or 6-min walk distance (6MWD) (Fig. 2A,B).
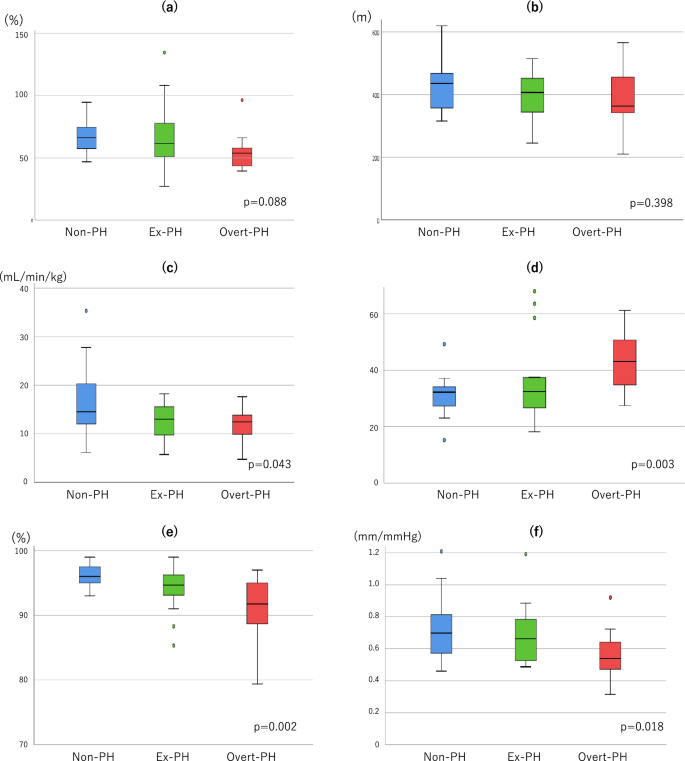
Clinical parameters across different hemodynamic subgroups (a) Diffusing capacity of the lung for carbon monoxide according to the alveolar volume (DLCO/VA %predicted), (b) 6-min walk distance, (c) peak oxygen consumption (VO2), (d) minute ventilation (VE) vs. peak carbon dioxide output (VCO2) slope, (e) oxygen saturation in arterial blood (SaO2) at peak exercise, (f) tricuspid annular plane systolic excursion (TAPSE)/systolic pulmonary arterial pressure (sPAP) ratio. Bars denote medians, boxes denote interquartile ranges, whiskers denote ranges excluding statistical outliers (•) (> 1.5 box lengths from either the 25th or 75th percentiles).
Patients in the overt- and ex-PH groups had a lower resting oxygen (O2) saturation in the arterial blood (SaO2) than those in the non-PH group (non-PH vs. ex-PH vs. overt-PH = 97% [96%, 98%] vs. 95% [95%, 97%] vs. 95% [93%, 96%], p = 0.001).
Exercise hemodynamic parameters
The results of cardiopulmonary exercise testing (CPX) with RHC at rest (after leg raise) and peak in each group are summarized in Table 2. Among the CPX parameters, peak O2 consumption (peak VO2; non-PH vs. ex-PH vs. overt-PH = 14.5 [12.0, 20.3] vs. 13.0 [9.8, 15.6] vs. 12.5 [10.1, 13.7] mL/kg/min, p = 0.043) and minute ventilation (VE) vs. carbon dioxide output (VCO2) slope (non-PH vs. ex-PH vs. overt-PH = 32.2 [27.3, 34.1] vs. 32.4 [26.7, 37.4] vs. 43.0 [34.8, 50.7], p = 0.003) were significantly different between the three groups (Fig. 2C,D). SaO2 at peak exercise was also significantly different between the three groups (non-PH vs. ex-PH vs. overt-PH = 96% [95%, 98%] vs. 95% [93%, 96%] vs. 92% [89%, 95%], p = 0.002) (Fig. 2E). Among exercise parameters, peak VO2, VE vs. VCO2 slope, and SaO2 at peak exercise were intermediate during ex-PH, between those in non-PH and overt-PH.
Echocardiographic parameters
Echocardiographic parameters in the groups are summarized in Table 3. Among the echocardiographic parameters, the TASPE/systolic PAP (sPAP) ratio was significantly different among the three groups (non-PH vs. ex-PH vs. overt-PH = 0.73 ± 0.20 vs. 0.69 ± 0.19 vs. 0.55 ± 0.15 mm/mmHg, p = 0.018) (Fig. 2F). The other parameters representing right ventricular (RV) function were not significantly different among the groups.
Discussion
We have elucidated the impact and characteristics of the exercise PH in the context of the new definition. Most patients who would be diagnosed with borderline PH according to the old definition had ex-PH and were re-classified as overt-PH under the new definition. Based on the results of the 6-min walk test (6MWT) and CPX, exercise tolerance in the ex-PH group was intermediate, between those of the non-PH and overt-PH groups. In addition, the tricuspid annular plane systolic excursion (TAPSE)/sPAP ratio upon echocardiography, which is an RV-pulmonary arterial coupling index, was also intermediate in the ex-PH group. Exercise testing with RHC is necessary for the diagnosis of ex-PH, and assessments with other non-invasive tests remain to be developed. Monitoring and assessment of these parameters may contribute to the early detection and management of PH in patients with SSc, which could improve their clinical outcomes and quality of life. Further research is warranted to validate these results and explore their clinical implications in larger patient cohorts.
Exercise tolerance
In the context of SSc, CPX is a valuable non-invasive tool for the detection of PH. In a previous report, a peak VO2 of 18.7 mL/kg/min or higher was effective to rule out SSc-PH, with a high negative predictive value28. Similarly, in our study, exercise tolerance indicators, such as 6MWD and peak VO2, were gradually decreased from a non-PH state to ex-PH and overt-PH.
However, exercise tolerance in patients with SSc is influenced by several factors and does not reflect hemodynamics alone19. In our current study, even patients with SSc without PH had a 6MWD of 436 m and peak VO2 of 14.5 mL/kg/min, corresponding to the “intermediate risk” category in the comprehensive risk assessment13. Importantly, exercise tolerance is generally lower in patients with SSc, who are predominantly older, than in those with other forms of PH. It is well recognized that SSc, as a systemic disease, leads to reduced exercise capacity due to peripheral/muscular limitations and impaired tissue oxygen extraction19,20. Unlike peak VO2, which is a measure of maximal load, the 6MWD is a measure of submaximal load and is affected by multifactorial exercise intolerance, such as peripheral effects, which may be one reason for the lack of statistically significant differences in 6MWD among the groups in our study.
The elevated VE vs. VCO2 slope in our study indicates abnormal ventilation/perfusion matching and increased dead space ventilation, both of which are associated with pulmonary vascular dysfunction and impaired gas exchange29. Previous reports also suggest that indicators of ventilatory inefficiency such as VE vs. VCO2 slope are useful for detecting PH in SSc, and our results similarly positioned ex-PH between non-PH and overt-PH28. Unlike peak VO2, the VE vs. VCO2 slope in ex-PH corresponds to the “low risk” category in the PH risk classification guidelines13. Because the VE vs. VCO2 slope can be evaluated even at submaximal effort, it may provide a more accurate assessment of risk category than 6MWD and peak VO2, which are sensitive to deconditioning in SSc.
TAPSE/sPAP ratio
The invasive nature of exercise stress testing with RHC poses a challenge owing to the limited availability of facilities capable of performing the test. In contrast, echocardiography is a non-invasive and effective screening tool.
In the recent ESC/ERS guidelines for PH, the established cut-off values for PH screening and key echocardiographic parameters did not change substantially. However, a novel indicator of PH, the TAPSE/sPAP ratio, was introduced13. This ratio combines measures of RV function and pulmonary artery indices, easily assessable via standard echocardiography, serving as an estimate of RV-pulmonary artery coupling30. In PH, progressive pulmonary vascular remodeling augments the load on the contracting RV, consequently modifying RV-pulmonary arterial coupling. A cut-off value of the TAPSE/sPAP ratio for PH screening has been proposed based on a cohort study31, leading to its inclusion as a screening indicator in the updated guidelines. More recent studies have demonstrated its utility in risk stratification and prognostication of patients with PH, including those with SSc32,33. In the SSc EUSTAR cohort, a TAPSE/sPAP ratio < 0.55 mm/mmHg was identified as a risk factor for PH34.
In our study, the TAPSE/sPAP ratio effectively differentiated ex-PH from non-PH and overt-PH. This suggests its potential as an early detection marker for SSc-PH. In our cohort, the TAPSE/sPAP ratio was 0.66 mm/mmHg for ex-PH compared to 0.54 mm/mmHg for overt-PH. Furthermore, in SSc, the TAPSE/sPAP ratio reportedly correlates with peak VO2 and the VE vs. VCO2 slope, parameters derived from CPX, supporting our results that CPX parameters and the TAPSE/sPAP ratio are associated with hemodynamic severity35.
This study had several limitations. It was a retrospective, single-center study, including a relatively small sample size; therefore, the statistical power may not have been sufficient to detect negative outcomes. The study population did not include patients with overt or occult left ventricular diastolic dysfunction. Additionally, some patients with SSc were unable to undergo exercise stress tests owing to orthopedic issues, sarcopenia, and other factors, leading to their exclusion from the study. Our cohort was exclusively Japanese and comprised older and predominantly female patients; therefore, the results of this study may not be generalizable to younger adults or men. Age is known as an important confounder of the pulmonary vascular response during exercise and exercise tolerance, such as peak VO2 and 6MWD.
The definition of exercise PH has been established, and its association with poor prognosis in the population, including patients with SSc, is well-known23,36,37. However, the prognostic impact of the updated definition, where borderline PH (mean PAP: 21–24 mmHg) is now classified as overt PH, remains unclear. Assessing its prognostic impact requires long-term observation and further research exploration.
In conclusion, in patients with SSc, exercise PH may represent an intermediate condition between not having PH and overt PH, according to the new guideline definitions.
Methods
Study participants
In this retrospective, cross-sectional study, we examined consecutive patients with SSc who exhibited dyspnea during exertion, performed owing to suspected or confirmed PH, and who underwent CPX with RHC at our hospital from 2013 to 2022. Definitions of SSc were based on the American College of Rheumatology diagnostic criteria38.
This study was approved by the Committee for Clinical Studies and Ethics of Kyorin University School of Medicine. The purposes and risks of the study were explained to the patients, who provided informed consent prior to participating. All methods were performed in accordance with the relevant guidelines and regulations.
RHC and CPX
RHC was performed with a 6-F, double-lumen, balloon-tipped, flow-directed Swan–Ganz catheter (Harmac Medical Products, Inc., Buffalo, NY, USA) via a transjugular approach, as previously described39. Baseline hemodynamic data were recorded, and the zero-reference level (mid-chest) was adjusted at the start of pressure measurement. Measurements were obtained at the end of normal expirations with patients in the supine position to assess the right ventricular pressure, mean PAP, sPAP, diastolic PAP, and PAWP.
Incremental, symptom-limited CPX was performed with patients in the supine position by using an electromagnetically braked cycle ergometer (Nuclear Imaging Table with Angio Ergometer; Lode BV, Groningen, The Netherlands) and the ramp protocol. The test comprised a 3-min rest period, followed by 3-min warm-up at an ergometer setting of 10 W (60 rpm), and testing with 1-W increase in exercise load every 6 s (totaling 10 W/min). During the exercise, VO2, VCO2, and VE were measured using a metabolic cart (Cpex-1; Inter Reha Co. Ltd., Tokyo, Japan). Peak VO2 was calculated as the average value obtained during the last 30 s of exercise. The VE vs. VCO2 slope was calculated from the start of incremental exercise to the respiratory compensation point by using least-squares linear regression.
Heart rate, arterial blood pressure directly recorded in the radial artery, and electrocardiogram were monitored continuously during the test. PAP and PAWP in the RHC were measured every minute. We used the averaged mean PAP and mean PAWP during several-second periods rather than end-expiratory measurements during exercise. SaO2 and the pulmonary artery (SvO2) were measured at rest and during warm-up, submaximal, and peak exercise. CO was determined via the Fick method, using the following formula: CO (L/min) = VO2/[1.34 × hemoglobin concentration (Hb) × (SaO2 − SvO2)]. The arterial mixed venous oxygen content difference was calculated as follows: 13.4 × Hb × (SaO2 − SvO2)/1000. Pulmonary vascular resistance (PVR) and pulmonary arterial compliance (PAC) were calculated as: PVR (Wood units) = (mean PAP – PAWP)/CO and PAC = stroke volume/pulse pressure. The mean PAP/CO slope was calculated from multipoint plots of the mean PAP and CO by using least-squares linear regression40.
The 6MWT was performed according to American Thoracic Society guidelines without supplemental O2 one day before RHC41.
Echocardiography
A transthoracic Doppler echocardiogram was obtained with the patient in the resting state and digitally stored on an Artida (Toshiba, Tokyo, Japan) or EPIQ (Philips Healthcare, Cambridge, MA USA) ultrasound system within 3 months of the RHC. Left ventricular ejection fraction was calculated using Simpson’s biplane method in the apical four- and two-chamber views. Left atrial volume was measured in the same way and was indexed according to body surface area. Mitral inflow was assessed in the apical four-chamber view with the pulsed-wave Doppler sample volume placed at the tips of the mitral valve leaflets during diastole; accordingly, the early (E) and late peak diastolic velocities of the mitral inflow and the E-wave deceleration time were measured. Mitral annular motion was assessed using pulsed-wave tissue Doppler imaging with the sample volume placed in the septal (e’ septal). Subsequently, the E/e’ ratio was calculated. Tricuspid regurgitation peak velocity and inferior vena cava diameter (right atrial pressure estimation) were used to calculate sPAP by using the Bernoulli equation in the absence of laminar tricuspid regurgitation and/or pulmonary stenosis. The RV systolic function was assessed by measuring TAPSE. Subsequently, the TAPSE/sPAP ratio was calculated. The RV end-diastolic area (RVEDarea) and end-systolic area (RVESarea) were assessed via manual planimetry in the apical four-chamber view, and the RV fractional area change (RVFAC) was derived using the formula: RVFAC = [(RVEDarea-RVESarea)/RVEDarea] × 100.
Hemodynamic definitions
Based on the 2022 ESC guidelines13, patients with SSc were divided into three different groups according to their resting and exercise hemodynamics: 1) overt PH (mean PAP at rest > 20 mmHg and PVR at rest > 2 Wood units; 2) exercise PH (ex-PH, mean PAP/CO slope > 3 mmHg/L/min); and 3) non-PH (without PH) groups.
Statistical analysis
Continuous variables are presented as mean ± standard deviation or medians (25th quartile, 75th quartile). The Shapiro–Wilk test and histogram analyses were performed to assess datasets for normality. Comparisons of more than two groups were performed using a one-way analysis of variance (with the Tukey post-hoc test) or the Kruskal–Wallis test (with Dunn’s post-hoc test), as appropriate. Categorical variables are presented as frequencies (percentages) and were compared using the Fisher’s exact test or Pearson’s χ2 test. Analyses were performed using SPSS Statistics for Windows (version 26.0; IBM Corp., Armonk, NY, USA).
Data availability
All data generated or analyzed during this study are included in this article. Further inquiries can be directed to the corresponding authors.
References
Steen, V. D. & Medsger, T. A. Changes in causes of death in systemic sclerosis, 1972–2002. Ann. Rheum Dis. 66, 940–944. https://doi.org/10.1136/ard.2006.066068 (2007).
Hachulla, E. et al. The three-year incidence of pulmonary arterial hypertension associated with systemic sclerosis in a multicenter nationwide longitudinal study in France. Arthritis Rheum. 60, 1831–1839. https://doi.org/10.1002/art.24525 (2009).
Kolstad, K. D., Li, S., Steen, V., Chung, L. & Investigators, P. Long-term outcomes in systemic sclerosis-associated pulmonary arterial hypertension from the pulmonary hypertension assessment and recognition of outcomes in scleroderma registry (PHAROS). Chest 154, 862–871. https://doi.org/10.1016/j.chest.2018.05.002 (2018).
Rubenfire, M. et al. Survival in systemic sclerosis with pulmonary arterial hypertension has not improved in the modern era. Chest 144, 1282–1290. https://doi.org/10.1378/chest.12-0653 (2013).
Chung, L. et al. Characterization of connective tissue disease-associated pulmonary arterial hypertension from REVEAL: Identifying systemic sclerosis as a unique phenotype. Chest 138, 1383–1394. https://doi.org/10.1378/chest.10-0260 (2010).
Condliffe, R. et al. Connective tissue disease-associated pulmonary arterial hypertension in the modern treatment era. Am. J. Respir. Crit. Care Med. 179, 151–157. https://doi.org/10.1164/rccm.200806-953OC (2009).
Hassan, H. J. et al. Improved Survival for Patients with Systemic Sclerosis-associated Pulmonary Arterial Hypertension: The Johns Hopkins Registry. Am. J. Respir. Crit. Care Med. 207, 312–322. https://doi.org/10.1164/rccm.202204-0731OC (2023).
Douschan, P. et al. Mild Elevation of Pulmonary Arterial Pressure as a Predictor of Mortality. Am. J. Respir. Crit Care Med. 197, 509–516. https://doi.org/10.1164/rccm.201706-1215OC (2018).
Valerio, C. J., Schreiber, B. E., Handler, C. E., Denton, C. P. & Coghlan, J. G. Borderline mean pulmonary artery pressure in patients with systemic sclerosis: Transpulmonary gradient predicts risk of develo** pulmonary hypertension. Arthritis Rheum. 65, 1074–1084. https://doi.org/10.1002/art.37838 (2013).
Visovatti, S. H. et al. Borderline pulmonary arterial pressure in systemic sclerosis patients: A post-hoc analysis of the DETECT study. Arthritis Res. Ther. 16, 493. https://doi.org/10.1186/s13075-014-0493-1 (2014).
Coghlan, J. G. et al. Incidence of pulmonary hypertension and determining factors in patients with systemic sclerosis. Eur. Respir. J. https://doi.org/10.1183/13993003.01197-2017 (2018).
Kovacs, G. & Olschewski, H. Borderline pulmonary pressures in scleroderma—A “pre-pulmonary arterial hypertension” condition?. Arthritis Res. Ther. 17, 123. https://doi.org/10.1186/s13075-015-0649-7 (2015).
Humbert, M. et al. 2022 ESC/ERS Guidelines for the diagnosis and treatment of pulmonary hypertension. Eur. Heart J. 43, 3618–3731. https://doi.org/10.1093/eurheartj/ehac237 (2022).
Weatherald, J. et al. Screening for pulmonary arterial hypertension in systemic sclerosis. Eur. Respir. Rev. https://doi.org/10.1183/16000617.0023-2019 (2019).
Humbert, M. et al. Screening for pulmonary arterial hypertension in patients with systemic sclerosis: Clinical characteristics at diagnosis and long-term survival. Arthritis Rheum. 63, 3522–3530. https://doi.org/10.1002/art.30541 (2011).
D’Alto, M. et al. Inappropriate exercise-induced increase in pulmonary artery pressure in patients with systemic sclerosis. Heart 97, 112–117. https://doi.org/10.1136/hrt.2010.203471 (2011).
Kusunose, K. et al. Echocardiographic Predictors for Worsening of Six-Minute Walk Distances in Patients With Systemic Sclerosis (Scleroderma). Am. J. Cardiol. 120, 315–321. https://doi.org/10.1016/j.amjcard.2017.04.024 (2017).
Nagel, C. et al. Stress Doppler echocardiography for early detection of systemic sclerosis-associated pulmonary arterial hypertension. Arthritis Res. Ther. 17, 165. https://doi.org/10.1186/s13075-015-0673-7 (2015).
Martis, N. et al. Limited exercise capacity in patients with systemic sclerosis: Identifying contributing factors with cardiopulmonary exercise testing. J. Rheumatol. 45, 95–102. https://doi.org/10.3899/jrheum.161349 (2018).
Brown, J. T. et al. Reduced exercise capacity in patients with systemic sclerosis is associated with lower peak tissue oxygen extraction: a cardiovascular magnetic resonance-augmented cardiopulmonary exercise study. J. Cardiovasc. Magn. Reson. 23, 118. https://doi.org/10.1186/s12968-021-00817-1 (2021).
Baptista, R. et al. Exercise echocardiography for the assessment of pulmonary hypertension in systemic sclerosis: A systematic review. Arthritis Res. Ther. 18, 153. https://doi.org/10.1186/s13075-016-1051-9 (2016).
Condliffe, R. Unmasking hidden disease: Exercise pulmonary haemodynamics in systemic sclerosis. Eur. Respir. J. https://doi.org/10.1183/13993003.00885-2017 (2017).
Stamm, A. et al. Exercise pulmonary haemodynamics predict outcome in patients with systemic sclerosis. Eur. Respir. J. 48, 1658–1667. https://doi.org/10.1183/13993003.00990-2016 (2016).
Zeder, K. et al. Diagnostic, prognostic and differential-diagnostic relevance of pulmonary haemodynamic parameters during exercise: a systematic review. Eur. Respir. J. https://doi.org/10.1183/13993003.03181-2021 (2022).
Lau, E. M. et al. Resting pulmonary artery pressure of 21–24 mmHg predicts abnormal exercise haemodynamics. Eur. Respir. J. 47, 1436–1444. https://doi.org/10.1183/13993003.01684-2015 (2016).
Oliveira, R. K. F. et al. Functional impact of exercise pulmonary hypertension in patients with borderline resting pulmonary arterial pressure. Pulm Circ. 7, 654–665. https://doi.org/10.1177/2045893217709025 (2017).
Galie, N. et al. 2015 ESC/ERS Guidelines for the diagnosis and treatment of pulmonary hypertension: The Joint Task Force for the Diagnosis and Treatment of Pulmonary Hypertension of the European Society of Cardiology (ESC) and the European Respiratory Society (ERS): Endorsed by: Association for European Paediatric and Congenital Cardiology (AEPC), International Society for Heart and Lung Transplantation (ISHLT). Eur. Heart. J. 37, 67–119. https://doi.org/10.1093/eurheartj/ehv317 (2016).
Dumitrescu, D. et al. Cardiopulmonary exercise testing for detecting pulmonary arterial hypertension in systemic sclerosis. Heart 103, 774–782. https://doi.org/10.1136/heartjnl-2016-309981 (2017).
Chua, T. P. et al. Clinical correlates and prognostic significance of the ventilatory response to exercise in chronic heart failure. J. Am. Coll. Cardiol. 29, 1585–1590. https://doi.org/10.1016/s0735-1097(97)00078-8 (1997).
Fauvel, C. et al. Interest of TAPSE/sPAP ratio for noninvasive pulmonary arterial hypertension risk assessment. J. Heart Lung. Transplant 41, 1761–1772. https://doi.org/10.1016/j.healun.2022.09.005 (2022).
Huston, J. H. et al. Association of Mild Echocardiographic Pulmonary Hypertension With Mortality and Right Ventricular Function. JAMA Cardiol. 4, 1112–1121. https://doi.org/10.1001/jamacardio.2019.3345 (2019).
Tello, K. et al. Relevance of the TAPSE/PASP ratio in pulmonary arterial hypertension. Int. J. Cardiol. 266, 229–235. https://doi.org/10.1016/j.ijcard.2018.01.053 (2018).
Grimaldi, M. C. et al. The prognostic role of the echocardiographic tricuspid annular plane systolic excursion/systolic pulmonary arterial pressure (TAPSE/sPAP) ratio and its relationship with NT-proANP plasma level in systemic sclerosis. Front. Cardiovasc. Med. 9, 1021048. https://doi.org/10.3389/fcvm.2022.1021048 (2022).
Colalillo, A. et al. The role of TAPSE/sPAP ratio in predicting pulmonary hypertension and mortality in the systemic sclerosis EUSTAR cohort. Autoimmun. Rev. https://doi.org/10.1016/j.autrev.2023.103290 (2023).
Colalillo, A., Pellicano, C., Romaniello, A. & Rosato, E. In systemic sclerosis TAPSE/sPAP ratio is correlated with ventilatory efficiency and exercise capacity assessed by CPET. Clin. Exp. Med. 23, 365–369. https://doi.org/10.1007/s10238-022-00804-5 (2023).
Zeder, K. et al. Exercise pulmonary resistances predict long-term survival in systemic sclerosis. Chest 159, 781–790. https://doi.org/10.1016/j.chest.2020.08.2110 (2021).
Douschan, P. et al. Prognostic Value of Exercise as Compared to Resting Pulmonary Hypertension in Patients with Normal or Mildly Elevated Pulmonary Arterial Pressure. Am. J. Respir. Crit. Care Med. 206, 1418–1423. https://doi.org/10.1164/rccm.202112-2856LE (2022).
van den Hoogen, F. et al. 2013 classification criteria for systemic sclerosis: an American college of rheumatology/European league against rheumatism collaborative initiative. Ann. Rheum. Dis. 72, 1747–1755. https://doi.org/10.1136/annrheumdis-2013-204424 (2013).
Mohri, T. et al. High prevalence of occult left ventricular diastolic dysfunction detected by exercise stress test in systemic sclerosis. Sci. Rep. 12, 2423. https://doi.org/10.1038/s41598-022-06400-7 (2022).
Kovacs, G. et al. An official European Respiratory Society statement: pulmonary haemodynamics during exercise. Eur. Respir. J. https://doi.org/10.1183/13993003.00578-2017 (2017).
ATS statement: guidelines for the six-minute walk test. Am. J. Respir. Crit. Care Med. 166, 111-117, https://doi.org/10.1164/ajrccm.166.1.at1102 (2002).
Funding
This research did not receive any specific grant from funding agencies in the public, commercial, or not-for-profit sectors.
Author information
Authors and Affiliations
Contributions
YK and AG designed the study, analyzed the data, and wrote the manuscript. TK and KS reviewed the data and edited the manuscript. TM, ST, KT, HK, and TI performed the exercise tests.
Corresponding author
Ethics declarations
Competing interests
The authors declare no competing interests.
Additional information
Publisher's note
Springer Nature remains neutral with regard to jurisdictional claims in published maps and institutional affiliations.
Rights and permissions
Open Access This article is licensed under a Creative Commons Attribution 4.0 International License, which permits use, sharing, adaptation, distribution and reproduction in any medium or format, as long as you give appropriate credit to the original author(s) and the source, provide a link to the Creative Commons licence, and indicate if changes were made. The images or other third party material in this article are included in the article's Creative Commons licence, unless indicated otherwise in a credit line to the material. If material is not included in the article's Creative Commons licence and your intended use is not permitted by statutory regulation or exceeds the permitted use, you will need to obtain permission directly from the copyright holder. To view a copy of this licence, visit http://creativecommons.org/licenses/by/4.0/.
About this article

Cite this article
Kanazawa, Y., Goda, A., Mohri, T. et al. Exercise pulmonary hypertension in patients with systemic sclerosis based on updated guidelines. Sci Rep 14, 13358 (2024). https://doi.org/10.1038/s41598-024-63823-0
Received:
Accepted:
Published:
DOI: https://doi.org/10.1038/s41598-024-63823-0
- Springer Nature Limited