

Abstract
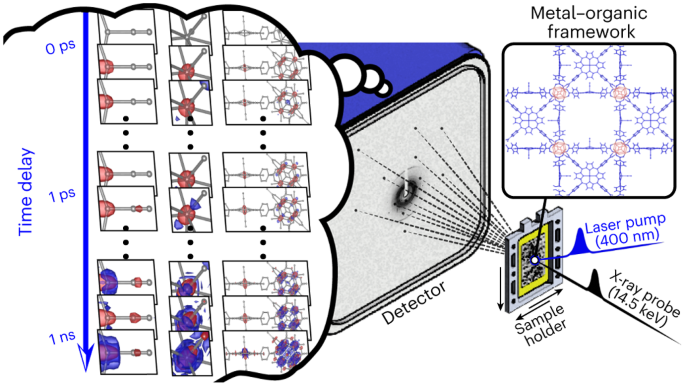
Crystalline systems consisting of small-molecule building blocks have emerged as promising materials with diverse applications. It is of great importance to characterize not only their static structures but also the conversion of their structures in response to external stimuli. Femtosecond time-resolved crystallography has the potential to probe the real-time dynamics of structural transitions, but, thus far, this has not been realized for chemical reactions in non-biological crystals. In this study, we applied time-resolved serial femtosecond crystallography (TR-SFX), a powerful technique for visualizing protein structural dynamics, to a metal–organic framework, consisting of Fe porphyrins and hexazirconium nodes, and elucidated its structural dynamics. The time-resolved electron density maps derived from the TR-SFX data unveil trifurcating structural pathways: coherent oscillatory movements of Zr and Fe atoms, a transient structure with the Fe porphyrins and Zr6 nodes undergoing doming and disordering movements, respectively, and a vibrationally hot structure with isotropic structural disorder. These findings demonstrate the feasibility of using TR-SFX to study chemical systems.
Main
Novel crystalline materials consisting of organic, inorganic or organometallic building blocks have inspired intense investigation of their structures and chemical properties, as well as their applications as materials for the capture and separation of gases1,2,3,4,Kinetic modelling Using the obtained time constants, we constructed a kinetic model that matches the behaviour of the major RSVs. The kinetic model consists of three structural species: a species corresponding to the oscillatory motion (Iosc) with a period of 5.55 ps and a dam** constant of 2.68 ps, a second species corresponding to the transient structure (Itr), which forms instantaneously (within the IRF of the experiment) upon photoexcitation and decays with a time constant of 47.1 ps, and a third species corresponding to the vibrationally hot structure (Ihot), which persists up to 3 ns. Through a kinetic analysis using the kinetic model, we extracted the species-associated DED (SADED) maps corresponding to each of these species. The entire DED maps of PCN–224(Fe)–CO were used in this procedure, rather than the maps of just the regions around the Zr6 node or FeCO site. The SADED maps are shown in Fig. 3a. The characteristic feature in the SADED map of Ihot is the strong negative densities at the original positions of FeCO and the Zr atoms surrounded by strong isotropic positive densities, as revealed in the time-resolved DED maps shown in Fig. 2. By analysing the temporal profile of the SADED for Ihot, we found that the thermal contribution rises with two exponential time constants of 1.143 ± 0.005 and 11.32 ± 0.07 ps (Fig. 3b). In contrast to the isotropic positive densities observed for Ihot, the SADED map of Itr exhibits distinct anisotropic features. In the ground state, the Zr atom is inherently disordered in two adjacent positions, with the axis connecting them defined as the d axis. Itr exhibits a pair of strong positive densities at peripheral positions along this axis. This implies that the disorder of the Zr atoms is further enhanced along the d axis in Itr. The Fe porphyrin shows a strong negative feature at the position of the CO ligand, consistent with the photodissociation of CO. In addition, a positive feature is observed between the original Fe and C atom positions, and a negative feature is visible below the original Fe atom position, indicating that the Fe atom has moved away from the haem centre. In other words, the porphyrin already domed (exhibiting an out-of-plane displacement) in the ground state undergoes more intense doming in Itr. Finally, the SADED map of Iosc shows similar features to the SADED map for Itr in the Zr6 node, whereas the FeCO site shows distinct features: a negative density is evident at the original position of the Fe atom, with two strong positive densities above and below the negative density along the axis connecting the Fe and CO ligand. These features indicate that the structural identity of Iosc stems from the oscillation of the Zr atoms in the Zr6 node along the d axis and the simultaneous oscillation of the Fe atom in the Fe porphyrin along the axis connecting the CO ligand. a, SADED maps of the oscillatory structure, Iosc (left), the transient structure, Itr (centre), and the vibrationally hot structure, Ihot (right). The top panels show the SADED maps of the entire PCN–224(Fe)–CO, and the middle and bottom panels show the SADED maps of the Zr6 node and FeCO site, respectively. The red and blue colours show the negative and positive EDs, respectively, contoured at ±3σ (0.16 e Å−3 for Iosc, 0.09 e Å−3 for Itr and 0.43 e Å−3 for Ihot) in the top and middle panels and contoured at ±2σ (0.1 e Å−3 for Iosc, 0.06 e Å−3 for Itr and 0.28 e Å−3 for Ihot) in the bottom panels. Each σ represents the rms value calculated by taking the rms of the DED values for the corresponding SADED map. b, Time profiles of the SADED maps. The time-dependent contributions of the SADEDs of the three species (circles) to the DED maps at each time delay are fitted by the kinetic model described in the main text (solid line). The excellent agreement between the experimental data and the theoretical fit (dotted line) proves the validity of the kinetic model. Note that the size of the error bars is increased 50-fold to increase the visibility. The time axis scales are linear up to 5 ps and logarithmic thereafter. Iosc shows an oscillation with a period of 5.55 ps and dam** time constant of 2.68 ps. Itr appears within 200 fs and decays with a time constant of 47.1 ps. Ihot rises with time constants of 1.143 and 11.32 ps. To extract the structures of the three species from the SADEDs, the extrapolated structure factors (Fextr) were obtained from the following three factors: the photoconversion yields, the structure factors of the SADEDs and the structure factors of the ground state (Methods). We have the structure factors (F) when the conversion yield is 0, which is the structure factor of the ground-state structure, and the species-associated difference structure factor amplitudes (Δ|F|SA; obtained by inverse Fourier transformation of the SADED), which corresponds to the actual conversion yield. With these two values as a starting point, we can determine Fextr, corresponding to the conversion yield of unity, through linear extrapolation. The estimated Fextr values represent the structure factors of the structural species. We obtained the atomic structures of the structural species from Fextr by applying structure refinement to the square of Fextr. The refined structures and the corresponding EDs of the extrapolated maps are presented in Fig. 4. The crystallographic data are provided in Extended Data Table 1 and the key structural parameters are summarized in Table 1. A distinguishing characteristic of the three species is the position of the Fe atom. Compared with the ground state, the Fe atom in the Itr structure shows an increase in doming of 0.119 Å. This enhanced doming of Itr compared with the ground state is consistent with previously reported structures of Fe tetraphenylporphyrin, which is similar to the Fe porphyrin building block in the PCN–224(Fe) MOF. Previous studies have shown that the degree of doming is influenced by the coordination number of the Fe atom33,34. In the presence of a CO ligand, the pentacoordinate Fe atom is displaced out of the plane by ~0.2 Å. In the absence of any bound axial ligands, the tetracoordinate Fe atom is displaced out of the plane by ~0.4 Å, indicating an additional doming of 0.2 Å compared with the displacement with CO binding. The observed enhanced doming of 0.119 Å for Itr, occurring together with CO photodissociation, agrees with the reported 0.2 Å increase in doming for the tetracoordinate geometry of the Fe atom. In the Iosc structure, the Fe atom seems to oscillate vertically from the original position (approximately 0.443 Å upwards and 0.312 Å downwards). The Ihot structure resembles the ground state, with only minor variations in the bond lengths. For the Zr6 node, the Zr atoms of all three species are moved out further along the d axis, with distinct Zr–Zr distances ranging from 0.891 to 1.057 Å. The observed structural changes in the Zr6 node correlate with the out-of-plane doming motion of the Fe atom, demonstrating a strong positive correlation between the Zr–Zr distance and the degree of Fe doming (Table 1). Both the kinetics and SADED maps of the three structural species are generally consistent with those of myoglobin, one of the most well-studied Fe porphyrin-containing systems, but a number of differences are also observed, as detailed in Supplementary Discussion. The extrapolated maps of the three species Iosc, Itr and Ihot for the Zr6 node region (top) and FeCO site (bottom). The extrapolated maps were generated using the SADED maps shown in Fig. 3, the ED map of the ground-state structure and the photoconversion yield. Specifically, an extrapolated map was obtained for each species by refining the structure factors that were generated through a linear combination of the structure factors derived from the corresponding SADED and ground-state ED maps. The photoconversion yield of each species was extrapolated to 100%, meaning that each species exists in a pure form. The details of the generation of the extrapolated maps and subsequent structure refinement to obtain the structures of the three species are reported in Methods. The yellow isosurfaces are contoured at 2σ (1.5 e Å−3 for Iosc, 1.3 e Å−3 for Itr and 1.3 e Å−3 for Ihot). Each σ represents the rms value calculated by taking the rms of the ED values for the corresponding extrapolated map. The green and magenta spheres represent the positions of both the metal atoms Zr and Fe in the ground-state structure and the three structural species, respectively. The viewing perspective of the Zr6 node region is altered compared with the viewing perspective shown in Fig. 3 for better visualization, whereas that of the FeCO site is identical. Figure 5 schematically illustrates the trifurcating structural pathways unveiled in this study. As the Zr6 node does not absorb 400 nm photons, the transient disordering motions of the Zr atoms must be caused by the photon-absorbing Fe porphyrin sites. Thus, the organized anisotropic movement of the Fe porphyrin and Zr6 node observed at early time delays implies that the structural perturbation caused by the dissociation of the CO ligand from the Fe atom is instantly transferred to the Zr6 node, causing organized structural changes in the Zr6 node. Such movements exhibit even coherent oscillations in both the Zr6 node and FeCO in the Fe porphyrin. We note that an oscillatory component has rarely been visualized directly in the form of a DED map in previous studies with time-resolved crystallography. The large number of time points and high signal-to-noise ratios of the data acquired in this work were critical to capturing this DED feature. The oscillatory motion has a period of 5.55 ps, which corresponds to 6.01 cm−1 or 0.18 THz. The SADED map of Iosc associated with oscillation at 0.18 THz exhibits organized movement at the photon-absorbing porphyrin site and remote zirconium site. Such a slow oscillatory motion is rarely observed in small molecules, but is feasible as a phonon mode in a solid sample. In general, the low-frequency phonon modes of MOFs originate from the acoustic phonon modes related to the motion of the ‘chain’ between the node and the linker35,36. Theoretical studies reported that the transverse or longitudinal acoustic phonons of MOFs directed along the Γ–X axis, corresponding to the direction connecting ligands and metal clusters, exhibit frequencies below 0.3 THz35,37. The observed features in the SADED map of Iosc are not consistent with those of acoustic photon modes. For example, according to Fig. 3, of the four O atoms connected to each Zr atom in the Zr6 node (Fig. 1a), the change in the DED of Zr is directed towards the O atom that lies on the d axis rather than along the axis connecting the Fe porphyrin and Zr6 node. In addition, Fe in the linker porphyrin shows a doming motion, which corresponds to a bending motion in the out-of-plane direction. These motions are different from the low-lying acoustic phonons of MOFs. According to the theoretical study35, similar motions correspond to the lowest-energy optical phonon of a MOF with Mg nodes with a frequency of 0.57 THz, although this is considerably higher than that observed in this work. Meanwhile, this theoretical study also suggested that the phonon frequency can decrease as the metal node becomes heavier. Considering this, the lower frequency (0.18 THz) of the optical phonon mode observed for PCN–224(Fe)–CO can be attributed to the heavier Zr6 node than Mg and Ca clusters used in theoretical calculation35. Based on these considerations, the DED feature observed for Iosc originates from the optical phonon mode activated by photoexcitation rather than acoustic phonons. Later, the vibrationally hot structure with isotropic features (Ihot) comes to dominate over time. It should be noted that DED maps from such vibrationally hot structures are rarely observed in protein crystals. The lack of vibrationally hot features in protein crystals is probably due to the presence of water and buffer molecules in the protein crystals, which effectively absorb the heat generated by the absorption. In summary, the time-resolved DED maps reveal three distinct structural pathways: at early time delays, both Fe and Zr atoms undergo coherent oscillations as well as transient structural changes, while at later time delays, they become disordered, displaying a vibrationally hot configuration. Upon photoexcitation, a CO molecule dissociates from FeTCPP and organized anisotropic movements occur within the instrument response function (<200 fs). The organized anisotropic movements include coherent oscillation (Iosc) and the formation of a transient structure (Itr). In Iosc, the Fe and Zr atoms oscillate with a period of 5.55 ps. The Fe atom oscillates in a doming–undoming manner along the direction perpendicular to the plane formed by TCPP, while the Zr atoms oscillate along the d axis connecting two different occupation sites of a Zr atom due to positional disorder. In Itr, the doming of the porphyrin (blue arrow) and the disordering of the Zr atoms (magenta arrows) in the Zr6 node are enhanced. Iosc and Itr decay with time constants of 2.68 and 47.1 ps, respectively. The structure of the ground state (faint lines) is superimposed on the schematic images of Iosc and Itr for comparison. In addition to the organized anisotropic movements, the vibrationally hot structure (Ihot) with isotropic structural movement is formed with time constants of 1.143 and 11.32 ps. In Ihot, Zr, Fe and the CO ligand all exhibit broader electron distributions (orange shading) than in the ground state due to vibrational excitation. Zr, Fe and the CO ligand are shown in green, orange and grey, respectively. The TCPP ligand connecting the Zr and Fe sites is represented by a wavy line. The two disordered positions of a Zr atom in the ground state and each structural species are represented in cyan. hν represents the photon energy, where h is Planck’s constant and ν is the frequency of the photon. We have demonstrated here that chemical systems can be studied with TR-SFX, which previously has been used only for protein crystals but has the potential to be applied to a wide range of porous materials and chemical systems.
Structural analysis using extrapolated maps

Structural dynamics

Methods
Synthesis of PCN–224
Micro-sized crystals of PCN–224 were prepared for TR-SFX analysis following a reported procedure38 with a slight modification. All of the chemicals required for the preparation of the MOF crystals were purchased from commercial suppliers (Sigma Aldrich and TCI Korea) and used as received without further purification. For the synthesis of the micro-sized crystals, ZrCl4 (0.21 g, 0.90 mmol; Sigma Aldrich, 99.5%), TCPP (0.070 g, 0.088 mmol; TCI Korea, 97.0%), benzoic acid (3.66 g, 30 mmol; Sigma Aldrich, 99.5%) and acetic acid (3.4 ml, 60 mmol; Sigma Aldrich, 99.7%) were suspended in N,N-dimethylformamide (DMF; 14 ml) in air in a 30 ml vial with a Teflon-lined cap and heated at 130 °C for 3 days to give red-brown cubic crystals. The vial was cooled for 1 h and the mother liquor was decanted. The remaining crystals were washed with DMF (10 × 10 ml) for 2 days and then with dichloromethane (DCM; 10 × 10 ml) for a further 2 days. To remove any solvents absorbed inside the pores of the resulting PCN–224, the washed crystals were heated at 150 °C for 12 h under vacuum. The characterization of PCN–224 is described in detail in Supplementary Methods.
Synthesis of PCN–224(FeII) and PCN–224(FeII)–CO
FeCl2 (558.0 mg, 4.4 mmol; Sigma Aldrich, 98%) and 2,6-lutidine (102.5 μl, 0.880 mmol; Sigma Aldrich, 97%) were mixed in DMF (5 ml) in a 25 ml round-bottomed flask. PCN–224 (150 mg, 0.037 mmol) was then immersed in this solution and heated for 12 h at 150 °C. After the reaction, the supernatant was decanted and the remaining crystals were washed in DMF (3 × 10 ml) for 30 min at 150 °C and then decanted. Next, 10 ml DMF was added to the washed crystals in the flask, which was then sealed and sonicated for 30 min. These crystals were washed with DMF (10 × 10 ml) and DCM (10 × 10 ml) for 2 days each. The remaining crystals were then dried for 12 h at 150 °C under vacuum, yielding dark-purple crystals. Unless otherwise noted, these procedures were conducted under N2 atmosphere using a Schlenk line or under Ar atmosphere in a glove box. After the activation of PCN–224(FeII), PCN–224(FeII) was exposed to 1 atm CO for 4 h to generate PCN–224(FeII)–CO.
Sample preparation for TR-SFX
Freshly activated PCN–224(FeII) was transported as a dry solid encapsulated in Ar to the Pohang Accelerator Laboratory X-ray free-electron laser (PAL-XFEL). A fixed-target sample holder was especially designed to keep the sample exposed to CO during the experiment. A fixed-target sample holder has two major advantages over conventional injector-style crystal delivery systems. First, the amount of sample consumed in the experiment can be greatly reduced. Second, there are no problems of chemical compatibility of the sample crystals with the medium because the crystals are simply placed on a substrate, such as a thin film, rather than dispersed in a liquid or gel-type medium. Acrylic Kapton tape was placed on one side of the sample holder and activated PCN–224(FeII) crystals were spread over the Kapton tape under an Ar atmosphere. Then, 50 μm polypropylene film was attached to the other side of the holder using double-sided acrylic tape. Samples encapsulated in the holder were exposed to ~1 atm CO for 4 h to generate PCN–224(FeII)–CO. After the exposure, the holder was completely sealed and subjected to TR-SFX analysis.
TR-SFX data collection
The diffraction experiments were performed at the XSS beamline of PAL-XFEL. The PAL-XFEL delivered X-ray pulses with a photon energy of 14.5 keV at a repetition rate of 30 Hz. The X-ray beam was focused to a spot of ~11 μm diameter full-width at half-maximum (FWHM). Laser pulses with a wavelength of 800 nm were generated from a Ti:sapphire regenerative amplifier and then converted to 400 nm pulses with a duration of <100 fs. The laser beam was focused to a spot of 45 μm diameter FWHM with a laser fluence of 5 mJ mm−2. Large-diameter X-ray and laser beams were used to prevent damage to the film and tapes and to keep the sample sealed in the CO environment. The X-ray and laser beams were aligned to overlap at the sample position with a crossing angle of 10°. The samples were delivered in home-made fixed-target sample holders mounted on Kohzu XA05A-L202 stages and moved for raster scanning. Time-resolved diffraction data were collected at 33 time delays between X-ray and laser pulses: −3.9, −2.4, −0.6, −0.2, 0.1, 0.4, 0.6, 0.85, 1.1, 1.35, 1.6, 1.85, 2.1, 2.35, 2.6, 2.85, 3.1, 3.35, 3.6, 4.1, 5.1, 7.1, 10.1, 17.9, 31.7, 56.3, 100, 178, 316, 562, 1,000 and 3,000 ps. More than 15,000 diffraction images were collected at each time delay. The diffraction images were recorded with a Rayonix MX225-HS detector in 4 × 4 binning mode (pixel size: 156 μm × 156 μm).
Data processing and analysis
We used the Cheetah software39 to select images containing meaningful diffraction spots by filtering out empty images and find spot positions in the selected diffraction images. Around 10–25% of the images collected from the sample at each time delay were identified as containing Bragg spots (Supplementary Tables 1–5).
The hit images obtained were further indexed and integrated using CrystFEL40. For indexing, the XGANDALF algorithm provided by CrystFEL was used, and the data beyond 0.9 Å were neglected due to the large experimental noise in the high-resolution region. The parameters for the experimental geometry were optimized by a trial-and-error approach. Intensities were integrated using the ‘rings-sat-cen’ option in CrystFEL with concentric rings of three, five and six pixels for the peak, buffer and background regions, respectively. The 'rings-sat-cen' integration option (i) utilizes three concentric rings for delineating peak and background areas, (ii) centers peak boxes on actual peak locations iteratively and (iii) does not integrate reflections that contain saturated pixels. The integrated intensities were merged using the partialator program from CrystFEL. XPREP was used to initially determine the space group of the crystal and prepare an input file for solving the structure. X-ray absorption was found to be negligible for crystals in the size range of 10–20 µm, where Tmin, the minimum value for experimental X-ray absorption correction, is larger than 0.9. Consequently, no absorption correction was applied. EDs and the corresponding molecular structures were solved using SHELXT41. VESTA42 was used to visualize ED maps overlain on refined molecular structures.
The space group of PCN–224(Fe)–CO is the same as that of a previously reported crystal structure of PCN–224(Fe) obtained by single-crystal X-ray crystallography38. The structure at each time delay, solved using SHELXT, was refined by a full-matrix least-squares method on F2 using SHELXL43. All non-hydrogen atoms were refined anisotropically and hydrogen atoms were refined isotropically. The structures were refined by applying displacement parameter restraints using DELU and SIMU commands and by applying a distance restraint using DFIX command in SHELXL. The disorder around the Zr clusters in the structures was modelled at each time delay. We observed a substantial residual ED in the ED maps that cannot be accounted for by the refined structures. This residual density may be attributed to either solvent molecules remaining in the pores or the partial occupation of MOF-525, which has a similar composition to PCN–224, but possesses a distinct structure. We employed the SQUEEZE option in PLATON44 to model the residual ED as contributions from disordered solvents or gas within the voids. The results of the refinement are summarized in Supplementary Tables 1–5. The A/B alerts generated from running CheckCIF and explanations are summarized in Supplementary Table 6. As the ORTEP-style drawings of the asymmetric unit of PCN–224(Fe)–CO at all time delays are very similar, we have included only the illustration corresponding to the laser-off condition as an example (Supplementary Fig. 1).
The experimental structure factor amplitudes (|F|) at each time delay were scaled based on the calculated (absolute) amplitudes. Δ|F| values were then obtained by subtracting the reference structure factor amplitude from the structure factor amplitudes at each time delay, represented as Δ|F|(hkl, t) = |F(hkl, t)| − |F(hkl, reference)|. Here, hkl represents the Miller indices and t denotes the time delay. The reference structure factor amplitude was derived from the average of the structure factor amplitudes measured at the negative time delays (−3.9, −2.4, −0.6 and −0.2 ps). DED (Δρ) maps were generated by Fourier transformation of each set of difference structure factor amplitudes using the phases from the PCN–224(Fe)–CO model before reaction45,46,47. Extended Data Figs. 1 and 2 show the DED maps at all time delays contoured at ±5.0σ (0.58 e Å−3) and ±3.0σ (0.35 e Å−3), respectively. Instead of a whole DED map, two regional DED maps, which are expected to arise from large structural changes, were used for further analysis: one was around the Fe atom and its CO ligand in the porphyrin ring (Extended Data Fig. 3) and the other was around the Zr6 node (Extended Data Fig. 4). In the DED maps obtained at late time delays, the original metal positions have strong negative densities surrounded by strong positive densities. Such features indicate that the metal atoms have been displaced from their original positions to other positions in random orientations, which is a characteristic of vibrationally hot structures. To confirm this hypothesis, the DED maps corresponding to the vibrationally hot structure, Ihot, were simulated for comparison with the experimentally observed DED maps. For the simulation, we calculated the ED maps for PCN–224(Fe)–CO before and after thermal excitation. For the ED map before thermal excitation, we used the ED map of the refined structure of laser-off PCN–224(Fe)–CO, which was obtained with the excitation laser off. To generate the ED maps of Zr and Fe atoms after thermal excitation, we increased the atomic displacement parameter of each atom in the refined structure of laser-off PCN–224(Fe)–CO and calculated the corresponding ED maps. The DED maps were obtained by subtracting the ED map before thermal excitation from that after thermal excitation (Extended Data Fig. 5). The simulated DED maps obtained on the assumption that the atomic displacement parameters increase due to the heating of the MOF have similar features to the experimental DED maps at late time delays (Extended Data Fig. 5). Based on these results, DED maps at late time delays were assigned to the heating component (that is, the vibrationally hot structure). Heat-free DED maps were obtained by removing the feature corresponding to the heating component from the DED map at each time delay (Supplementary Fig. 2).
Kinetic analysis of TR-SFX data
Data were collected at 33 time delays, which provides a large enough dataset for a quantitative kinetic and structural analysis. To obtain quantitative kinetic information from time-resolved DED maps, we applied SVD to decompose the original data into time-invariant DED features (that are, LSVs), their relative contributions (singular values) and their time profiles (that is, RSVs). First, the DED maps around the Zr6 node and the Fe porphyrin site were separately decomposed by SVD analysis to emphasize the dynamics of each metal domain. The singular values, autocorrelation values, and major LSVs and RSVs are shown in Extended Data Fig. 6. Inspection of the singular values and vectors revealed that, in both regions, the first component (the first LSVs and RSVs) stands out. The first RSVs for the two regions have almost identical shapes (Extended Data Fig. 7a). In addition to this dominant component, additional major components (the second RSVs) can also be observed in both regions.
For the primary component of both the Zr6 node and FeCO site, the laser-off positions of Zr and Fe exhibit strong negative densities surrounded by an isotropic shell of positive densities. This feature represents a vibrationally hot structure that extends through both metallic sites. Accordingly, the first RSVs represent the kinetics of the vibrationally hot structure, that is, thermal kinetics. To confirm this, we also performed a modified analysis using the Wilson plot method48. The Wilson plot was used to estimate the difference between the scale factors and the overall B-factors between datasets. The structure factors rescaled from 0 to 0.25 Å−2 during the structure refinement using SHELXL were used to extract the difference between the B-factors (Extended Data Fig. 7b). Specifically, we extracted the difference between the B-factor at each time delay and that of the averaged structure factors at negative time delays and compared the temporal trend with the first RSVs (Extended Data Fig. 7a). The first RSVs and the difference B-factors showed excellent agreement, indicating that the first RSV represents thermal kinetics. As the first RSVs for the two regions have nearly identical shapes (Extended Data Fig. 7a), they represent the kinetics of thermal excitation of the entire PCN–224(Fe) structure following photoexcitation. In this regard, we conducted a quantitative analysis of the time-resolved temperature changes in PCN–224(Fe); details of the analysis are provided in Supplementary Discussion and the results are presented in Supplementary Fig. 10.
For the Zr6 node, the second LSV exhibits an anisotropic feature along the d axis connecting the two different occupation sites of a Zr atom arising from positional disorder. Along the d axis, a negative density appears between the two occupation sites of a Zr atom, and two positive densities emerge at the exterior of the two occupation sites. This indicates that the Zr atoms were further disordered along the d axis. The components ranked third and below have low autocorrelation and singular values, and hence their contributions to the time-resolved DED maps around the Zr6 node can be ignored. For the FeCO site, the second LSV also shows clear anisotropic features along the axis connecting Fe and the CO ligand. Here, a pair of strong positive and negative densities appear above and below the original position of the Fe atom, indicating that this LSV represents the directional movement of the Fe atom. In addition, a strong negative density is evident around the position of the CO ligand, indicating that it dissociates upon photoexcitation.
The characteristic features of the RSVs can be briefly inspected before quantitative analysis. The second RSV for the Zr6 node shows three distinct behaviours: instantaneous rise, oscillation and exponential decay. As shown in Extended Data Fig. 6, the second RSV shows an instantaneous rise at around time zero, indicating that the contribution of the second LSV rises immediately upon photoexcitation. After the rise at time zero, the second RSV shows substantial oscillatory features with a peak at around 1.25 ps and a dip at around 4.0 ps. This oscillatory behaviour does not persist to late time delays, but damps quickly. Finally, the second RSV decays slowly towards zero. The second RSV of the FeCO site exhibits characteristics similar to those observed for the second RSV of the Zr6 node, particularly the instantaneous rise and exponential decay behaviours. However, the oscillatory behaviour of the second RSV of the FeCO site is notably weaker than that observed for the Zr6 node. Nevertheless, on closer examination, it is evident that these oscillatory features still make a discernible contribution. We performed a kinetic analysis for the two meaningful RSVs, the second RSVs of the Zr6 node and the FeCO site, to extract the detailed kinetics of the photoinduced anisotropic structural changes. For a quantitative analysis, the two second RSVs were globally fitted as a convolution of the IRF of ~200 fs FWHM with the sum of an exponential rise function (with a time constant of 20 fs, representing an instantaneous rise within the IRF of the experiment), an exponential decay function and a damped cosine function sharing time constants. The results of the fit are shown in Extended Data Fig. 8. A satisfactory fit was obtained with a time constant of 47.1 ± 0.5 ps for the exponential decay and two time constants of 5.55 ± 0.01 and 2.68 ± 0.02 ps for the period and dam**, respectively, of the oscillatory motion.
Using the obtained time constants, we constructed a kinetic model that matches the behaviour of the major RSVs. The kinetic model consists of three species: (1) a species corresponding to the vibrationally hot structure (Ihot), (2) a species corresponding to the transient structure (Itr) that forms instantaneously within the IRF of the experiment upon photoexcitation and decays with a time constant of 47.1 ps, and (3) a species corresponding to the oscillatory motion (Iosc) with a period of 5.55 ps and a dam** constant of 2.68 ps. The DED maps corresponding to these three species (that is, the SADED maps) were extracted via a kinetic analysis using the kinetic model. In this procedure, the entire DED maps of PCN–224(Fe)–CO were used instead of maps of just the regions around the Zr6 node and FeCO site. The kinetic analysis performed using the kinetic model is described in detail in Supplementary Methods. The resulting SADED maps for Iosc, Itr and Ihot and their time profiles are shown in Fig. 3a,b.
Generation of extrapolated maps
Detailed structural parameters for the structural species were obtained by structure refinement. The structure refinement was performed on diffraction intensities represented by the square of the structure factors of each structural species. The structure factors of the structural species, the so called extrapolated structure factors (Fextr(hkl))49, were obtained as follows: first, species-associated difference structure factors (Δ|F|SA(hkl)) for each structural species were obtained through inverse Fourier transformation of the corresponding SADEDs, derived from the kinetic analysis. The structure factors of the laser-off structure were used as the structure factors for ground state (FGround(hkl)). Then, the amplitudes of Fextr(hkl), |F|extr(hkl), were computed as follows:
where |F|Ground(hkl) is the amplitude of FGround(hkl), p is the photoconversion yield ranging from 0 to 1 and Δ|F|SA(hkl) is the amplitude of ΔFSA(hkl). By determining the optimal value of p, |F|extr(hkl), free of the contribution of the ground state can be obtained. Suitable indicators for evaluating the level of photoconversion include the absence of negative density on the Zr atoms. As is evident from the term containing the division of ΔFSA(hkl) by p on the right-hand side of equation (1), it should be noted that when p is equal to unity (that is, when all of the ground state has been converted into the structural species), |F|extr(hkl) is simply the sum of the amplitudes of |F|Ground(hkl) and Δ|F|SA(hkl). When p is not equal to unity, the difference, Δ|F|SA(hkl), is weighted and added to |F|Ground(hkl) to obtain |F|extr(hkl). This process is referred to as extrapolation because typically, for p values less than 1, the small difference structure factors are extrapolated (or amplified to correspond to p = 1) and added to the structure factor of the ground state to determine the structure factors of the newly formed species. The p factors were determined to be 1.0 for Ihot, 0.20 for Itr and 0.25 for Iosc. Next, we calculated |F|extr(hkl) using the obtained |F|extr and the phase of the laser-off structure. The resulting |F|extr(hkl) values were squared to generate the diffraction intensities of the structural species. The diffraction intensities were refined in a similar manner to that used for the refinement of the laser-off structure, with additional restraints on the distances and planarity of the phenyl and pyrrole groups in the TCPP ligand. The A/B alerts associated with the structural species and the corresponding explanations are summarized in Supplementary Table 7.
The R factors for the extrapolated maps of the three structural species are comparable to, or even smaller than, those of the static crystal structures shown in Supplementary Tables 1–5. These small R factors for the structural species can be attributed to the use of a large number of DED maps for the calculation of the SADED maps. A SADED map can be described as a linear combination, or weighted average, of the DED maps, as detailed in Supplementary Methods. Due to this averaging process, in which the noise from each DED map is offset against one another, the noise in the SADED maps is reduced compared with that in individual DED maps. Consequently, SADED maps with reduced noise result in high-quality |F|extr, eventually leading to reduced R factors for the extrapolated maps. For instance, we can compare the quality of Δ|F|SA for Ihot and Δ|F| at 1 ns. At time delays much longer than the decay time constant of Itr (47.1 ps), only Ihot contributes to ΔF. Because p is equal to unity, it can be inferred that Δ|F| values at late time delays are approximately equivalent to Δ|F|SA for Ihot. In simple terms, the information from Δ|F| at multiple late time delays is averaged to extract Δ|F|SA for Ihot. Consequently, the quality of Δ|F|SA is inherently improved compared with Δ|F| for a single time delay, such as 1 ns. As Δ|F|SA of Ihot would be of higher quality than that of ΔF at 1 ns, it is reasonable to obtain a smaller R factor for the extrapolated map of Ihot (7.33%) than for the crystal structure at 1 ns (10.9%).
Data availability
Source data are provided with this paper. Volumetric data could not be uploaded with the source data due to the large file size and are available from the corresponding author upon request. The crystallographic data for the structures reported here have been deposited at the Cambridge Crystallographic Data Centre (CCDC) under deposition numbers CCDC 2308176 (laser off), 2308180 (time delay −3.9 ps), 2308179 (time delay −2.4 ps), 2308178 (time delay −0.6 ps), 2308184 (time delay −0.2 ps), 2308177 (time delay 0 ps), 2308185 (time delay 0.1 ps), 2308183 (time delay 0.4 ps), 2308181 (time delay 0.6 ps), 2308182 (time delay 0.85 ps), 2308207 (time delay 1.1 ps), 2308208 (time delay 1.35 ps), 2308210 (time delay 1.6 ps), 2308209 (time delay 1.85 ps), 2308205 (time delay 2.1 ps), 2308202 (time delay 2.35 ps), 2308203 (time delay 2.6 ps), 2308201 (time delay 2.85 ps), 2308204 (time delay 3.1 ps), 2308206 (time delay 3.35 ps), 2308220 (time delay 3.6 ps), 2308218 (time delay 4.1 ps), 2308222 (time delay 5.1 ps), 2308221 (time delay 7.1 ps), 2308217 (time delay 10.1 ps), 2308215 (time delay 17.9 ps), 2308214 (time delay 31.7 ps), 2308213 (time delay 56.3 ps), 2308216 (time delay 100.1 ps), 2308219 (time delay 178.1 ps), 2308057 (time delay 316.1 ps), 2308056 (time delay 562.1 ps), 2308055 (time delay 1 ns), 2308058 (time delay 3 ns), 2308737 (Ihot), 2308738 (Itr) and 2308736 (Iosc). Copies of the data can be obtained free of charge via https://www.ccdc.cam.ac.uk/structures/.
Code availability
The code used for the analysis of the different ED maps can be obtained from the corresponding author upon reasonable request.
References
Li, H., Eddaoudi, M., Groy, T. L. & Yaghi, O. M. Establishing microporosity in open metal–organic frameworks: gas sorption isotherms for Zn(BDC) (BDC = 1,4-benzenedicarboxylate). J. Am. Chem. Soc. 120, 8571–8572 (1998).
Côté, A. P. et al. Porous, crystalline, covalent organic frameworks. Science 310, 1166–1170 (2005).
Li, J.-R., Sculley, J. & Zhou, H.-C. Metal–organic frameworks for separations. Chem. Rev. 112, 869–932 (2012).
Furukawa, H., Cordova, K. E., O’Keeffe, M. & Yaghi, O. M. The chemistry and applications of metal–organic frameworks. Science 341, 1230444 (2013).
**ao, J.-D. & Jiang, H.-L. Metal–organic frameworks for photocatalysis and photothermal catalysis. Acc. Chem. Res. 52, 356–366 (2019).
Rice, A. M. et al. Photophysics modulation in photoswitchable metal–organic frameworks. Chem. Rev. 120, 8790–8813 (2020).
Ma, N. & Horike, S. Metal–organic network-forming glasses. Chem. Rev. 122, 4163–4203 (2022).
Das, A. et al. In crystallo snapshots of Rh2-catalyzed C–H amination. J. Am. Chem. Soc. 142, 19862–19867 (2020).
Sun, J. et al. A platinum(II) metallonitrene with a triplet ground state. Nat. Chem. 12, 1054–1059 (2020).
Jean-Ruel, H. et al. Ring-closing reaction in diarylethene captured by femtosecond electron crystallography. J. Phys. Chem. B 117, 15894–15902 (2013).
Sie, E. J. et al. An ultrafast symmetry switch in a Weyl semimetal. Nature 565, 61–66 (2019).
Zalden, P. et al. Femtosecond X-ray diffraction reveals a liquid–liquid phase transition in phase-change materials. Science 364, 1062–1067 (2019).
Vorontsov, I. I. et al. Capturing and analyzing the excited-state structure of a Cu(I) phenanthroline complex by time-resolved diffraction and theoretical calculations. J. Am. Chem. Soc. 131, 6566–6573 (2009).
Spence, J. C. H. & Doak, R. B. Single molecule diffraction. Phys. Rev. Lett. 92, 198102 (2004).
Chapman, H. N. et al. Femtosecond X-ray protein nanocrystallography. Nature 470, 73–77 (2011).
Barends, T. R. M. et al. Direct observation of ultrafast collective motions in CO myoglobin upon ligand dissociation. Science 350, 445–450 (2015).
Dods, R. et al. Ultrafast structural changes within a photosynthetic reaction centre. Nature 589, 310–314 (2021).
Kern, J. et al. Simultaneous femtosecond X-ray spectroscopy and diffraction of photosystem II at room temperature. Science 340, 491–495 (2013).
Kupitz, C. et al. Serial time-resolved crystallography of photosystem II using a femtosecond X-ray laser. Nature 513, 261–265 (2014).
Nango, E. et al. A three-dimensional movie of structural changes in bacteriorhodopsin. Science 354, 1552–1557 (2016).
Pande, K. et al. Femtosecond structural dynamics drives the trans/cis isomerization in photoactive yellow protein. Science 352, 725–729 (2016).
Suga, M. et al. Light-induced structural changes and the site of O=O bond formation in PSII caught by XFEL. Nature 543, 131–135 (2017).
Weinert, T. et al. Proton uptake mechanism in bacteriorhodopsin captured by serial synchrotron crystallography. Science 365, 61–65 (2019).
Schriber, E. A. et al. Chemical crystallography by serial femtosecond X-ray diffraction. Nature 601, 360–365 (2022).
Cerasale, D. J., Ward, D. C. & Easun, T. L. MOFs in the time domain. Nat. Rev. Chem. 6, 9–30 (2022).
Pattengale, B., Ostresh, S., Schmuttenmaer, C. A. & Neu, J. Interrogating light-initiated dynamics in metal–organic frameworks with time-resolved spectroscopy. Chem. Rev. 122, 132–166 (2022).
Feng, D. et al. Construction of ultrastable porphyrin Zr metal–organic frameworks through linker elimination. J. Am. Chem. Soc. 135, 17105–17110 (2013).
Lee, D. et al. Nylon mesh-based sample holder for fixed-target serial femtosecond crystallography. Sci. Rep. 9, 6971 (2019).
Broecker, J. et al. High-throughput in situ X-ray screening of and data collection from protein crystals at room temperature and under cryogenic conditions. Nat. Protoc. 13, 260–292 (2018).
Koschnick, C. et al. Understanding disorder and linker deficiency in porphyrinic zirconium-based metal–organic frameworks by resolving the Zr8O6 cluster conundrum in PCN-221. Nat. Commun. 12, 3099 (2021).
Jung, Y. O. et al. Volume-conserving trans–cis isomerization pathways in photoactive yellow protein visualized by picosecond X-ray crystallography. Nat. Chem. 5, 212–220 (2013).
Schmidt, M., Rajagopal, S., Ren, Z. & Moffat, K. Application of singular value decomposition to the analysis of time-resolved macromolecular X-ray data. Biophys. J. 84, 2112–2129 (2003).
Li, J., Noll, B. C., Schulz, C. E. & Scheidt, W. R. Comparison of cyanide and carbon monoxide as ligands in iron(II) porphyrinates. Angew. Chem. Int. Ed. 48, 5010–5013 (2009).
Scheidt, W. R. & Turowska-Tyrk, I. Crystal and molecular structure of (octaethylporphinato)cobalt(II). Comparison of the structures of four-coordinate M(TPP) and M(OEP) derivatives (M = Fe–Cu). Use of area detector data. Inorg. Chem. 33, 1314–1318 (1994).
Kamencek, T., Bedoya-Martínez, N. & Zojer, E. Understanding phonon properties in isoreticular metal–organic frameworks from first principles. Phys. Rev. Mater. 3, 116003 (2019).
Kuchta, B., Formalik, F., Rogacka, J., Neimark, A. V. & Firlej, L. Phonons in deformable microporous crystalline solids. Z. Kristallogr. Cryst. Mater. 234, 513–527 (2019).
Rimmer, L. H. N., Dove, M. T., Goodwin, A. L. & Palmer, D. C. Acoustic phonons and negative thermal expansion in MOF-5. Phys. Chem. Chem. Phys. 16, 21144–21152 (2014).
Anderson, J. S., Gallagher, A. T., Mason, J. A. & Harris, T. D. A five-coordinate heme dioxygen adduct isolated within a metal–organic framework. J. Am. Chem. Soc. 136, 16489–16492 (2014).
Barty, A. et al. Cheetah: software for high-throughput reduction and analysis of serial femtosecond X-ray diffraction data. J. Appl. Crystallogr. 47, 1118–1131 (2014).
White, T. A. et al. CrystFEL: a software suite for snapshot serial crystallography. J. Appl. Crystallogr. 45, 335–341 (2012).
Sheldrick, G. SHELXT—integrated space-group and crystal-structure determination. Acta Crystallogr. A 71, 3–8 (2015).
Momma, K. & Izumi, F. VESTA: a three-dimensional visualization system for electronic and structural analysis. J. Appl. Crystallogr. 41, 653–658 (2008).
Sheldrick, G. M. Crystal structure refinement with SHELXL. Acta Crystallogr. C Struct. Chem. 71, 3–8 (2015).
Spek, A. L. PLATON SQUEEZE: a tool for the calculation of the disordered solvent contribution to the calculated structure factors. Acta Crystallogr. C Struct. Chem. 71, 9–18 (2015).
Fournier, B. & Coppens, P. On the assessment of time-resolved diffraction results. Acta Crystallogr. A 70, 291–299 (2014).
Vorontsov, I., Pillet, S., Kaminski, R., Schmokel, M. S. & Coppens, P. LASER—a program for response-ratio refinement of time-resolved diffraction data. J. Appl. Crystallogr. 43, 1129–1130 (2010).
Wickstrand, C. et al. A tool for visualizing protein motions in time-resolved crystallography. Struct. Dyn. 7, 024701 (2020).
Schmokel, M. S., Kaminski, R., Benedict, J. B. & Coppens, P. Data scaling and temperature calibration in time-resolved photocrystallographic experiments. Acta Crystallogr. A 66, 632–636 (2010).
Schmidt, M. et al. Protein kinetics: structures of intermediates and reaction mechanism from time-resolved X-ray data. Proc. Natl Acad. Sci. USA 101, 4799–4804 (2004).
Acknowledgements
We thank K. H. Nam, S. Park and H. Hyun for their help in designing the experiment and data collection. We thank S. J. Lee, T. White and D. Kim for their advice in data processing and analysis. We thank J. Choi, D. W. Cho, C. W. Ahn, S. Choi and S.-Y. Park for their help in the experiments. The experiments were performed at the XSS and NCI beamlines of PAL-XFEL (proposal nos. 2022-1st-XSS-007, 2022-1st-XSS-015, 2020-1st-XSS-010 and 2020-2nd-XSS-001 for the main experiment at the XSS beamline, and 2019-1st-NCI-009, 2019-1st-NCI-007, 2018-2nd-NCI-019 and 2018-2nd-NCI-017 for the preliminary experiment at the NCI beamline) funded by the Ministry of Science and the ICT of Korea. We thank Global Science experimental Data hub Center (GSDC) at Korea Institute of Science and Technology Information (KISTI) for computing resources and technical support. This work was supported by the Institute for Basic Science (IBS-R033).
Author information
Authors and Affiliations
Contributions
H.I. conceived the idea and directed the project. H.K. and H.I. conceptualized and designed the experiments. J. Kang prepared and characterized PCN–224(Fe)–CO. J. Kang, Y.L., S.L., H.K., Jungmin Kim, J.G., Y.C., J.H., K.W.L., S.O.K., Jeongho Kim and H.I. conducted the TR-SFX experiment. J.H.L., R.M., J.P., I.E., M.K., S.K. and S.-Y.P. supported the TR-SFX experiments. J. Kang, Y.L., S.L. and H.K. analysed the data. J. Kang, Y.L., S.L., H.K., Jeongho Kim and H.I. wrote the paper.
Corresponding author
Ethics declarations
Competing interests
The authors declare no competing interests.
Peer review
Peer review information
Nature Chemistry thanks Paul Raithby and the other, anonymous, reviewer(s) for their contribution to the peer review of this work.
Additional information
Publisher’s note Springer Nature remains neutral with regard to jurisdictional claims in published maps and institutional affiliations.
Extended data
Extended Data Fig. 1 Time-resolved DED maps of PCN–224(Fe) at all time delays (high contour levels).
DED maps including both the Fe-porphyrin and Zr6 node regions are shown. The red and blue colors denote the negative and positive electron densities, contoured at ±5.0σ (0.58 e Å−3), respectively. Here, the definition of the σ value is the same as the definition of the σ value in Fig. 2.
Extended Data Fig. 2 Time-resolved DED maps of PCN–224(Fe) at all time delays (low contour levels).
DED maps including both the Fe-porphyrin and Zr6 node regions are shown. The red and blue colors denote the negative and positive electron densities, contoured at ±3.0σ (0.35 e Å−3), respectively. Here, the definition of the σ value is the same as the definition of the σ value in Fig. 2.
Extended Data Fig. 3 Time-resolved DED maps of PCN–224(Fe) at all time delays (magnified views for FeCO site).
DED maps including Fe atom and the CO ligand in the Fe-porphyrin regions are shown. The red and blue colors denote the negative and positive electron densities, contoured at ±3.0σ (0.35 e Å−3), respectively. Here, the definition of the σ value is the same as the definition of the σ value in Fig. 2.
Extended Data Fig. 4 Time-resolved DED maps of PCN–224(Fe) at all time delays (magnified views for Zr6 node).
DED maps including one Zr atom in Zr6 node regions are shown. The red and blue colors denote the negative and positive electron densities, contoured at ±5.0σ (0.58 e Å−3), respectively. Here, the definition of the σ value is the same as the definition of the σ value in Fig. 2.
Extended Data Fig. 5 Simulated DED maps around Zr and Fe atoms for the vibrationally hot structure.
The simulated DED maps around Zr atom (left) and Fe atom (right) obtained by subtracting the electron density map before the thermal excitation from that after the thermal excitation are shown. The red and blue colors denote the negative and positive electron densities, contoured at ±2σ (0.14 e Å−3 for Zr atom and 0.16 e Å−3 for Fe atom), respectively. The σ values for the maps around Zr and Fe represent the root-mean-square (rms) values of the simulated DED maps around Zr and Fe, respectively.
Extended Data Fig. 6 Results of singular value decomposition (SVD) and kinetic analyses on the DED maps of the Zr6 node and FeCO site.
a–c, First five (a) LSVs, (b) RSVs, and (c) singular values obtained from the SVD analysis on the DED maps of the Zr6 node. In c, the autocorrelation values of the LSVs and RSVs are shown as well. d–f, The counterparts of a–c obtained from the SVD analysis on the DED maps of the FeCO site. In a, the red and blue colors denote the negative and positive electron densities, respectively. The 1st LSV is contoured at ±0.8σ (0.0043 e Å−3) and the 2nd to 5th LSVs are at ±1.0σ (0.0053, 0.0023, 0.0052 and 0.0053 e Å−3, respectively). In d, those colors indicate the negative and positive electron densities, respectively. the 1st LSV is contoured at ±1.0σ (0.0061 e Å−3) and the 2nd to 5th LSVs are countered at ±2.0σ (0.0104, 0.0122, 0.0122 and 0.112 e Å−3, respectively). σ of each LSV was calculated as the standard deviation of the difference electron density of the LSV. Each σ represents the rms value for each LSV.
Extended Data Fig. 7 Comparison of the first right singular vectors (RSVs) obtained from the SVD analysis on the DED maps of the Zr6 node and FeCO site and time-resolved Wilson B-factors.
a, Comparison of the two 1st RSVs of the DED maps of the Zr6 node (black) and FeCO site (red). Time-resolved Wilson B-factors (blue) are also shown. The two 1st RSVs of two metal sites coincide with each other. They are in accordance with the time trace of the Wilson B-factor, implying that thermal motions play a dominant role in this primary kinetic component. b, Here, Ioff and Ion represent the diffraction intensities before and after photoexcitation, respectively. θ denotes half of the diffraction angle, and λ indicates the wavelength of the X-ray. The Wilson plots for 0 ps (black) and 10 ps (red) data. The data in the region from 0 to 0.25 Å−2 marked with gray were used to obtain ΔB.
Extended Data Fig. 8 Kinetic analysis results of the second RSVs obtained from the SVD analysis on the DED maps of the Zr6 node and FeCO site.
The 2nd RSV of the DED maps and the fits for (a) the Zr6 node and (b) the FeCO site. Two RSVs were globally fitted. Those RSVs (black) were fitted using an exponential decay with a time constant of 47.1 ps and a damped cosine with a period of 5.55 ps and a dam** time constant of 2.68 ps. The fits and residuals are shown in red and blue, respectively. The error bars are magnified by a factor of 50 to increase visibility.
Supplementary information
Supplementary Information
Supplementary Methods, Discussion, Figs. 1–10 and Tables 1–8.
Supplementary Data 1
Crystallographic structure factors for PCN–224(Fe)–CO at laser off; CCDC reference number 2308176.
Supplementary Data 2
Crystallographic structure factors for PCN–224(Fe)–CO at −3.9 ps; CCDC reference number 2308180.
Supplementary Data 3
Crystallographic structure factors for PCN–224(Fe)–CO at −2.4 ps; CCDC reference number 2308179.
Supplementary Data 4
Crystallographic structure factors for PCN–224(Fe)–CO at −0.6 ps; CCDC reference number 2308178.
Supplementary Data 5
Crystallographic structure factors for PCN–224(Fe)–CO at −0.2 ps; CCDC reference number 2308184.
Supplementary Data 6
Crystallographic structure factors for PCN–224(Fe)–CO at 0 ps; CCDC reference number 2308177.
Supplementary Data 7
Crystallographic structure factors for PCN–224(Fe)–CO at 0.1 ps; CCDC reference number 2308185.
Supplementary Data 8
Crystallographic structure factors for PCN–224(Fe)–CO at 0.4 ps; CCDC reference number 2308183.
Supplementary Data 9
Crystallographic structure factors for PCN–224(Fe)–CO at 0.6 ps; CCDC reference number 2308181.
Supplementary Data 10
Crystallographic structure factors for PCN–224(Fe)–CO at 0.85 ps; CCDC reference number 2308182.
Supplementary Data 11
Crystallographic structure factors for PCN–224(Fe)–CO at 1.1 ps; CCDC reference number 2308207.
Supplementary Data 12
Crystallographic structure factors for PCN–224(Fe)–CO at 1.35 ps; CCDC reference number 2308208.
Supplementary Data 13
Crystallographic structure factors for PCN–224(Fe)–CO at 1.6 ps; CCDC reference number 2308210.
Supplementary Data 14
Crystallographic structure factors for PCN–224(Fe)–CO at 1.85 ps; CCDC reference number 2308209.
Supplementary Data 15
Crystallographic structure factors for PCN–224(Fe)–CO at 2.1 ps; CCDC reference number 2308205.
Supplementary Data 16
Crystallographic structure factors for PCN–224(Fe)–CO at 2.35 ps; CCDC reference number 2308202.
Supplementary Data 17
Crystallographic structure factors for PCN–224(Fe)–CO at 2.6 ps; CCDC reference number 2308203.
Supplementary Data 18
Crystallographic structure factors for PCN–224(Fe)–CO at 2.85 ps; CCDC reference number 2308201.
Supplementary Data 19
Crystallographic structure factors for PCN–224(Fe)–CO at 3.1 ps; CCDC reference number 2308204.
Supplementary Data 20
Crystallographic structure factors for PCN–224(Fe)–CO at 3.35 ps; CCDC reference number 2308206.
Supplementary Data 21
Crystallographic structure factors for PCN–224(Fe)–CO at 3.6 ps; CCDC reference number 2308220.
Supplementary Data 22
Crystallographic structure factors for PCN–224(Fe)–CO at 4.1 ps; CCDC reference number 2308218.
Supplementary Data 23
Crystallographic structure factors for PCN–224(Fe)–CO at 5.1 ps; CCDC reference number 2308222.
Supplementary Data 24
Crystallographic structure factors for PCN–224(Fe)–CO at 7.1 ps; CCDC reference number 2308221.
Supplementary Data 25
Crystallographic structure factors for PCN–224(Fe)–CO at 10.1 ps; CCDC reference number 2308217.
Supplementary Data 26
Crystallographic structure factors for PCN–224(Fe)–CO at 17.9 ps; CCDC reference number 2308215.
Supplementary Data 27
Crystallographic structure factors for PCN–224(Fe)–CO at 31.7 ps; CCDC reference number 2308214.
Supplementary Data 28
Crystallographic structure factors for PCN–224(Fe)–CO at 56.3 ps; CCDC reference number 2308213.
Supplementary Data 29
Crystallographic structure factors for PCN–224(Fe)–CO at 100 ps; CCDC reference number 2308216.
Supplementary Data 30
Crystallographic structure factors for PCN–224(Fe)–CO at 178 ps; CCDC reference number 2308219.
Supplementary Data 31
Crystallographic structure factors for PCN–224(Fe)–CO at 316 ps; CCDC reference number 2308057.
Supplementary Data 32
Crystallographic structure factors for PCN–224(Fe)–CO at 562 ps; CCDC reference number 2308056.
Supplementary Data 33
Crystallographic structure factors for PCN–224(Fe)–CO at 1 ns; CCDC reference number 2308055.
Supplementary Data 34
Crystallographic structure factors for PCN–224(Fe)–CO at 3 ns; CCDC reference number 2308058.
Supplementary Data 35
Crystallographic structure factors for the transient species; CCDC reference number 2308738.
Supplementary Data 36
Crystallographic structure factors for the oscillating species; CCDC reference number 2308736.
Supplementary Data 37
Crystallographic structure factors for the vibrationally hot species; CCDC reference number 2308737.
Source data
Source Data Fig. 3
Statistical source data—Excel formats.
Source Data Extended Data Fig. 6
Statistical source data—Excel formats.
Source Data Extended Data Fig. 8
Statistical source data—Excel formats
Rights and permissions
Open Access This article is licensed under a Creative Commons Attribution 4.0 International License, which permits use, sharing, adaptation, distribution and reproduction in any medium or format, as long as you give appropriate credit to the original author(s) and the source, provide a link to the Creative Commons licence, and indicate if changes were made. The images or other third party material in this article are included in the article’s Creative Commons licence, unless indicated otherwise in a credit line to the material. If material is not included in the article’s Creative Commons licence and your intended use is not permitted by statutory regulation or exceeds the permitted use, you will need to obtain permission directly from the copyright holder. To view a copy of this licence, visit http://creativecommons.org/licenses/by/4.0/.
About this article

Cite this article
Kang, J., Lee, Y., Lee, S. et al. Dynamic three-dimensional structures of a metal–organic framework captured with femtosecond serial crystallography. Nat. Chem. 16, 693–699 (2024). https://doi.org/10.1038/s41557-024-01460-w
Received:
Accepted:
Published:
Issue Date:
DOI: https://doi.org/10.1038/s41557-024-01460-w
- Springer Nature Limited