
Abstract
This research work models two methods together to provide maximum information about a study area. The quantification of image texture is performed using the “grey level co-occurrence matrix (\(\mathrm{GLCM}\))” technique. Image classification-based “object-based change detection (\(\mathrm{OBCD}\))” methods are used to visually represent the developed transformation in the study area. Pre-COVID and post-COVID (during lockdown) panchromatic images of Connaught Place, New Delhi, are investigated in this research work to develop a model for the study area. Texture classification of the study area is performed based on visual texture features for eight distances and four orientations. Six different image classification methodologies are used for map** the study area. These methodologies are “Parallelepiped classification (\(\mathrm{PC}\)),” “Minimum distance classification (\(\mathrm{MDC}\)),” “Maximum likelihood classification (\(\mathrm{MLC}\)),” “Spectral angle mapper (\(\mathrm{SAM}\)),” “Spectral information divergence (\(\mathrm{SID}\))” and “Support vector machine (\(\mathrm{SVM}\)).” \(\mathrm{GLCM}\) calculations have provided a pattern in texture features contrast, correlation, \(\mathrm{ASM}\), and \(\mathrm{IDM}\). Maximum classification accuracy of \(83.68\%\) and \(73.65\%\) are obtained for pre-COVID and post-COVID image data through \(\mathrm{MLC}\) classification technique. Finally, a model is presented to analyze before and after COVID images to get complete information about the study area numerically and visually.
Introduction
Estimating changes developed in land use/land cover is a hot research area these days. Researchers investigate changes in the land pattern through satellite data, microsatellite data, drone data, unmanned aerial vehicles (\(\mathrm{UAVs}\)) data, terrain analysis, etc. (Chen et al. 2018). Several space agencies have conducted a series of successful space exploration missions like the super excited Apollo mission (Papanastassiou and Wasserburg 1971), Hubble mission (Baker et al. 2020), Voyager mission (Cohen and Rymer 2020), Cassini-Huygens mission (Sotin et al. 2021), Chandra mission (Tomsick et al. 2021) of the National Aeronautics and Space Administration (\(\mathrm{NASA}\)). Aryabhata (Damle et al. 1976), Chandrayaan 2 carried by GSLV Mark 3 (Chandrashekar 2016), Mangalyaan (Haider and Pandya 2015), launching 104 satellites in a single attempt (Muraleedharan et al. 2019), etc., are prominent successful space missions conducted by the Indian Space Research Organization (\(\mathrm{ISRO}\)). These space missions provide information about the capability of the individual space agency in space exploration. Due to these missions, space agencies generate extensive data to analyze specific situations or save records for future analysis (Mathieu et al. 2017). The data used in this research work is a perfect example of this scenario as the pre-COVID image of the study area was snapped for a general-purpose. Still, the post-COVID image was snapped to study the consequence of lockdown. Thus, the combination of pre-COVID data and post-COVID data becomes a great scenario to explore by remote sensing professionals, scientists, and researchers.
Nowadays, small aircraft-like devices popularly known as “drones” and \(\mathrm{UAVs}\) are also used for data collections and day-to-day purposes (Otto et al. 2018). These devices are operated by the human expect or some onboard computer device (Jiang et al. 2020). They are also used for several applications related to medical diagnostic, defense, transportation, film making, scientific research, firefighting, emergency services, etc. (Kerle et al. 2020). \(\mathrm{UAVs}\) are now introduced in satellite map** of the land-sides affected by the landslides (Niethammer et al. 2012), crop damage assessment caused due to the natural phenomenon (Maimaitijiang et al. 2020), map** disputed territory (defense application) (Li et al. 2020), \(3\mathrm{D}\) model development of terrain, etc. Today, the world is infected with the novel coronavirus (Nascimento et al. 2020) (Wang et al. 2020a, b, c). In this situation, \(\mathrm{UAV}\) has found some new application areas like spraying the disinfectant, scanning body temperature, broadcasting the message at extremely dangerous COVID hotspots, cargo delivery, \(\mathrm{QR}\) codes, connectivity, map**, etc. (d’Italie 2020). Thus besides satellites, \(\mathrm{UAVs}\), drones, high-resolution optical cameras, etc. are some of the primary sources through which high quality imagery can be obtained. Figure 1 represents the pictorial representation of the application areas of the drones. It can be observed that in the coming future, many earth exploration activities will be performed with the assistance of drones.

Application areas of drones (d’Italie 2020)
In satellite, remote sensing change detection methodologies are broadly classified into two categories (Woodcock et al. 2020), i.e., “pixel-based change detection (\(\mathrm{PBCD}\))” and “object-based change detection (\(\mathrm{OBCD}\))” (Hussain et al. 2013). Pre-classification \(\mathrm{PBCD}\) technique provide information about the study area in binary (change/no change) format. Another popular technique for image classification is \(\mathrm{OBCD}\) through which information of study area is obtained by analysing the difference developed in the classification classes. Through \(\mathrm{OBCD}\) techniques when pre- and post-image of an event is classified, the comparison among them is performed by analyzing the same category for both images. \(\mathrm{PBCD}\) and \(\mathrm{OBCD}\) methodologies are further categorized in several techniques presented in Table 1.
Some notable work done in satellite remote sensing by fusion of two algorithms, techniques, and classification schemes are presented in these reviews. Garg and Dhiman (2021) proposed a fusion of “grey level co-occurrence matrix (\(\mathrm{GLCM}\))” features and “local binary pattern (\(\mathrm{LBP}\))” to develop a novel “content based image retrieval (\(\mathrm{CBIR}\))” system. They have used three different classification approaches in their experiment, i.e., support vector machine (\(\mathrm{SVM}\)), decision tree (\(\mathrm{DT}\)) algorithm and K-nearest neighbourhood. They have concluded that their proposed algorithm performs better with superior recall, precision, and accuracy. Iqbal et al. (2021) used \(\mathrm{GLCM}\) features fused with “machine learning (\(\mathrm{ML}\))” approach to obtain similarity in different crop fields. The investigation is performed on the \(\mathrm{UAV}\) based low altitude high resolution data. They have obtained prenominal results with this merger of these two techniques. Thus the overall accuracy of their developed system is increased by \(13.65\%.\) Caballero et al. (2020) obtained \(\mathrm{C}\) band \(\mathrm{SAR}\) imagery to differentiate between onion and sunflower crop. In their classification technique, they have used the combination of \(\mathrm{GLCM}\) along with \(\mathrm{SVM}\) approach. Through their developed methodology they have obtained “overall accuracy (\(\mathrm{OA}\))” and “Kappa coefficient (Kp)” of \(95.35\%\) and \(0.89\) respectively while differentiating onion crop with sunflower crop. Singh and Singh (2020) used SCATSAT-1 data to distinguish “multi-year ice” and “first-year ice” of the arctic region using “maximum likelihood classification (\(\mathrm{MLC}\))”. They have obtained over all classification accuracy of \(92\%\) in their experiment. Rimal et al. (2020) used the Landsat imagery of the Kathmandu valley of Nepal between 1988 and 2016 to compare the efficiency of object-based image classification “\(\mathrm{SVM}\)” and “\(\mathrm{ML}\)” image classification algorithm. The experimental result obtained from their investigation suggest that \(\mathrm{SVM}\) performs better than \(\mathrm{ML}\) classification algorithm. Thus scientist and researchers are working to develop a new methodology by combining two or more techniques to obtain maximum accuracy and complete information from image classification and feature quantification.
In this research work, a model is presented employing a combination of \(\mathrm{PBCD}\) (texture analysis based \(\mathrm{GLCM}\)) and \(\mathrm{OBCD}\) (Classified object change detection \(\mathrm{COCD}\)) techniques by analyzing the pre-COVID and post-COVID (during lockdown) panchromatic images of Connaught Place, New Delhi, India. The pixel-based texture analysis \(\mathrm{GLCM}\) technique is used for texture classification and quantification of the study area. \(\mathrm{GLCM}\), has provided information about the statistical and spectral behavior of the image pixels through the mathematical analysis. The quantification of the \(\mathrm{GLCM}\) features for pre-COVID and post-COVID images produces a new relationship among \(\mathrm{GLCM}\) features. Histogram signature plotting represents the changes in the frequency of intensity values of the study area. \(\mathrm{OBCD}\) technique provides information about the study area in a different pattern. In this technique, for pre-COVID and post-COVID images, “region of interest (\(\mathrm{ROI}\))” is selected by allotting pixels values to the \(\mathrm{ROIs}\). These \(\mathrm{ROI}\) behave as a “region” based on which classification of the study area is performed. Another set of \(\mathrm{ROI}\) is also created, which assists in the accuracy assessment. The advantage of \(\mathrm{OBCD}\) technique over \(\mathrm{PBCD}\) technique lies in the “visual point of view.” In this classification, there is also the possibility to compare only a “particular class,” leaving rest classes.
The article is divided into six separate sections. “Background of PBCD (GLCM) and OBCD techniques” provides detailed background information about \(\mathrm{PBCD}\) and \(\mathrm{OBCD}\) techniques. “Background of Skysat satellite program and details of the study area” presents a brief report on the Skysat satellite program and study area. “Experimental results” offers detail regarding experimental results of texture quantification and image classification. “Discussion” presents discussions and outcomes from the proposed research work. Finally, “Conclusion” offers concluding remarks on the research work.
Background of PBCD (GLCM) and OBCD techniques
GLCM-based texture classification technique
The texture is an essential aspect of gathering information from remote sensing images. Through texture analysis, spectral as well as spatial information of the study area is obtained. This technique is extensively used in various inaccessible sensing applications. Harlick et al. invented \(\mathrm{GLCM}\) (1973). He presented a set of “fourteen” different features to classify the image texture (Harlick et al 1973). Later a lot of work was done on these features. Gotlieb and Kreyszig organized these fourteen features into a set of four different categories (1990). Visual texture features are considered most important in remote sensing applications because they directly impact human visual perception. Texture visual features include contrast, correlation, angular second moment (\(\mathrm{ASM}\)), and inverse difference moment (\(\mathrm{IDM})\) (Haralick et al. 1973). The \(\mathrm{GLCM}\) formation from an input image is presented in Fig. 2. The location of pixel position in the input image is illustrated in Fig. 2a. Input image of dimension \(5\times 5\) is presented in Fig. 2b. The \(\mathrm{GLCM}\) image of the input image is shown in Fig. 2c. The normalized \(\mathrm{GLCM}\) image is presented in Fig. 2d.

a Pixel position of the input image, b input image of dimension \(5\times 5\), c \(\mathrm{GLCM}\) of the input image, and d normalized representation of the \(\mathrm{GLCM}\) image
\(\mathrm{GLCM}\) calculation of any input image is dependent on two critical parameters. These parameters are “distance” and “angle of orientation.” The distance represents space between the “pixel of interest” and the “neighboring pixel.” This distance can be varied to obtain different values of the texture features. The distance can be varied starting from \(d=1\), \(d=2\) and so on. The orientation angle presents the direction of the variation of the texture features following the distance. The orientation angle of an image can vary from 0° to 315°. This situation can be understood from Fig. 3, where different combinations of distances and orientations from a “pixel of interest (\(\mathrm{POI}\))” are presented.

\(\mathrm{GLCM}\) pixel, distance, and the orientation arrangement from the center image pixel
Let us assume an image with \({N}_{x}\) resolution cells in the “horizontal direction” and \({N}_{y}\) resolution cells in the “vertical direction.” The grey tone shown up in the image is quantized to \({N}_{g}\) level. Then the “horizontal spatial domain,” “vertical spatial domain,” and the “set of the quantized grey levels” are expressed by \({l}_{x}\), \({l}_{y}\) and \(G\). The set \({l}_{x}\times {l}_{y}\) is the resolution cell. Thus the grey tone in each resolution cell is expressed as \({l}_{x}\times {l}_{y}:G\). Therefore the expression for the angle quantized from 0° to 315° are expressed by Eqs. (1)–(8), where \((k,l)\) represents the image pixels.
Texture features developed by Haralick other than visual texture features are presented in Eqs. (9)–(18) (1973). These features are based on information theory, statistical measures, and information measures of correlation.
\(\mathrm{GLCM}\) features based on the “information theory,” in particular, entropy
Where \(x\) and \(y\) denote elements of the “row” and “column” respectively of the co-occurrence matrix and \({p}_{\left(x+y\right)}\) represents the “probability of the co-occurrence matrix” corresponding to \(x+y\). Similarly \({p}_{\left(x-y\right)}\) represent the “probability of the co-occurrence matrix” corresponding to \(x-y\).
\(\mathrm{GLCM}\) features based on “statistical measures.”
\(\mathrm{GLCM}\) features based on the “information measure of correlation.”
Where \(\mathrm{HXY}=-\sum_{k}\sum_{l}p\left(k,l\right)\mathrm{ log }(p\left(k,l\right))\), \(\mathrm{HX},\mathrm{ HY}\) are the entropies of px and py, \(\mathrm{HXY}1=-\sum_{k}\sum_{l}p\left(k,l\right)\mathrm{log}\left\{{p}_{x}(k){p}_{y}(l)\right\}\), \(\mathrm{HXY}2=-\sum_{k}\sum_{l}{p}_{x}(k){p}_{y}(l)\mathrm{log}\left\{{p}_{x}(k){p}_{y}(l)\right\}\)
\(\mathrm{GLCM}\) features representing visual texture features are presented in Table 2, which explains their mathematical notation, range, and discussion of these features.
The pixel-based \(\mathrm{GLCM}\) techniques have several advantages and shortcomings listed as follows.
Advantages of GLCM
-
In the \(\mathrm{GLCM}\) based change detection technique, spectral and spatial information of the study area is obtained.
-
GLCM offers two different procedures for the quantification of the image pixels. Firstly selection of the window size of dimensions like \(3\times 3\) or \(5\times 5\) over a complete image. Secondly, numerical quantification of the total image pixels can be performed, and on that basis, texture features can be quantified.
-
GLCM can offer information about the image features in four categories based on human visual perception, statistical measures, entropy measures, and correlation information.
-
The future aspect of the \(\mathrm{GLCM}\) can be understood from the fact that earlier \(\mathrm{GLCM}\) can provide information only in two dimensional (\(2\mathrm{D}\)) surfaces. Today, researchers and scientists have developed a procedure to calculate the \(\mathrm{GLCM}\) across three dimensions known as 3D GLCM.
-
GLCM can calculate the pixel brightness of the image through different combinations of the image pixels.
-
GLCM is used in remote sensing applications, but today, the \(\mathrm{GLCM}\) technique is also used in earth scattering data analysis to predict “Earthquakes” and “Tsunami” possibilities.
-
An essential advantage of the \(\mathrm{GLCM}\) is that its features can be obtained for the “single orientation and distance” along with “combination of directions and distances.”
Shortcoming of GLCM
Computation of the \(\mathrm{GLCM}\) is a time-consuming process. The main problem during \(\mathrm{GLCM}\) calculation is the computational cost using pixel to pixel combination of the image. The issue of \(\mathrm{GLCM}\) computation can be overcome by the use of \(\mathrm{GLCM}\) with the Sobel operator.
Background of the image classification technique
Image classification techniques are used to classify the image into several small objects or classes. These objects can be classified as soil, urban, agriculture, plants, trees, water, etc. When an image is segregated using an image classification technique, all the essential areas of the image can be classified into objects or classes. These areas of the image selected as the object depend upon the type of study, e.g., Fig. 4a consists of a band-fused “Phased array \(L\) band synthetic aperture radar (\(\mathrm{PALSAR}\))” image of the Roorkee region of Uttarakhand, India. This image is classified using three different classification techniques and in four other classes, i.e., bare soil (black color), water (blue color), urban (red color), and agriculture (green color). Thus if anyone wishes to study only two classes, water, and agriculture, their task is completed by Fig. 4d. If a study about three categories is required, they can opt for Fig. 4c and can obtain information about four classes through Fig. 4b. Thus performing an image classification and creating the number of objects depends entirely upon the application.

a Band fused \(\mathrm{PALSAR}\) data, b classified image with four prominent class, c classified image with three prominent class, and d classified image with two prominent class (Data Courtesy: Japanese Aerospace Exploration Agency, JAXA)
A comparison can be made when pre and post-image related to any natural phenomenon are classified based on several classes. Then this type of image classification approach falls under object-based change detection (\(\mathrm{OBCD}\)) (Zhang et al. 2018). When the comparison is made between two images using \(\mathrm{OBCD}\) methodologies, they are compared based on standard classification features, i.e., “user accuracy (\(\mathrm{UA}\)) (Tong and Feng 2020)”, “producer accuracy (\(\mathrm{PA}\)) (Tong and Feng 2020)”, “commission error (\(\mathrm{CE}\)) (Agariga et al. 2021),” “omission error (\(\mathrm{OE}\)) (Agariga et al. 2021),” “overall accuracy (\(\mathrm{OA}\)) (Tong and Feng 2020)”, and “kappa coefficient (Kp) (Tong and Feng 2020).” Some of the prominent image classification techniques using object formation to classify an image are “Maximum likelihood classification (\(\mathrm{MLC}\))” (Soni et al. 2021), “Spectral angle mapper (\(\mathrm{SAM}\))” (Wang et al. 2021), “Support vector machine (\(\mathrm{SVM}\))” (Leonga et al. 2021), “Minimum distance classification (\(\mathrm{MDC}\))” (Nie et al. 2021), “Parallelepiped classification (PC)” (Kundu et al. 2021), and “Spectral information divergence (SID)” (Hunt 2021). Brief details of these classification techniques and their methodologies are presented in these reviews.
Parallelepiped classification (PC)
\(\mathrm{PC}\) uses a “decision rule” to classify the multispectral, hyperspectral, \(\mathrm{RGB}\) image data. The image data boundaries are created through the “n—dimensional parallelepiped” in the image data space. Figure 5 represents the classification of the image data through parallelepiped classification. Here image pixels are classified into four different classes, i.e., Class A, Class B, Class C, and unclassified pixels. Here, while performing these classifications, pixels of one class get merged with the other class’s pixel unintentionally. The user estimates the minimum and maximum pixel value corresponding to each band or a range in this classification scheme. It is expressed in terms of “standard deviation” on either side of the “mean” of each feature. These values determine the scope of the parallelepiped classification, i.e., for Band A, the range of the category is \(\mu A-2S\le PC\le \mu A+2S,\) and the content of variety for Band B is \(\mu B-2S\le PC\le \mu B+2S\) where \(S\) is the standard deviation of the image.

Pixel allotment to a particular class according to mean value
Advantage of parallelepiped classification
-
This technique performs fast image classification.
-
This technique is suitable for non-normal distribution.
-
This technique can be applied over a limited land cover area.
Shortcoming of parallelepiped classification
-
Overlap** of classified classes are allowed in this classification technique, resulting in less accurate results.
-
In this classification technique, all the pixels are not classified.
-
One of the main problems with this algorithm is that pixels are spectrally apart from the signature mean, affecting the pixel classification.
Minimum distance classification (MDC)
\(\mathrm{MDC}\) technique is employed to classify “unknown image data” into separate object classes presented in Fig. 6. This approach’s main objective is to minimize the distance between the different object classes and anonymous image data. In other words, the distance is considered as the parameter of similarity, so the minimum distance between two observation classes is identical to the maximum similarity. The minimum distance can be calculated with the assistance of Eq. (19).
where \({(x}_{tp})\) is defined as the test pixel and (\({\mu }_{c})\) represents the mean value of the classified object.

Unknown data allotment to a particular class
Advantage of minimum distance classification
-
All the regions of the n—dimensional space get classified under this classification scheme.
-
The main advantage of this classification scheme is no overlap** of the image classes occurs during the image classification.
Shortcoming of minimum distance classification
-
In this classification scheme, spectral variability is assumed to be the same in all directions, producing false results.
Maximum likelihood classification (MLC)
This classification technique assumes that an individual class’s statistics in the respective band are typically distributed, represented in Fig. 7. This methodology calculates the “probability of the particular pixel” to a specific category, and that pixel is assigned to the object class having the “maximum probability” or “maximum likelihood.”

Pixel allotment in “Maximum likelihood image classification”
The mathematical relationship for establishing the maximum likelihood between the image pixels is expressed by Eq. (20).
where x represents the \(n\) band image data, \({L}_{p}\left(x\right)\) is the expression of the “likelihood of object” of class \(x\) belonging to the class p. \({\mu }_{p}\) represents the “mean vector” of the class k. \(\sum p\) is the representation for the “variance matrix.”
Advantage of maximum likelihood classification
-
This scheme is assumed to be the most sophisticated as under this image classification scheme, good separation between different classes is obtained.
Shortcoming of maximum likelihood classification
-
Accuracy assessment requires an intense training of the dataset to describe covariance and the mean structure of the classes.
Spectral angle mapper (SAM)
The created object’s spectrum is compared with the already known “object spectrum” in this classification technique.” As a result of \(\mathrm{SAM}\) classification, an image is obtained with the best match for the individual image pixel. This similarity in the range is analyzed in terms of similarity, with the “vector originated from the origin.” Usually, reflection intensity is represented by the length of the vectors illustrated in Fig. 8.

Representation of the spectral angle mapper corresponding to “Band A” and “Band B”
The spectrum angle describes the difference between the spectra of Band A and Band B. Finally, an image is classified into several classes by evaluating the rise developed between the reference spectrum and the object’s spectrum. The angle formed between two vectors is the cosine angle. This angle is expressed by Eq. (21).
where \(\alpha \) (alpha) is the angle between the “two vectors,” \(\mathrm{nb}\) represents the “total numbers of the spectral bands,” \({t}_{i}\) is the “target pixels” present in an image, and \(\mathrm{rp}\) is the total number of the reference pixels.
Advantage of spectral angle mapper
-
This method is considered a user-friendly and quick method to map the spectral similarity of the image spectra against a reference spectrum.
-
This technique produces good classification results even in the presence of the scaling noise.
Shortcoming of spectral angle mapper
-
This technique does not respond to a situation in which a vector magnitude fails to discriminate information in many instances.
Spectral information divergence (SID)
\(\mathrm{SID}\) uses a “spectral classification approach” to compare image pixels with the reference spectrum. The tool used for the comparison is the divergence measure. Slight divergence is the indication of the small image pixels. Pixels having considerable divergence values above a predefined threshold are not classified under this approach. Spectra of the end member can be extracted directly from an image. The \(\mathrm{SID}\) method computes the “spectral similarity” based on the divergence between the probability distribution of two spectra. Let us assume an embodiment with reference spectra (\(R\)) and test spectra (\(T\)).
The distribution value for the reference spectra can be expressed by Eq. (22).
The distribution value for the test spectra can be expressed by Eq. (23).
The \(\mathrm{SID}\) corresponding to the reference and the test spectra is expressed by Eq. (24).
Figure 9 represents the stacking of bands from Band 1 to Band 8 to develop a multiband image model using the \(\mathrm{SID}\) technique.

Band fusion in the spectral information divergence
Advantage of spectral information divergence
-
SID measures the amount of deviation by analyzing the probabilistic behaviors of the pixel’s spectral signatures. This comparison depends on the information theory, which is considered the more effective in retaining spectral properties; through this methodology, the spectral similarity between two image pixels can also be measured.
Shortcoming of spectral information divergence
-
SID is considered an efficient image processing technique. A critical drawback of this technique is the variation in the “output results” due to a change in the “light intensity,” which affects the classification results.
Support vector machine (SVM)
The “support vector machine (\(\mathrm{SVM}\))” classification technique is based on “supervised learning for data analysis and study.” This technique uses a “machine learning approach.” This technique follows image classification and regression data analysis. \(\mathrm{SVM}\) follows the kernel principle to perform linear and nonlinear image regression. In this algorithm, two hyperplanes are separated from each other using “support vector 1” and “support vector 2”. The pixels that need to be classified are situated opposite the hyperplane represented by Fig. 10. This algorithm of image classification was developed by “Hava Siegelmann” and “Vladimir Vapnik.” (Tiwari et al. 2021). This algorithm was initially developed for computer vision and pattern recognition but later used in satellite remote sensing and image processing applications.

Hyperloop diagram for support vector machine
The hypothesis function is expressed by Eq. (25).
Thus the pixels “above the hyperplane” is classified as \(+1\), and the pixels “below the hyperplane” is classified as \(-1\).
Advantage of the SVM
-
Perform effective classification in high dimensions compared to the \(K\) nearest neighbor algorithm.
-
The most effective classification technique for the cases having several sizes and remarkable than the number of samples.
-
SVM is a versatile technique having different functions to be specified for the decision function.
-
When the separation margin between a plane is evident, then this methodology works most efficiently.
Shortcoming of SVM
-
Several parameters like Kernel, \(C-\), and Gamma function need to be set correctly in the \(\mathrm{SVM}\) classification approach to obtain better classification results. So at the same time, different parameters need to be taken care of for better classification.
-
SVM does not assist in determining probability estimates directly. These features require a “fivefold cross-validation process” to compute.
-
A good classification result is challenging to obtain through this methodology when the dataset contains extreme noise.
Background of Skysat satellite program and details of the study area
In today’s world, several states governments, and private industries compete to explore massive and vital information from Earth. Several government space agencies are actively participating in researching information about the origin of a novel coronavirus and its impact on the daily activity of ordinary human beings. Currently, six different space agencies “European Space Agency (\(\mathrm{ESA}\)) (Wörner 1975),” “National Aeronautics and Space Administration (\(\mathrm{NASA}\)) (Dunbar 1958),” “Japan Aerospace Exploration Agency (\(\mathrm{JAXA}\)) (Yamakawa 2003),” “Russian Federal Space Agency (\(\mathrm{RFSA}\) or Roscosmos) (Government 1992),” “China National Space Administration (\(\mathrm{CNSA}\)) (Kejian 1993)” and “Indian Space Research Organisation (\(\mathrm{ISRO}\)) (Sarabhai 1969)” are working in the field of satellite launch and satellite recovery. These agencies have their own satellite launch capacities. Besides these their several other governments sponsored space agencies like the “Canadian Space Agency (François-Philippe 1989),” “UK Space Agency (Annett 2010),” “Australian Space Agency (Palermo 2018),” etc., that are actively working in the field of Earth exploration and remote sensing. Some prominent private players in space exploration include “SpaceX (Musk 2002),” “Boeing (Calhoun 1916),” “Sierra Nevada Corporation (Corporation 1963),” “Orbital (Thompson 1982),” etc. Skysat is a commercial microsatellite of Skybox imaging. This Earth observational satellite was developed to collect high-resolution multispectral and panchromatic images of the Earth's surface. This satellite universe consists of 21 satellites dedicated to Earth imaging. A private firm, “Planet own these satellites.” First Skysat-1 was launched on 21 November 2013 (Marshall et al. 2010). Last year on 18 August 2020, Skysat 19–21 were launched (Marshall et al. 2010). The orbital type of Skysat 1–15 is sun-synchronous, whereas Skysat 16–21 is non-sun-synchronous. Skysat 1–2 has an orbital altitude of 600 km, Skysat 3–15 has an orbital altitude of 500 km, and Skysat 16–18 has an orbital length of 400 km. The sensor installed on these satellite systems operates at spectral bandwidth of blue 450–515 nm, green 515–595 nm, red 605–695 nm, NIR 740–900 nm, and \(\mathrm{PAN}\) 450–900 nm (Marshall et al. 2010).
In this research work, two panchromatic images of the pre-COVID and post-COVID (during lockdown) are obtained for the Skysat image database under the “research and training program” (Marshall et al. 2010). The pre-COVID image and post-COVID image of the Connaught Place, New Delhi, investigated in this research work are represented in Fig. 11d, e. The study area's pre-COVID and post-COVID images are obtained on 30 April 2019 and 14 April 2020, respectively (Marshall et al. 2010). Connaught place’s study area is popularly known as “Rajiv Chowk” (Hazarika et al. 2015). It is the leading financial and commercial center of the National capital of India. The study area is located at the heart of the National capital. It is having a latitude and longitude position of 28°37′58′ N and 77°13′11′ E (Hazarika et al. 2015). The area of the Connaught place is 2.36 km2. The rapid urbanization in Connaught place has increased energy consumption and traffic density. Moreover the \({\mathrm{PM}}_{2.5}\) level of the Connaught place is highest in the National capital region (Shukla et al. 2020). Even the concentration of the \({\mathrm{PM}}_{2.5}\) level has even touched 999 μg/m3 during the worst time period (Mukherjee et al. 2020). The temperature of Connaught place raise to 45 °C during summers of April-June and falls to 8 °C during winters of December to January. Thus all these features significantly affect image classification and texture quantification.

Earthly location of the Connaught Place, New Delhi (Study area)
Experimental results
Change estimation through PBCD GLCM based technique
In this investigation, three different band images of the study area are fused with the layer stacking technique available in ENVI 5.2. The layer stacking approach assists in generating a band-fused \(\mathrm{RGB}\) image of the study area. The final image of the study area consists of all the essentials bands; thus \(\mathrm{GLCM}\) method is applied to the study area. Figure 12a presents the \(\mathrm{RED}\) band pre-COVID image of the study area, Fig. 12b presents the \(\mathrm{GREEN}\) band pre-COVID image of the study area and Fig. 12c presents the \(\mathrm{BLUE}\) band pre-COVID image of the study area. Finally, all the bands are fused to create an \(\mathrm{RGB}\) image of the study area presented in Fig. 12d.

Pre-COVID image of the study area a \(\mathrm{RED}\) Band, b \(\mathrm{GREEN}\) Band, c \(\mathrm{BLUE}\) Band, and d Stacked (\(\mathrm{RGB}\))
The \(\mathrm{RGB}\) image of the study area is converted to a gray level image to identify the changes in the study area represented in Fig. 13. The pixels count along the X-axis is \(2400\) pixels and along the Y-axis is \(1800\) pixels. Thus the total pixel count in the image is \(\mathrm{4,320,000}\) pixels. Here, through the \(\mathrm{GLCM}\) approach, one can identify the changes as a whole no separate object-based information is provided through \(\mathrm{GLCM}\). Figure 13a represents the grey level representation of the band fused pre-COVID image of the study area. Histogram signature plot of the band combined image represents the distribution of the frequency of the intensity value corresponding to the \(4.32\times {10}^{6}\) image pixels illustrated in Fig. 13b. The visual texture features for the pre-COVID image are quantified and presented in Table 3. Here the feature values are calculated corresponding to the total image pixels. Texture features are quantified corresponding to four orientation angles i.e. 0°, 45°, 90° and 135° and eight different distances \(d=1\), \(d=2\), \(d=3\), \(d=4\), \(d=5\), \(d=6\), \(d=7\) and \(d=8\). Later the texture features are averaged to make “\(\mathrm{GLCM}\) direction independent.”
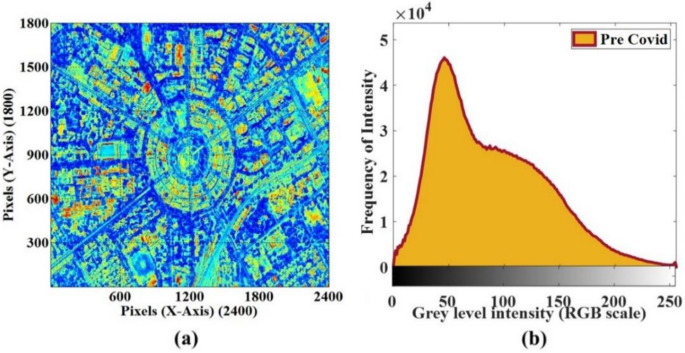
Pre-COVID image. a Gray level representation. b Histogram signature plot
The texture features contrast, correlation, \(\mathrm{ASM}\), and \(\mathrm{IDM}\) are plotted to obtain their specific behavior. Concerning 0° for eight different distances \(d=1\), \(d=2\), \(d=3\), \(d=4\), \(d=5\), \(d=6\), \(d=7,\) and \(d=8\) it has been observed that “contrast” is sharply increasing with the orientation and distance. The correlation feature has presented a sharp decline in the quality. Energy features have indeed shown a reduction in the feature value, but the decline rate is prolonged. Finally, the feature \(\mathrm{IDM}\) has also presented a sharp decline in the feature values similar to the decline rate of the correlation feature represented in Fig. 14a.

Comparison of the texture features for pre-COVID image at different distances. a Pre-COVID (0°). b Pre-COVID (45°). c Pre-COVID (90°). d Pre-COVID (135°)
Similarly, the \(\mathrm{GLCM}\) feature behavior corresponding to a 45° is presented in Fig. 14b, corresponding to a 90° is introduced in Fig. 14c and corresponding to a 135° is illustrated in Fig. 14d. It has been observed that \(\mathrm{GLCM}\) features have obtained the same pattern in the quantified feature values for different orientation angles. Thus from this analysis, new information about the \(\mathrm{GLCM}\) is discovered that this approach can also be used for pattern recognition. \(\mathrm{GLCM}\) is mainly considered an approach for texture classification, but \(\mathrm{GLCM}\) has provided information about the image texture as a whole; not specific details on any classified object can be identified from the \(\mathrm{GLCM}\). Similarly, the post-COVID image of the study area is explored, and texture feature quantification and feature plotting are performed to obtain new information.
The post-COVID image analysis of the study area is presented in Fig. 15. Figure 15a represents the \(\mathrm{RED}\) band image, Fig. 15b presents the \(\mathrm{GREEN}\) band image, and Fig. 15c represents the \(\mathrm{BLUE}\) band image of the study area. All the images are fused to obtain a multiband \(\mathrm{RGB}\) image of the study area. Some general assumption about the post-COVID image is that low or no traffic on the streets will be observed. Due to the continuous lockdown situation, it is expected that the air quality will also be undoubtedly improved. Thus it will be interesting to observe the behavior of the texture features for the post-COVID image. The layer stacking technique available with ENVI 5.2 is adopted to perform band fusion and develop an \(\mathrm{RGB}\) image of the study area. Figure 15d represents the band fused post-COVID image of the study area.

Post-COVID image of the study area. a \(\mathrm{RED}\) Band, b \(\mathrm{GREEN}\) Band, c \(\mathrm{BLUE}\) Band, and d Stacked (\(\mathrm{RGB}\)) band
The grey level representation of the post-COVID study area is presented in Fig. 16. Figure 16a represents the post-COVID image of the study area, which visually looks similar to the pre-COVID image. No significant change is visually identified in the study area. The quantification of the texture features can obtain a difference in the study area, and the modifications are developed in the histogram signature plot of the study area. The histogram signature plot in Fig. 16b visually represents the changing pattern of the surface of the study area. The quantification of the texture features for the post-COVID image is presented in Table 4.

Post-COVID image. a Gray level representation. b Histogram signature plot
The texture features for the post-COVID image seem to be identical with the texture features of the pre-COVID image shown in Fig. 17. The behavior of the texture feature “contrast” has shown an increasing pattern for 0°, 45°, 90° and 135°. Texture features correlation has shown decreasing pattern for all four degrees. The decrease of these texture features is high compared to the remaining texture features for all four orientations. Texture feature \(\mathrm{ASM}\) has shown a minimum decrease rate. Finally, texture feature \(\mathrm{IDM}\) has also shown decreasing pattern for all four directions. Here it has been observed that when \(\mathrm{GLCM}\) is used to compare two multi-band images. It may be possible that the change developed in the two images can be visually identified. Histogram signature plotting is a method to determine the occurrence of changes. The most important procedure to detect the developed changes is the comparison of the average texture features. As discussed earlier, an average of the \(\mathrm{GLCM}\) features is done to make the \(\mathrm{GLCM}\) direction independent. Figure 18a compares the texture features for the pre-COVID and post-COVID images. Here it can be seen that “contrast” has obtained the highest peak value. Contrast is highest for 0°, 45°, 135° with corresponds to post-COVID image, for 90° contrast for pre-COVID image is high. Correlation has obtained a high-value corresponding to all orientations for the pre-COVID image. \(\mathrm{ASM}\) has received a high value for all directions corresponding to the post-COVID image. Finally, \(\mathrm{IDM}\) received a high value for all orientations corresponding to the post-COVID image. Thus, texture features have obtained high feature values for the post-COVID image for most cases. Figure 18b represents the change in the texture features along the positive or negative end. Five times, the difference of texture features for pre-COVID and post-COVID images have produced positive values, and on eleven occasions, texture features have negative values. This also suggests that post-COVID image texture features have obtained higher values than the pre-COVID image.

Comparison of the texture features for post-COVID image at different distances. a Post-COVID (0°). b Post-COVID (45°). c Post-COVID (90°). d Post-COVID (135°)

a Change in the texture features corresponding to pre-COVID and post-COVID image. b Change pattern analysis of the feature values
Change analysis through object-based image classification techniques
While performing image classification through object-based image classification techniques. A particular area is classified into several objects. These objects are geographical areas of the study area like water, land, soil, tree, etc. Some of the prominent terms associated with the object-based image classification through which the image classification is performed are \(\mathrm{UA}\), \(\mathrm{PA}\), \(\mathrm{CE}\), \(\mathrm{OE}\), \(\mathrm{OA}\) and Kp. The procedure to calculate these image classification features can be understood by the example of a confusion matrix represented in Fig. 19. Here a confusion matrix with arbitrary image classification is assumed. This random image is classified into four different classes as water, vegetation, urban, and soil.

Test data for the image classification
Now different parameters corresponding to the image classification are computed as follows.
Commission error (\(CE\)) is generated when the pixels of one class get wrongly introduced in the class under observation. \(\mathrm{CE}\) concerning the classified categories can be expressed by Eqs. (26–29).
Omission error (\(OE\)) refers to the classified pixels that are accidentally omitted from the investigation classes. \(\mathrm{OE}\) concerning the classified classes is expressed by Eqs. (30)–(33).
User accuracy (\(UA\)) is defined as the “accuracy” from the perspective of the “map user,” not from the perspective of the “map maker.” \(\mathrm{UA}\) concerning the classified classes are expressed by Eq. (34)–(38).
Producer accuracy (\(PA\)) is defined as the “accuracy” from the perspective of the “map maker,” not from the perspective of the “map user.” \(\mathrm{PA}\) concerning the classified classes is expressed by Eqs. (39)–(43).
Overall accuracy (\(OA\)) can be understood as a ratio between the “correctly classified pixels” to the “total number of pixels” present in the image. It is expressed by Eq. (44).
\(\mathrm{OA}\) for the confusion matrix presented in Fig. 19 is calculated as \(\mathrm{OA}=\frac{35+44+152+59}{407}=\frac{290}{407}=0.7125=71.25\%\). Thus the \(\mathrm{OA}\) classification accuracy for the presented confusion matrix is \(71.25\%.\)
Finally, the Kp is calculated to obtain classification accuracy. It is the measure of how well the classification of the study area dataset is performed. The range of Kp is \([-1, 1]\). Mathematically it is expressed by Eq. (45).
where \(\mathrm{probablity} \left(O\right)\) is considered as the “observed agreement” among various classification raters. This is assumed to be identical with accuracy. \(\mathrm{Probablity} \left(e\right)\) is considered as a “theoretical probability of the chance agreement.” While performing the image classification using the Kp following assumptions are kept into consideration.
If Kp is lying close to \(-1\), then it is assumed to be a worse image classification.
If Kp is lying close to 0, then it is random image classification.
If Kp is lying close to \(+1\), then the classification is assumed to be significantly realistic and close to accurate.
In early \(2020\), coronavirus was assumed to be spread in the entire world. In the \(\mathrm{USA}\), during early January of \(2020\), coronavirus was considered to have limited spread (Jorden et al. 2020). In China, cases related to the novel coronavirus began to report from late 2019 (Xu et al. 2020). Issues related to coronavirus were highlighted in early \(2020\), but the government of South Africa imposed a lockdown by March \(2020\) (Atangana and Araz 2020). Figure 20 presents the geographical locations of some prominent places before and during the lockdown. Here the pre lockdown images represent normal day-to-day activities of the people. A sudden stop in everyday activities is reported during the lockdown, i.e., no people on the road, empty roads, no industrial activities, etc.

Pre and post-COVID Skysat images of the various location, pre-COVID. a China, Bei**g (12 April 2020), c Sudan Omdurman, (23 April 2020), e Tyson foods, Washington, USA (30 April 2020), g South Africa, Johannesburg (27 September 2019); post-COVID. b China, Bei**g (12 April 2020), d Sudan, Omdurman (23 April 2020), f Tyson foods, Washington, USA (30 April 2020), h South Africa, Johannesburg (27 September 2019)
The pre and post-study area images are classified using six different image classification techniques, i.e., \(\mathrm{PC}\), \(\mathrm{MDC}\), \(\mathrm{MLC}\), \(\mathrm{SAM}\), \(\mathrm{SID}\), and \(\mathrm{SVM}\). The image classification is performed based on six other classes, i.e., buildings, trees, roads, grasslands, metro, and cars. Two different sets of \(\mathrm{ROIs}\) are created for classifying the images. \(\mathrm{ROI}\) set 1 contain image pixels for training the data and \(\mathrm{ROI}\) set 2 image pixels for the accuracy assessment. Table 5 presents details of the pixel’s count collected for training and accuracy assessment of the image data. Pre-COVID classification results of the study area are shown in Fig. 21.

Pre-COVID image classification. a “Parallelepiped classification”, b “Minimum distance classification”, c “Maximum likelihood classification”, d “Spectral angle mapper”, e “Spectral Information Divergence”, f “Support Vector Machine”
The image classification features for different classification schemes are tabulated in Table 6.
The image classification of the post-COVID study area is performed and presented in Fig. 22. The image classification features for different classification schemes obtained for the post-COVID image are tabulated in Table 7.

Post-COVID image classification. a “Parallelepiped classification”, b “Minimum distance classification”, c “Maximum likelihood classification”, d “Spectral angle mapper”, e “Spectral Information Divergence”, f “Support Vector Machine”
The image classification of the pre-COVID and post-COVID image through different object-based image classification techniques visually presents the change in the study area. It has been observed that the pre-COVID image “\(\mathrm{MLC}\) scheme” has shown the most satisfactory results both visually and numerically. In the post, COVID image classification “\(\mathrm{MLC}\) scheme” has produced the most reliable results. As in both cases, image classification is performed through \(\mathrm{MLC}\) technique, and most of the classes in image classification have appeared. In \(\mathrm{PC}\) technique building, trees and roads classes are most dominant while other classes remain inactive during the classification. In the pre-COVID classified image through \(\mathrm{MDC}\) technique, four classes are prevalent, i.e., trees, cars, roads, and buildings.
In contrast, three classes are dominant in the post-COVID classified image, i.e., trees, roads, and buildings. In the pre-classified image through \(\mathrm{SAM}\) technique, four classes are most prevalent, i.e., building, grassland, trees, and road. In contrast, only three classes are dominant in the post-classified image, i.e., building, tree, and road. \(\mathrm{SID}\) classification technique has produced the most abrupt result against the image classification. In the pre-COVID image, it is observed that the class “car” is most dominant, whereas, in the post-COVID image, the class building is dominant. This classification scheme has produced the worst classification results. Finally, through \(\mathrm{SVM}\) classification scheme, buildings, trees, and roads are the most prevalent class in the pre-COVID classified image. In the post-COVID image tree, cars and roads have appeared as the most dominant image class.
The linear fitting of the degree (1) corresponding to kappa coefficient (Kp) and overall accuracy (\(\mathrm{OA}\)) is present in Fig. 23. The curve fitting value is \({R}^{2}\ge 0.99\) for pre-COVID and post-COVID images. This suggests that the overall classification accuracy is directly proportional to the Kp\(.\) One important conclusion derived from this experiment is that \(\mathrm{MLC}\) has emerged as a reasonable classification scheme with superior accuracy and kappa coefficient.

Relationship of degree (1) between kappa coefficient and overall accuracy. a Pre-COVID. b Post-COVID
Discussion
In this research work, an innovative combination of \(\mathrm{PBCD}\) and \(\mathrm{OBCD}\) techniques is presented. \(\mathrm{GLCM}\) has emerged as a creative technique that contains information about the “statistical and spectral arrangement” of the image pixels. This information can be concluded in common words as \(\mathrm{GLCM}\) offer information about the changes occurring inside the image, i.e., information about the spectral and spatial arrangement of the image pixels. The \(\mathrm{OBCD}\) techniques have emerged as an ideal method to represent the changes developed in the study area visually. Here, users can create an object (class) of interest and compare pre-and post-image specifications based on the same object. Through \(\mathrm{OBCD}\) technique, not only classes can be made, but the accuracy of the classification can also be obtained. Thus it is observed that PBCD GLCM approach and \(\mathrm{OBCD}\) both techniques provide useful information related to image classification. Usage of any one of the techniques or both techniques depends upon the application only. In this research, a fusion methodology of \(\mathrm{PBCD}\) and \(\mathrm{OBCD}\) techniques is presented to extract maximum information from the study area. Finally, based on the experimental results, a model is developed to exact the full report of the study area shown in Fig. 24. It is also expected that the proposed model will work efficiently with other types of images, including multispectral images and hyperspectral images.

Proposed \(\mathrm{PBCD}\) and \(\mathrm{OBCD}\) fusion model
The presented model for image analysis includes \(\mathrm{PBCD}\) based \(\mathrm{GLCM}\) approach, which provides complete image information about the “spectral and spatial arrangement.” In \(\mathrm{OBCD}\) process, select the best classification methodology having superior accuracy with maximum \(Kp\). Thus all the features obtained from \(\mathrm{GLCM}\) and \(\mathrm{OBCD}\) assist to under an event altogether.
The texture classification of the study area presented in this work presents information about specific changes caused due to COVID lockdown in the study area. These changes are represented in the histogram signature plot of the pre-COVID and post-COVID images. \(\mathrm{GLCM}\) features have also presented a pattern of statistical variation in which \(\mathrm{ASM}\) have show exponential increase in the feature values whereas correlation, energy, and \(\mathrm{IDM}\) have shown fall in their feature values. The role of \(\mathrm{OBCD}\) technique in change identification is remarkably selecting an appropriate classification algorithm depends upon several factors like the study area. If the spatial resolution of the image is less (study area has less number of image pixels), then the user has a clear view of the classification classes. Then, in this case, good classification accuracy is expected from \(\mathrm{SVM}\), \(\mathrm{ML}\), \(\mathrm{MLC}\) approaches. Likewise, the Kp will also have a high value. Now, suppose the study area has high resolution with a large number of image pixels. In this case, it is expected that selecting an appropriate number of pixel numbers for a particular class is difficult. Thus low overall classification accuracy along with less Kp will be obtained in this case. \(\mathrm{OBCD}\) technique is quite effective in representing the visual difference of the developed changes. All the classified objects are visible and easily distinguishable through \(\mathrm{OBCD}\) schemes. Thus the fusion of \(\mathrm{GLCM}\) and \(\mathrm{OBCD}\) techniques are desirable for the cases where internal and external information of the study area is required.
Conclusion
This research work presents two different methodologies fused to obtain maximum information from data of interest. Firstly quantification of texture features based on the “grey level co-occurrence matrix (\(\mathrm{GLCM}\))” technique is performed. In the second step, image classification based on “object-based change detection (\(\mathrm{OBCD}\))” methods visually represents the transformation developed in the study area due to COVID lockdown. Pre-COVID and post-COVID (during lockdown) panchromatic images of Connaught Place, New Delhi, are analyzed in this research work to develop an accurate model for the study area. Texture classification of the images is performed based on visual texture features for eight distances and four orientations. Six different image classification methodologies are used for performing the image classification of the study area. These methodologies are “Parallelepiped classification (\(\mathrm{PC}\)),” “Minimum distance classification (\(\mathrm{MDC}\)),” “Maximum likelihood classification (\(\mathrm{MLC}\)),” “Spectral angle mapper (\(\mathrm{SAM}\)),” “Spectral Information Divergence (\(\mathrm{SID}\))” and “Support Vector Machine (\(\mathrm{SVM}\)).” \(\mathrm{GLCM}\) features quantification has provided a novel pattern of texture variations, i.e., contrast, correlation, \(\mathrm{ASM}\), and \(\mathrm{IDM}\). \(\mathrm{OBCD}\) based \(\mathrm{MLC}\) techniques have provided a maximum classification accuracy of \(83.68\%\) and \(73.65\%\) for the pre-COVID and post-COVID image data. Finally, a model is presented based on the above investigation for analyzing before and after COVID images. The model follows a two-step methodology with a final fusion of the obtained information to produce complete information about the study area numerically and visually.
References
Agariga F, Abugre S, Appiah M (2021) Spatio-temporal changes in land use and forest cover in the Asutifi North District of Ahafo Region of Ghana (1986–2020). Environ Chall 5:100209. https://doi.org/10.1016/j.envc.2021.100209
Annett I (2010) UK Space Agency (Government of UK) Retrieved 26 Jul 2021. https://www.gov.uk/government/organisations/uk-space-agency
Arefin R, Meshram SG, Santos CA, Silva RM, Pushparaj J (2020) Hybrid modelling approach for water body change detection at Chalan Beel area in northern Bangladesh. Environ Earth Sci 79:442. https://doi.org/10.1007/s12665-020-09185-y
Atangana A, Araz Sİ (2020) Mathematical model of COVID-19 spread in Turkey and South Africa: theory, methods, and applications. Adv Differ Equ 2020:659. https://doi.org/10.1186/s13662-020-03095-w
Baker K, Culton E, Lang J, Lewis Z, Perez-Alemany R, Rizzo A (2020) An updated re-entry analysis of the Hubble Space Telescope. J Space Saf Eng 7(3):404–410
Caballero GR, Platzeck G, Pezzola A, Casella A, Winschel C, Silva SS (2020) Assessment of multi-date Sentinel-1 polarizations and GLCM texture features capacity for onion and sunflower classification in an irrigated valley: an object level approach. Agronomy 10(6):845
Calhoun D (1916) Boeing (Boeing: Aerospace company). Retrieved 26 Jul 2021. https://www.boeing.com/
Chandrashekar S (2016) Space, war, and deterrence: a strategy for India. Int J Space Politics Policy 14(2–3):135–157
Chen G, Weng Q, Hay GJ, He Y (2018) Geographic object-based image analysis (GEOBIA): emerging trends and future opportunities. Gisci Remote Sens 55(2):159–182
Cohen IJ, Rymer AM (2020) Cross-NASA divisional relevance of an Ice Giant mission. Trans R Soc Am 378(2187):1–12
d’Italie R (2020) Drones and the coronavirus: do these applications make sense? (We Robotics). Retrieved 10 Mar 2021. https://blog.werobotics.org/2020/04/09/drones-coronavirus-no-sense/
Damle SV, Daniel RR, Lavakare PJ (1976) Energetic neutrons and gamma rays measured on the Aryabhata satellite. Pramana 7:355–368. https://doi.org/10.1007/BF02847032
Du P, Wang X, Chen D, Liu S, Lin C, Meng Y (2020) An improved change detection approach using tri-temporal logic-verified change vector analysis. ISPRS J Photogramm Remote Sens 161:278–293. https://doi.org/10.1016/j.isprsjprs.2020.01.026
Dunbar B (1958) About NASA (National Aeronautics and Space Administration). Retrieved 26 Jul 2021. https://www.nasa.gov/
Eid AN, Olatubara CO, Ewemoje TA, El-Hennawy MT, Farouk H (2020) Inland wetland time-series digital change detection based on SAVI and NDWI indices: Wadi El-Rayan lakes, Egypt. Remote Sens Appl: Soc Environ 19:100347. https://doi.org/10.1016/j.rsase.2020.100347
François-Philippe (1989) Canadian Space Agency (Governement of Canada). Retrieved 26 Jul 2021. https://www.asc-csa.gc.ca/eng/Default.asp
Garg M, Dhiman G (2021) A novel content-based image retrieval approach for classification using GLCM features and texture fused LBP variant neural computing and applications. Neural Comput Appl 33:1311–1328. https://doi.org/10.1007/s00521-020-05017-z
Gotlieb CC, Kreyszig HE (1990) Texture descriptors based on co-occurrence matrices. Comput vis Graph Image Process 51(1):70–86
Government R (1992) ROSCOSMOS (State Space Corporation ROSCOSMOS). Retrieved 26 Jul 2021. http://en.roscosmos.ru/
Haider SA, Pandya BM (2015) Probing of meteor showers at Mars during the encounter of comet C/2013 A1: predictions for the arrival of MAVEN/Mangalyaan. Geosci Lett 2:8. https://doi.org/10.1186/s40562-015-0023-2
Hajeb M, Karimzadeh S, Fallahi A (2020) Seismic damage assessment in Sarpole-Zahab town (Iran) using synthetic aperture radar (SAR) images and texture analysis. Nat Hazards 103:347–366. https://doi.org/10.1007/s11069-020-03991-0
Haralick RM, Shanmugam K, Dinstein I (1973) Textural features for image classification. IEEE Trans Syst Man Cybern SMC-3(6):610–621
Hazarika N, Jain VK, Srivastava A (2015) Source identification and metallic profiles of size-segregated particulate matters at various sites in Delhi. Environ Monit Assess 187:602. https://doi.org/10.1007/s10661-015-4809-7
Hunt ER Jr (2021) Spectral discrimination using infinite leaf reflectance and simulated canopy reflectance. Int J Remote Sens 42(8):3039–3055
Hussain M, Chen D, Cheng A, Wei H, Stanley D (2013) Change detection from remotely sensed images: from pixel-based to object-based approaches. ISPRS J Photogramm Remote Sens 80:91–106
Iqbal N, Mumtaz R, Shafi U, Zaidi SM (2021) Gray level co-occurrence matrix (GLCM) texture-based crop classification using low altitude remote sensing platforms. PeerJ Comput Sci 7:e536. https://doi.org/10.7717/peerj-cs.536
Jiang S, Jiang C, Jiang W (2020) Efficient structure from motion for large-scale UAV images: a review and a comparison of SfM tools. ISPRS J Photogramm Remote Sens 167:230–251. https://doi.org/10.1016/j.isprsjprs.2020.04.016
Jorden MA, Rudman SL, Villarino E, Hoferka S et al (2020) Evidence for limited early spread of COVID-19 Within the United States, January–February 2020. MMWR Morb Mortal Wkly Rep 69(22):680–684
Kalaiselvi S, Gomathi V (2020) Alpha-cut induced fuzzy deep neural network for change detection of SAR images. Appl Soft Comput 95:106510. https://doi.org/10.1016/j.asoc.2020.106510
Kejian Z (1993) China National Space Administration (Government of China). Retrieved 26 Jul 2021. http://www.cnsa.gov.cn/english/
Kerle N, Nex F, Gerke M, Duarte D, Vetrivel A (2020) UAV-based structural damage map**: a review. ISPRS Int J Geo-Inf 9(1):14
Khelifi L, Mignotte M (2020) Deep learning for change detection in remote sensing images: comprehensive review and meta-analysis. IEEE Access 8:126385–126400. https://doi.org/10.1109/ACCESS.2020.3008036
Kundu K, Halder P, Mandal JK (2021) Detection and prediction of sundarban reserve forest using the CA-Markov chain model and remote sensing data. Earth Sci Inf 1:1–18. https://doi.org/10.1007/s12145-021-00648-9
Leonga WC, Bahadori A, Zhang J, Ahmad Z (2021) Prediction of water quality index (WQI) using support vector machine (SVM) and least square-support vector machine (LS-SVM). Int J River Basin Manag 19(2):149–156
Li B, Yang Z-P, Chen D-Q, Liang S-Y, Ma H (2020) Maneuvering target tracking of UAV based on MN-DDPG and transfer learning. Def Technol. https://doi.org/10.1016/j.dt.2020.11.014
Liu R, Wang R, Huang J, Li J, Jiao L (2020) Change detection in SAR images using multiobjective optimization and ensemble strategy. IEEE Geosci Remote Sens Lett. https://doi.org/10.1109/LGRS.2020.3005140
Maimaitijiang M, Sagan V, Sidike P, Daloye AM, Erkbol H, Fritschi FB (2020) Crop monitoring using satellite/UAV data fusion and machine learning. Remote Sens 12(9):1357
Marshall W, Boshuizen C, Schingler R (2010) Planet (Planet Labs Inc). Retrieved 26 Jul 2021. https://www.planet.com/
Mathieu P-P, Borgeaud M, Desnos Y-L, Rast M, Brockmann C, See L (2017) The ESA’s earth observation open science program [space agencies]. IEEE Geosci Remote Sens Mag 5(2):86–96
Mukherjee T, Asutosh A, Pandey SK, Yang L, Gogoi PP, Panwar A, Vinoj V (2020) Increasing potential for air pollution over megacity New Delhi: a study based on 2016 Diwali episode. Aerosol Air Qual Res 18(9):2510–2518
Muraleedharan D, Haridasan P, Samad AA, Varier GS, Vinod P (2019) Reconfigurable wavelet-based real-time imaging system for low bit rate telemetry space missions. IEEE Aerosp Electron Syst Mag 34(5):22–29
Musk E (2002) TRANSPORTER-2 MISSION (SpaceX). Retrieved 26 Jul 2021. https://www.spacex.com/
Nascimento IJ, Cacic N, Abdulazeem HM, Groote TC, Jayarajah U (2020) Novel coronavirus infection (COVID-19) in humans: a sco** review and meta-analysis. J Clin Med 9(4):941
Nie L, Sun W, Wang S, Ning Z, Rodrigues JJ, Wu Y, Li S (2021) Intrusion detection in green internet of things: a deep deterministic policy gradient-based algorithm. IEEE Trans Green Commun Netw 5(2):778–788
Niethammer U, James MR, Rothmund S, Travelletti J, Joswig M (2012) UAV-based remote sensing of the Super-Sauze landslide: evaluation and results. Eng Geol 128:2–11. https://doi.org/10.1016/j.enggeo.2011.03.012
Otto A, Agatz N, Campbell J, Golden B, Pesch E (2018) Optimization approaches for civil applications of unmanned aerial vehicles (UAVs) or aerial drones: a survey. Network 72(4):411–458
Palermo E (2018) Australian Space Agency (Australian Government). Retrieved 26 Jul 2021. www.industry.gov.au
Papanastassiou DA, Wasserburg GJ (1971) Rb–Sr ages of igneous rocks from the Apollo 14 mission and the age of the Fra Mauro formation. Earth Planet Sci Lett 12(1):36–48
Pati C, Panda KA, Tripathy AK, Pradhan KS, Patnaik S (2020) A novel hybrid machine learning approach for change detection in remote sensing images. Eng Sci Technol 23(5):973–981
Polykretis C, Grillakis MG, Alexakis DD (2020) Exploring the impact of various spectral indices on land cover change detection using change vector analysis: a case study of Crete Island, Greece. Remote Sens 12(2):319
Rimal B, Rijal S, Kunwar R (2020) Comparing support vector machines and maximum likelihood classifiers for map** of urbanization. J Indian Soc Remote Sens 48:71–79. https://doi.org/10.1007/s12524-019-01056-9
Saha S, Bovolo F, Bruzzone L (2021) Building change detection in VHR SAR images via unsupervised deep transcoding. IEEE Trans Geosci Remote Sens 59(3):1917–1929
Sarabhai V (1969) Indian Space Research Organisation (Department of Space, Indian Space Research Organisation). Retrieved 26 Jul 2021. https://www.isro.gov.in/
Schwartz C, Ramos LP, Duarte LT, Pinho MD, Pettersson MI (2020) Change detection in UWB SAR images based on robust principal component analysis. Remote Sens 12(12):1–11
Seydi ST, Hasanlou M, Amani M (2020) A new end-to-end multi-dimensional CNN framework for land cover/land use change detection in multi-source remote sensing datasets. Remote Sens 12(12):1–38
Shi W, Zhang M, Zhang R, Chen S, Zhan Z (2020) Change detection based on artificial intelligence: state-of-the-art and challenges. Remote Sens 12(10):1688
Shukla K, Kumar P, Mann S, G., & Khare, M. (2020) Map** spatial distribution of particulate matter using kriging and inverse distance weighting at supersites of megacity Delhi. Sustain Cities Soc 54:101997. https://doi.org/10.1016/j.scs.2019.101997
Sierra Nevada Corporation (1963) Dream, innovate, inspire (Sierra Nevada Corporation). Retrieved 26 Jul 2021. https://www.sncorp.com/
Singh US, Singh RK (2020) Application of maximum-likelihood classification for segregation between Arctic multi-year ice and first-year ice using SCATSAT-1 data. Remote Sens Appl: Soc Environ 18:100310. https://doi.org/10.1016/j.rsase.2020.100310
Soni PK, Rajpal N, Mehta R, Mishra VK (2021) Urban land cover and land use classification using multispectral Sentinal-2 imagery. Multimed Tools Appl 1211:1–15. https://doi.org/10.1007/s11042-021-10991-0
Sotin C, Kalousová K, Tobie G (2021) Titan’s interior structure and dynamics after the Cassini-Huygens mission. Annu Rev Earth Planet Sci 49:579–607. https://doi.org/10.1146/annurev-earth-072920-052847
Thompson DW (1982) Surviving Space (Orbital Sciences Corporation). Retrieved 26 Jul 2021. https://www.northropgrumman.com/
Tiwari A, Arun G, Vishwakarma BD (2021) Parameter importance assessment improves the efficacy of machine learning methods for predicting snow avalanche sites in Leh-Manali Highway, India. Sci Total Environ 794:148738. https://doi.org/10.1016/j.scitotenv.2021.148738
Tomsick JA, Coughenour BM, Hare J, Krivonos R, Bodaghee A (2021) Using Chandra localizations and Gaia distances and proper motions to classify hard X-ray sources discovered by INTEGRAL. Astrophys J 914(48):1–17
Tong X, Feng Y (2020) A review of assessment methods for cellular automata models of land-use change and urban growth. Int J Geogr Inf Sci 34:866–898. https://doi.org/10.1080/13658816.2019.1684499
Venugopal N (2020) Automatic semantic segmentation with DeepLab dilated learning network for change detection in remote sensing images. Neural Process Lett 51:2355–2377. https://doi.org/10.1007/s11063-019-10174-x
Wang L, Shen Y, Li M, Chuang H, Ye Y, Zhao H, Wang H (2020a) Clinical manifestations and evidence of neurological involvement in 2019 novel coronavirus SARS-CoV-2: a systematic review and meta-analysis. J Neurol 267:2777–2789. https://doi.org/10.1007/s00415-020-09974-2
Wang M, Tan K, Jia X, Wang X, Chen Y (2020b) A deep Siamese network with hybrid convolutional feature extraction module for change detection based on multi-sensor remote sensing images. Remote Sens 12(2):1–18
Wang SW, Gebru BM, Lamchin M, Kayastha RB, Lee W-K (2020c) Land use and land cover change detection and prediction in the Kathmandu District of Nepal using remote sensing and GIS. Sustainability 12(9):3925
Wang M, Huang Z, Zhang X, Zhang Y, Chen M (2021) Altered mineral map** based on ground-airborne hyperspectral data and wavelet spectral angle mapper tri-training model: case studies from Dehua-Youxi-Yongtai Ore District, Central Fujian, China. Int J Appl Earth Obs Geoinf 102:102409. https://doi.org/10.1016/j.jag.2021.102409
Woodcock CE, Loveland TR, Herold M, Bauer ME (2020) Transitioning from change detection to monitoring with remote sensing: a paradigm shift. Remote Sens Environ 238:111558. https://doi.org/10.1016/j.rse.2019.111558
Wörner J-D (1975) European Robotic Arm is launched into space (European Space Agency). Retrieved 26 July 2021. https://www.esa.int/
Xu H, Yan C, Fu Q, **ao K, Yu Y, Han D, Wang W (2020) Possible environmental effects on the spread of COVID-19 in China. Sci Total Environ 731:139211. https://doi.org/10.1016/j.scitotenv.2020.139211
Yamakawa H (2003) Japan Aerospace Exploration Agency (JAXA). Retrieved 26 Jul 2021. https://global.jaxa.jp/
Zhang Y, Peng D, Huang X (2018) Object-based change detection for VHR images based on multiscale uncertainty analysis. IEEE Geosci Remote Sens Lett 15(1):13–17
Zhang C, Yue P, Tapete D, Jiang L, Shangguan B (2020) A deeply supervised image fusion network for change detection in high resolution bi-temporal remote sensing images. ISPRS J Photogramm Remote Sens 166:183–200. https://doi.org/10.1016/j.isprsjprs.2020.06.003
Zhao R, Peng G-H, Yan W-D, Pan L-L, Wang L-Y (2021) Change detection in SAR images based on superpixel segmentation and image regression. Earth Sci Inf 14:69–79. https://doi.org/10.1007/s12145-020-00532-y
Zhu Y, Jia Z, Yang J, Kasabov NK (2020) Change detection in multitemporal monitoring images under low illumination. IEEE Access 8:126700–126712. https://doi.org/10.1109/ACCESS.2020.3008262
Acknowledgements
The authors are thankful to all anonymous reviewers and Editor-in-Chief for their comments, concerns, queries, and constructive suggestions. The authors are also grateful to “Planet.” for the panchromatic Skysat pre- and post-COVID imagery used in this research work.
Author information
Authors and Affiliations
Corresponding author
Additional information
Publisher's Note
Springer Nature remains neutral with regard to jurisdictional claims in published maps and institutional affiliations.
Rights and permissions
About this article

Cite this article
Shakya, A.K., Ramola, A. & Vidyarthi, A. Modeling of texture quantification and image classification for change prediction due to COVID lockdown using Skysat and Planetscope imagery. Model. Earth Syst. Environ. 8, 2767–2792 (2022). https://doi.org/10.1007/s40808-021-01258-6
Received:
Accepted:
Published:
Issue Date:
DOI: https://doi.org/10.1007/s40808-021-01258-6