Search
Search Results
-
cytoviewer: an R/Bioconductor package for interactive visualization and exploration of highly multiplexed imaging data
BackgroundHighly multiplexed imaging enables single-cell-resolved detection of numerous biological molecules in their spatial tissue context....

-
CellTrackVis: interactive browser-based visualization for analyzing cell trajectories and lineages
BackgroundAutomatic cell tracking methods enable practitioners to analyze cell behaviors efficiently. Notwithstanding the continuous development of...

-
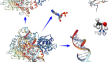
PDBms—An online tool for PDB file splitting and interactive molecular visualization
The rapid growth of biological databases has resulted in the vast development of many state-of-the-art molecular analysis tools for accurate disease...
-

-
LACE 2.0: an interactive R tool for the inference and visualization of longitudinal cancer evolution
BackgroundLongitudinal single-cell sequencing experiments of patient-derived models are increasingly employed to investigate cancer evolution. In...

-
ChromoMap: an R package for interactive visualization of multi-omics data and annotation of chromosomes
BackgroundThe recent advancements in high-throughput sequencing have resulted in the availability of annotated genomes, as well as of multi-omics...

-
Biocaiv: an integrative webserver for motif-based clustering analysis and interactive visualization of biological networks
BackgroundAs an important task in bioinformatics, clustering analysis plays a critical role in understanding the functional mechanisms of many...

-
CircNetVis: an interactive web application for visualizing interaction networks of circular RNAs
Analyzing the interactions of circular RNAs (circRNAs) is a crucial step in understanding their functional impacts. While there are numerous...
-
OmicNavigator: open-source software for the exploration, visualization, and archival of omic studies
BackgroundThe results of high-throughput biology (‘omic’) experiments provide insight into biological mechanisms but can be challenging to explore,...

-
Simple but powerful interactive data analysis in R with R/LinekdCharts
In research involving data-rich assays, exploratory data analysis is a crucial step. Typically, this involves jum** back and forth between...

-
Slideflow: deep learning for digital histopathology with real-time whole-slide visualization
Deep learning methods have emerged as powerful tools for analyzing histopathological images, but current methods are often specialized for specific...

-
PSReliP: an integrated pipeline for analysis and visualization of population structure and relatedness based on genome-wide genetic variant data
BackgroundPopulation structure and cryptic relatedness between individuals (samples) are two major factors affecting false positives in genome-wide...

-
Mouse phenome database: curated data repository with interactive multi-population and multi-trait analyses
The Mouse Phenome Database continues to serve as a curated repository and analysis suite for measured attributes of members of diverse mouse...

-
Transomics2cytoscape: an automated software for interpretable 2.5-dimensional visualization of trans-omic networks
Biochemical network visualization is one of the essential technologies for mechanistic interpretation of omics data. In particular, recent advances...

-
USAT: a bioinformatic toolkit to facilitate interpretation and comparative visualization of tandem repeat sequences
BackgroundTandem repeats (TR), highly variable genomic variants, are widely used in individual identification, disease diagnostics, and evolutionary...

-
AMRViz enables seamless genomics analysis and visualization of antimicrobial resistance
We have developed AMRViz, a toolkit for analyzing, visualizing, and managing bacterial genomics samples. The toolkit is bundled with the current best...

-
iDVS: interactive 2D and 3D visualizations of proximal sensor data for rapid characterization of soil profiles
Knowledge of the soil’s physical and chemical properties in field-scale geographical areas is crucial for farmers and policymakers for agronomic...

-
scRNASequest: an ecosystem of scRNA-seq analysis, visualization, and publishing
BackgroundSingle-cell RNA sequencing is a state-of-the-art technology to understand gene expression in complex tissues. With the growing amount of...

-
Modular segmentation, spatial analysis and visualization of volume electron microscopy datasets
Volume electron microscopy is the method of choice for the in situ interrogation of cellular ultrastructure at the nanometer scale, and with the...
-
Metagenomics Data Visualization Using R
Communicating key finds is a crucial part of the research process. Data visualization is the field of graphically representing data to help...