Search
Search Results
-
Pie Charts and Donut Charts
Pie charts don’t need an introduction. Everybody already knows them. They are very, very popular. You see them often, even in the media. They are...
-
Creating Charts
Apps need to display information to users. Whether that information might be text or numbers, large amounts of data can be difficult to understand....
-
Bar Charts, Butterfly Charts, Waterfall Charts, Dot Plots, Needle Plots, Area Bar Charts, Text Graphs, and Line Charts: Charts for Categorical Data
Bar charts and their functional equivalents are used for categorical data. The data of an enterprise, organization, government, or researcher has...
-
Understanding transitions in animated bar charts
Animated bar charts have gained popularity on the Internet for their ability to display historical rankings through smooth animated transitions that...

-
Exploring inbetween charts with trajectory-guided sliders for cutout animation
We introduce an interactive tool to intuitively make inbetween charts for cutout character movements (i.e., transitioning from one image to another),...

-
Perceptually congruent sonification of auditory line charts
In recent years, there has been increasingly more discussion about sonification design, evaluation strategies, and the future of sonification in...

-
Bar Charts
Chapter 6 explored using time series charts to look at defect data over time, and this chapter looks at bar...
-
Formatting Charts
Now that you have mastered Power BI’s core charting capabilities, it is time to move on and learn how to tweak your charts to the greatest effect....
-
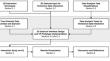
BarChartAnalyzer: Data Extraction and Summarization of Bar Charts from Images
Charts or scientific plots are widely used visualizations for efficient knowledge dissemination from datasets. However, these charts are...

-
Beta regression residuals-based control charts with different link functions: an application to the thermal power plants data
In industries, quality monitoring tools are necessary for producing good quality products. Control charts are the most important tools for monitoring...

-
Generalization of Fine Granular Extractions from Charts
Current approaches for high precision fine-grained visual extractions from charts are highly data intensive requiring thousands of annotated samples....
-
Templates and Nested Charts
In this chapter, we move away from designing charts and visuals and instead look at two aspects of managing the visualizations you’ve learned to...
-
Effect of attention and triplet loss on chart classification: a study on noisy charts and confusing chart pairs
Charts are powerful tools for visualizing and comparing data. With the increase in the presence of various chart types in scientific documents in...

-
Visual Patterns in an Interactive App for Analysis Based on Control Charts and SHAP Values
The aim of this paper is to describe the tool for combining the information of control charts, widely used for statistical quality control with the...
-
Understanding Charts
In this chapter, you will learn:
-
Designing a 3D gestural interface to support user interaction with time-oriented data as immersive 3D radar charts
The design of intuitive three-dimensional user interfaces is vital for interaction in virtual reality, allowing to effectively close the loop between...
-
Using Frequencies and Percentages to Create Stories from Charts
Charts should tell a visual story of the imperative aspects of a company’s business questions including what the results and conclusions are and how...
-
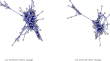
Online monitoring of dynamic networks using flexible multivariate control charts
Change-point detection in dynamic networks is a challenging task which is particularly due to the complex nature of temporal graphs. Existing...
-
Distributional Semantics of Line Charts for Trend Classification
Line charts are often used to convey high level information about time series data. Unfortunately, these charts are not always described in text, and...
-
Enhancing the detection ability of control charts in profile monitoring by adding RBF ensemble model
While numerous contributions and applications have been extended in profile monitoring, little attention has been paid to employing machine learning...
