Abstract
ELISPOT and FluoroSpot assays, collectively called ImmunoSpot assays, permit to reliable detection of rare antigen-specific T cells in freshly isolated cell material, such as peripheral blood mononuclear cells (PBMC). Establishing their frequency within all PBMC permits to assess the magnitude of antigen-specific T-cell immunity; the simultaneous measurement of their cytokine signatures reveals these T-cells’ lineage and effector functions, that is, the quality of T-cell-mediated immunity. Because of their unparalleled sensitivity, ease of implementation, robustness, and frugality in PBMC utilization, T-cell ImmunoSpot assays are increasingly becoming part of the standard immune monitoring repertoire. For regulated workflows, stringent audit trails of the data generated are a requirement. While this has been fully accomplished for the analysis of T-cell ImmunoSpot assay results, such are missing for the wet laboratory implementation of the actual test performed. Here we introduce a solution for enhancing and verifying the error-free implementation of T-cell ImmunoSpot assays.
You have full access to this open access chapter, Download protocol PDF
Key words
1 Introduction
ELISPOT and FluoroSpot assays both visualize secretory footprints of individual cells [1]. The two test systems differ only at the level of the visualization of the plate-bound analyte: in the former, the detection antibody is coupled to an enzyme that catalyzes the generation of a precipitating substrate detectable under white light; in the case of the latter, the plate-bound analyte is visualized using fluorescence-tagged detection antibodies. ELISPOT is suited for single- and dual-color analysis [2], while the unambiguous measurement of more than 2 analytes requires FluoroSpot tests using fluorochromes with nonoverlap** spectra [3]. As otherwise the two assays are identical, we refer to both collectively as ImmunoSpot®.
ImmunoSpot® assays have found wide use in the field of T-cell immune monitoring. This is due to the unprecedentedly high sensitivity of the test system to detect antigen-specific T cells (which, with rare exceptions, always occur in very low frequency) in PBMC and other freshly isolated cell material [4]. The assay’s success is further based on its economy in cell utilization (see Note 1), its performance is unaffected when cryopreserved PBMC samples are tested [5], and last but not least, the simplicity and robustness of the ImmunoSpot® assay [6, 7] resulting in its suitability for regulatory validation in clinical trials [8].
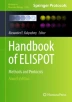
The economy of PBMC utilization, along with ImmunoSpot®‘s high-throughput capability, enables batch testing of dozens, and even hundreds, of subjects’ PBMC for T-cell reactivity to hundreds of individual antigens/peptides per donor [9]. Such is essential, for example, for high-resolution CD8+ T-cell immune monitoring. As epitope/peptide recognition by CD8+ T cells is highly variable and unpredictable (“aleatory”) among outbred individuals [10, 20, 21], only the testing of extensive peptide libraries is suited for the comprehensive assessment of the magnitude and fine-specificity of the antigen-specific CD8+ T-cell repertoire in individuals. There is a substantial danger of human error, however, when complex tests are performed involving the pipetting of the PBMC of numerous donors and many antigens. To overcome this problem, we have introduced neutral “regent tracker” dyes [11] that can assist in the visual verification of whether (a) the right antigen has been plated into the right well, and (b) whether the right amount/volume of antigen has been plated (c) and whether the cells have been added (d) in the right numbers/volume. A typical 96-well plate with Reagent-Tracker®-marked antigens is shown in Fig. 1 (see Note 2). In this chapter, we introduce a software tool, the Reagent Tracker (RT) Software™, which permits to verify the accuracy of ImmunoSpot® assay implementation via automated image analysis while also providing tamper-proof audit trails (see Note 3).

Color-code verification of pipetting accuracy. (a) Standard 96-well T-cell ImmunoSpot® plate is shown, without Reagent Tracker™ dyes, after plating 100 μL of antigen and the PBMC in 100 μL per well, both in medium containing phenol red. As all wells look alike, it is not possible to verify the accuracy of plating. (b) ImmunoSpot® plate after plating color-coded antigens using medium that has not been supplemented with phenol red, in 100 μL. In the example shown, eight Reagent Tracker™ dyes were used to color-code the antigens; each antigen was plated in duplicate wells underneath each other. (c) The plate shown in B after the addition of the PBMC in 100 μL medium containing phenol red
Figure 2a shows that Reagent Tracker® dyes can be readily distinguished by image analysis in the 3D color space: the color of each dye can be represented as a tight cluster of RGB coordinates. This permits the RT Software™ to unambiguously verify that the color actually present in a well indeed matches the color (antigen/peptide) that was intended to be present in that well. Deviations from these color coordinates indicate impurities, e.g., resulting from spilling of antigen, and are automatically identified by the software as such. Optical densities of these defined colors reflect on the volume plated per well, and as such permit to identify quantitative antigen pipetting errors. The RT Software™ also automatically assesses whether such deviations from the planned volumes have occurred, permitting to flag deviant wells.

Definition of Reagent Tracker™ dyes in RGB space. (a) The plate shown in Fig. 1b was scanned on an ImmunoSpot® Reader, and the wells containing the eight RT dyes were each defined in the red–green–blue color space. The axes are shown in the respective colors. (b) The plate shown in Fig. 1c was scanned and the color space was defined as above. Note the marked shift of the RGB coordinates for each color after adding the cells in phenol red-containing medium
As can be seen in Figs. 1b vs. 1c, and 2a vs. 2b, the addition of the PBMC in phenol red-containing medium causes a marked color shift of the RT dyes. Such shifts are assessed by the RT Software, permitting to automatically verify that the cells had indeed been added to each well, and that the planned numbers (volume) were added.
The Reagent Tracker® Software guides the actual implementation of the Reagent Tracker™ strategy for T-cell ImmunoSpot® testing. As the first step, using this software’s planning module, the plate layout is defined, assigning to each well the antigens/peptide to be tested in it, as well as the PBMC donors’ identity whose cells are to be interrogated, including the number of replicate wells for each test condition, if applicable (see Notes 5 and 6). Now the color coding follows: color combinations are to be selected that provide visually clearly discernible patterns on the plates, like that shown in Fig. 1b using 8 RT Dyes™ (see Note 7). The color-coded reagents are prepared and plated (see Note 8) according to the plan. Before adding the PBMC, the plates are scanned and analyzed via the RT Software™ to establish and document the accuracy of the antigen transfer (see Note 9). Now the PBMCs are added, followed by a renewed scan, testing for the color shift resulting from the addition of the cells in phenol red media (see Note 9). As before, reports and audit trails are generated to document in a tamper-proof manner the accuracy of the plating process. Once the actual ImmunoSpot® assay has been concluded, the spot forming units (SFUs) per well are automatically counted by the ImmunoSpot® Software [12, 13], means of replicate wells are calculated, positive responses are automatically identified via statistical calculations, the results are exported into a database for further analysis, and, if desired, for instant graphic representation of the results. Barcoding is used to assure plate identity, and orientation, during the entire course of the test.
The following provides technical details of performing RT-enhanced high-throughput T-cell-ImmunoSpot® assays. The protocol for loss-free cryopreservation and thawing of PBMC, and for the implementation of the basic T-cell assay, are provided elsewhere [14]. Dissolving antigens in RT Dyes™ and creating master plates for en bloc antigen transfers are also described in [14]. The automated evaluation of T-cell ImmunoSpot® assay results is described in [15, 16] (see Note 10).
2 Materials
-
1.
ePBMC® samples or test samples (freshly isolated or cryopreserved human PBMC).
-
2.
Precoated human IFN-γ 96-well ImmunoSpot® kit, enzymatic, or ELISPOT kit detecting any other analyte.
-
3.
50 mL conical tubes (polypropylene).
-
4.
CTL Anti-Aggregate™ medium.
-
5.
CTL-Test™ medium with phenol red.
-
6.
CTL Live/Dead™ Cell Counting Dye and disposable hemocytometers.
-
7.
Parafilm.
-
8.
70% ethanol
-
9.
CTL Live/Dead Cell Counting™ suite.
-
10.
Antigens/peptides of interest.
-
11.
CTL-Reagent Tracker (RT)™ 1.
-
12.
CTL-Reagent Tracker (RT)™ 2.
-
13.
CTL-Reagent Tracker (RT)™ 3.
-
14.
CTL-Reagent Tracker (RT)™ 4.
-
15.
Uncoated ELISPOT plate, 96 wells (for Reagent Tracker™ software calibration).
-
16.
PBS.
-
17.
0.05% Tween-PBS.
-
18.
Distilled water.
-
19.
CTL Reagent Tracker™ software, version 1.1.3.1 or higher.
-
20.
CTL ImmunoSpot® software.
-
21.
CTL ImmunoSpot® analyzer.
3 Methods
3.1 Plan Experiment and Assign Reagent Tracker™ Dyes to Color-Code Each Assay Condition for Verification of Pipetting Accuracy
-
1.
Open the CTL Reagent Tracker™ software.
-
2.
Select “New Experiment”.
-
3.
Click on “Add New Plate”.
-
4.
Enter the plate name.
-
5.
Select “Undefined Colors” from the Experiment template drop-down menu.
-
6.
Begin by assigning Reagent Tracker™ 1 to the first assay condition (negative control).
-
7.
The first peptide/antigen stimulation (condition 2) will be prepared with Reagent Tracker™ 2.
-
8.
The second peptide/antigen stimulation (condition 3) with Reagent Tracker™3, and so forth until all assay conditions have been assigned a color code. If more than four conditions are used, the fifth condition will be assigned Reagent Tracker™ 1 and the cycle will begin again, until all conditions and controls have been assigned a Reagent Tracker™ dye. The software will display the completed plate diagram, which serves as a guide for generation of the calibration plate.
3.2 Preparation of Reagent Tracker™ Calibration Plate for Calibration of the Software
-
1.
Following the plate diagram generated by the software, load 100 μL/well of the appropriate Reagent Tracker™ dye to each well of the calibration plate. For instance, if the negative control will be plated into wells A1 and A2 of the ELISPOT assay, add 100 μL of Reagent Tracker™ 1 dye to wells A1 and A2 of the calibration plate.
-
2.
Continue loading the appropriate dyes into the calibration plate, 100 μL/well, until all wells have been filled.
-
3.
Place the lid on the plate to preserve sterility during scanning.
3.3 Perform Reagent Tracker™ Calibration Scan to Generate Reference Data
-
1.
Click the eject button to eject the stage.
-
2.
Load the calibration plate onto the stage, and click the load button to load the plate into the analyzer.
-
3.
Click the scan button to perform a scan of the calibration plate.
-
4.
Click the options button to the right of the plate name. Select “Update Dye Map.” The software will now save the reference scan data and will display 96 green wells under the “Pipetting Result” heading, indicating the successful generation of the reference data.
3.4 Thawing of Cryopreserved PBMC Samples (Sterile Conditions)
Warm all media to 37 °C prior to use.
Perform all steps in a biological safety cabinet observing all applicable safety precautions.
-
1.
Check the ID of the ePBMC® sample vials and place them into a bead (or water) bath at 37 °C for 8–10 min to thaw.
-
2.
Wipe the cryovials with 70% ethanol and transfer them to a rack in the biological safety cabinet.
-
3.
Invert the vials twice gently to resuspend the cells. Transfer the contents of a single donor’s sample into a labeled 50 mL conical tube. Up to 5 cryovials from a single donor can be pooled into one 50 mL conical tube.
-
4.
Rinse the cryovial with 1 mL prewarmed Anti-Aggregate™ thawing medium, and transfer slowly, dropwise into the 50 mL conical tube while gently swirling the tube to ensure adequate mixing.
-
5.
Add 2 mL Anti-Aggregate™ thawing medium to the conical tube dropwise while swirling gently to mix.
-
6.
Add the remaining 6 mL Anti-Aggregate™ medium to the conical tube to bring the volume up to 10 mL total (for each cryovial thawed, e.g., if thawing 2 vials per donor, the total volume should be 2 × 10 mL = 20 mL), cap, and invert gently to resuspend the PBMC.
-
7.
Repeat steps 3–6 for each donor sample to be tested, until all samples are resuspended in a warm thawing medium.
-
8.
Centrifuge samples at 300 × g for 10 min with max brake.
-
9.
Decant supernatant and flick the bottom of the tube gently to resuspend the pellet (do not vortex as this is detrimental to cell health).
-
10.
Resuspend the pellet in 10 mL Anti-Aggregate™ medium.
-
11.
Place a 20 μL aliquot of CTL Live/Dead™ dye onto a piece of parafilm for each sample to be counted.
-
12.
Remove 20 μL of PBMC suspension and add it to the droplet of CTL Live/Dead™ dye on the parafilm. Pipet up and down several times to mix.
-
13.
Transfer 20 μL of the mixture into each chamber of the disposable hemocytometer. Only 10 μL will be drawn into the chamber, and the remainder will pool in the reservoir on the side, to prevent evaporation during counting.
-
14.
Load the hemocytometers into the adapter tray and count the cells using CTL’s Live/Dead Cell Counting™ suite.
-
15.
Centrifuge samples at 300 × g for 10 min with max brake.
-
16.
Decant supernatant and flick the bottom of the tube gently to resuspend the cell pellet.
-
17.
Resuspend each sample to the desired cell concentration (e.g., 4 × 10⁶ PBMC/mL) in prewarmed CTL-Test™ medium containing phenol red.
-
18.
Place the samples into a 37 °C incubator with 5–9% CO2 with loosened caps to allow for gas exchange until ready to plate them into the assay.
3.5 Preparation of Antigens and First Verification of Pipetting Accuracy Using Reagent Tracker™ Dyes and Software (Sterile Conditions)
-
1.
Prepare antigens/peptides at 2× final concentration in Reagent Tracker dye. Utilize Reagent Tracker dyes such that no two consecutive peptides share the same dye color, following the plate diagram generated by the software.
-
2.
Plate 2× antigen solutions, 100 μL/well, into the precoated ELISPOT plate (Note: after the addition of the cell suspension, the final concentration will become 1×).
-
3.
Place the lid on the plate to preserve sterility and perform a scan of the precoated ELISPOT plate containing antigen solutions using the Reagent Tracker™ software and ImmunoSpot® analyzer to confirm correct concentration, volume, and dye color for each well. If all wells are within acceptable limits, the plate overview will show 96 green wells to signify accurate pipetting.
-
4.
Once the accuracy of antigen loading has been verified, proceed to the addition of PBMC samples.
3.6 Plating of PBMC into ELISPOT Assay and Second Verification of Pipetting Accuracy Using Reagent Tracker™ Dyes and Software (Sterile Conditions)
-
1.
Once the pipetting of the antigens has been confirmed to be correct, plate the cells in CTL-Test containing phenol red, 100 μL/well. This will cause all Reagent Tracker™ dye color profiles to shift slightly toward the red end of the spectrum, which can then be detected by the software.
-
2.
Place the lid on the plate and perform a Reagent Tracker™ scan to determine that the correct volume of cells has been added to each well. If all concentrations, volumes, and dye colors are correct, the plate overview will display 96 green wells to signify accurate pipetting.
-
3.
Tap the plate gently on all sides to ensure even distribution of the cells across the membrane, and incubate at 37 °C with 5–9% CO2 for 18–24 h following the kit protocol. Do not move plates during the incubation to avoid disruption of spot formation.
3.7 Development of the ELISPOT Assay (Nonsterile Conditions)
-
1.
Prepare detection solution according to the kit protocol, 10 mL per plate.
-
2.
Remove plate(s) from the incubator and decant.
-
3.
Wash plates 2× with PBS and 2× with 0.05% Tween-PBS, 200 μL per well.
-
4.
Add detection solution, 80 μL/well. Cover and protect from light. Incubate at room temperature (RT) for 2 h.
-
5.
Prepare tertiary solution according to the kit protocol, 10 mL per plate.
-
6.
Decant plates and wash 3× with 0.05% Tween-PBS, 200 μL/well.
-
7.
Add tertiary solution, 80 μL/well. Cover plates and protect from light. Incubate for 30 min at RT.
-
8.
Prepare substrate solution according to the kit protocol, 10 mL per plate.
-
9.
Decant plates and wash 2× with 0.05% Tween-PBS and 2× with distilled water, 200 μL/well.
-
10.
Add substrate solution, 80 μL/well. Cover plates and protect from light. Incubate for 10–15 min at RT.
-
11.
Decant substrate solution and remove underdrain. Rinse plates, front and back, with tap water.
-
12.
Dry plates completely prior to image acquisition and analysis.
-
13.
Scan dried plates on an ImmunoSpot® analyzer using appropriate excitation and emission channels to visualize the assay prior to data analysis.
4 Notes
-
1.
PBMCs are always limited with clinical samples. In the typical 96-well plate format, 100,000–one million PBMC are tested per well, assuring a cell density on the membrane that results in a linear relationship between PBMC numbers plated and antigen-induced SFUs. In 384-well format, the number of PBMCs needed can be reduced to one-third, permitting to test 30 wells with only one million PBMC [17] obtainable from 1 mL of blood.
-
2.
The likelihood of human error is even larger when manually pipetting 384-well plates.
-
3.
We have tested the biologic neutrality of Reagent Tracker dyes only in T-cell ELISPOT assays so far, but assume that this approach is also suited for other test systems involving complex pipetting patterns, which, however, would need to be verified for each additional test system. Reagent Tracker dyes are auto-fluorescent, however, which interferes with their use in FluoroSpot assays.
-
4.
Systematic studies, in which 50–150 μL of color-coded antigen was pipetted per well in 10 μL increments showed that volume deviations of ±20% can be verified via color intensity analysis.
-
5.
The number of replicates to be selected, as well as the choice of testing in 96- or 384-well plate format should be guided by the expected frequency of the antigen-specific T cells within the PBMC. As the ImmunoSpot® assay detects the cytokine footprint of individual antigen-triggered T cells, the Poisson distribution applies; it permits to select the PBMC numbers to be plated per well, the number of replicates, and the plate format [15].
-
6.
We recommend color coding with RT Dyes™ when many antigens/peptides are tested on PBMC from a high number of donors.
-
7.
While for machine reading, the selection of colorful plate design can be random as the colors are clearly discernable in RGB space (see Fig. 2), visually discernable, repetitive color patterns provide guidance during the actual plating of the antigens.
-
8.
When a high number of antigens are to be tested, we recommend preparing “antigen master plates” that follow the antigen layout of the planned test(s), and from which multichannel pipettors can transfer the antigens in the predefined sets [14].
-
9.
Using backlight, the plates can be scanned with the lid on to maintain sterility.
-
10.
The rules for ELISPOT and FluoroSpot analysis of T-cell assay results are similar, but the latter needs to also reliably define co-expression patterns by individual T cells for which simple overlays of centers of masses do not suffice, but that requires accounting for Stokes shifts and movement of the cells [18] in particular when the production of the analytes is asynchronous, being the case for most cytokines produced by T cells [19].
References
Hesse MD, Karulin AY, Boehm BO et al (2001) A T cell clone’s avidity is a function of Its activation state. J Immunol 167:1353–1361
Karulin AY, Hesse MD, Tary-Lehmann M et al (2000) Single-cytokine-producing CD4 memory cells predominate in type 1 and type 2 immunity. J Immunol 164:1862–1872
Megyesi Z, Lehmann PV, Karulin AY (2018) Multi-color FLUOROSPOT counting using ImmunoSpot® Fluoro-X Suite. Methods Molec Biol 1808:115–131
Helms T, Boehm BO, Asaad RJ et al (2000) Direct visualization of cytokine-producing recall antigen-specific CD4 memory T cells in healthy individuals and HIV patients. J Immunol 164:3723–3732
Kreher CR, Dittrich MT, Guerkov R et al (2003) CD4+ and CD8+ cells in cryopreserved human PBMC maintain full functionality in cytokine ELISPOT assays. J Immunol Methods 278:79–93
Sundararaman S, Karulin AY, Ansari T et al (2015) High reproducibility of ELISPOT counts from nine different laboratories. Cell 4:21–39
Zhang W, Caspell R, Karulin AY, et al., (2009) ELISPOT assays provide reproducible results among different laboratories for T-cell immune monitoring – even in hands of ELISPOT-inexperienced investigators. J Immunotoxicol 6:227–234
Tary-Lehmann M, Hamm CD, Lehmann PV (2008) In: Kelley eUPaM (ed) Validating reference samples for comparison in a regulated ELISPOT assay. Validation of Cell-Based Assays in the GLP Setting, pp 127–146. https://doi.org/10.1002/9780470987810.ch9
Lehmann PV, Suwansaard M, Zhang T et al (2019) Comprehensive evaluation of the expressed CD8+ T cell epitope space using high-throughput epitope map**. Front Immunol 10:655–668
Moldovan I, Targoni O, Zhang W et al (2016) How frequently are predicted peptides actually recognized by CD8 cells? Cancer Immunol Immunother 65:847–855
Lehmann A, Megyesi Z, Przybyla A et al (2018) Reagent tracker dyes permit quality control for verifying plating accuracy in ELISPOT tests. Cell 7:3–13
Karulin AY, Caspell R, Dittrich M et al (2015) Normal distribution of CD8+ T-cell-derived ELISPOT counts within replicates justifies the reliance on parametric statistics for identifying positive responses. Cell 4:96–111
Zhang W, Lehmann PV (2012) Objective, user-independent ELISPOT data analysis based on scientifically validated principles. Methods Molec Biology 792:155–171
Lehmann PV, Roen DR, Lehmann AA (2023) Unbiased, high-throughput identification of T cell epitopes by ELISPOT. Methods Molec Biology 2673:69–88
Dittrich M, Lehmann PV (2012) Statistical analysis of ELISPOT assays. Methods Molec Biol 792:173–183
Karulin AY, Karacsony K, Zhang W et al (2015) ELISPOTs produced by CD8 and CD4 cells follow log normal size distribution permitting objective counting. Cell 4:56–70
Hanson J, Sundararaman S, Caspell R et al (2015) ELISPOT assays in 384-well format: up to 30 data points with one million cells. Cell 4:71–83
Karulin AY, Megyesi Z, Caspell R et al (2018) Multiplexing T- and B-cell FLUOROSPOT assays: experimental validation of the multi-color ImmunoSpot® Software based on center of mass distance algorithm. Methods Molec Biol 1808:95–113
Duechting A, Przybyla A, Kuerten S et al (2017) Delayed activation kinetics of Th2- and Th17 cells compared to Th1 cells. Cell 6:29–34
Lehmann AA, Zhang T, Reche PA et al (2021) Discordance between the predicted vs. the actually recognized CD8+ T cell epitopes of HCMV pp65 antigen and aleatory epitope dominance. Front Immunol 11:Art. 618428
Lehmann AA, Lehmann PV (2020) Aleatory epitope recognition prevails in human T cell responses? Crit Rev Immunol 40:225–235
Acknowledgments
We wish to thank R&D and the Software Development teams at CTL for their continued support and technological innovation that made our Reagent Tracker Software development possible. All efforts were funded from CTL’s research budget.
Conflicts of Interest
P.V.L. is Founder, President, and CEO of CTL, a company that specializes in immune monitoring by ImmunoSpot®. A.A.L. is CTL’s COO. D.R.R. and Z.M. are employees of CTL.
Author information
Authors and Affiliations
Corresponding author
Editor information
Editors and Affiliations
Rights and permissions
Open Access This chapter is licensed under the terms of the Creative Commons Attribution 4.0 International License (http://creativecommons.org/licenses/by/4.0/), which permits use, sharing, adaptation, distribution and reproduction in any medium or format, as long as you give appropriate credit to the original author(s) and the source, provide a link to the Creative Commons license and indicate if changes were made.
The images or other third party material in this chapter are included in the chapter's Creative Commons license, unless indicated otherwise in a credit line to the material. If material is not included in the chapter's Creative Commons license and your intended use is not permitted by statutory regulation or exceeds the permitted use, you will need to obtain permission directly from the copyright holder.
Copyright information
© 2024 The Author(s)
About this protocol

Cite this protocol
Lehmann, A.A., Roen, D.R., Megyesi, Z., Lehmann, P.V. (2024). Reagent Tracker™ Platform Verifies and Provides Audit Trails for the Error-Free Implementation of T-Cell ImmunoSpot® Assays. In: Kalyuzhny, A.E. (eds) Handbook of ELISPOT . Methods in Molecular Biology, vol 2768. Humana, New York, NY. https://doi.org/10.1007/978-1-0716-3690-9_7
Download citation
DOI: https://doi.org/10.1007/978-1-0716-3690-9_7
Published:
Publisher Name: Humana, New York, NY
Print ISBN: 978-1-0716-3689-3
Online ISBN: 978-1-0716-3690-9
eBook Packages: Springer Protocols