
Abstract
Background
Zinc ferrite nanoparticles (NPs) have shown potential to be used in biomedical field such as magnetic resonance imaging and hyperthermia. However, there is limited information concerning the biological response of zinc ferrite NPs. This study was designed to evaluate the cytotoxicity of zinc ferrite NPs in three widely used in vitro cell culture models: human lung epithelial (A549), skin epithelial (A431) and liver (HepG2) cells. Zinc ferrite NPs were characterized by electron microscopy and dynamic light scattering. Cell viability, cell membrane damage, reactive oxygen species (ROS), glutathione (GSH), mitochondrial membrane potential (MMP), transcriptional level of apoptotic genes were determined in zinc ferrite NPs exposed cells.
Results
Zinc ferrite NPs were almost spherical shaped with an average size of 44 nm. Zinc ferrite NPs induced dose-dependent cytotoxicity (MTT and LDH) and oxidative stress (ROS and GSH) in all three types of cells in the dosage range of 10–40 µg/ml. Transcriptional level of tumor suppressor gene p53 and apoptotic genes (bax, caspase-3 and caspase-9) were up-regulated while the anti-apoptotic gene bcl-2 was down-regulated in cells after zinc ferrite NPs exposure. Furthermore, higher activity of caspase-3 and caspase-9 enzymes was also observed in zinc ferrite NPs treated cells. ROS generation, MMP loss and cell death in all three types of cells were abrogated by N-acetyl cysteine (ROS scavenger), which suggests that oxidative stress might be one of the plausible mechanisms of zinc ferrite NPs cytotoxicity. It is worth mentioning that there was marginally difference in the sensitivity of three cell lines against zinc ferrite NPs exposure. Cytotoxicity of zinc ferrite NPs were in following order; A549 > HepG2 > A431.
Conclusion
Altogether, zinc ferrite NPs induced cytotoxicity and oxidative stress in A549, A431 and HepG2 cells, which is likely to be mediated through ROS generation. This study warrants further investigation to explore the potential mechanisms of toxicity of zinc ferrite NPs in normal cells as well as in animal models.
Background
Magnetic nanoparticles (NPs) hold great promise in biomedical applications including hyperthermia, biosensor, magnetic resonance imaging (MRI) and drug delivery [1–3]. Over the years, magnetite (Fe3O4) was the most studied magnetic NPs. In the last decade, it became easier to develop new and more effective types of magnetic NPs [4]. Spinel ferrite NPs with the general formula MFe2O4 (where M is A is divalent cation of Zn, Ni, Mn, Mg or Co) are very important materials because of their interesting magnetic and electrical properties with good chemical and thermal stabilities [5]. However, their biomedical application may ultimately be limited, because of the limited knowledge on biological response of these NPs [6, 7]. Therefore, it is necessary to explore the biological fate and possible toxic response of magnetic NPs for their successful implications in biomedical field.
Zinc ferrite (ZnFe2O4) NPs, a lesser investigated class of spinel ferrites, frequently utilized as a contrasting agent in MRI and spintronics devices [8]. Despite the potential application of zinc ferrite NPs, there is a serious lack of information concerning the toxicity of this material both at in vitro and in vivo level. Some significant studies demonstrated the toxic effects of zinc ferrite NPs. Recently, Saquib et al. [9] suggested that zinc ferrite NPs trigger apoptosis and/or necrosis in human amnion epithelial (WISH) cells through mitochondria dependent intrinsic apoptotic pathway. Zinc ferrite NPs have also been reported to induce chromosomal aberration in the meristematic root cells of sunflower [10].
Toxicological investigations using animal models are both expensive and time taking. Therefore, a search for suitable alternative in vitro models to precisely predict the in vivo toxicity is indispensable. Human cell lines have been shown to be good in vitro models and sensitive tools for high-throughput toxicity screening and have the potential to reduce the use of animals in toxicity studies. Cell lines can be utilized for the generation of mechanistic data that could potentially be used for toxicity assessments. Therefore, we have chosen three widely used in vitro cell culture models; human lung epithelial (A549), skin epithelial (A431) and liver (HepG2) cells as tools to explore the cytotoxicity of zinc ferrite NPs.
Exposure to NPs could occur through the air, skin, food and the use of medical devices [11]. The respiratory tract and skin represents the main route of NPs exposure for workers employed in the manufacturing and handling. The NPs have high possibility to deposit in the respiratory system and can retain in the lungs for a long time where they provoke oxidative stress and an inflammatory burden with respect to their fine-sized equivalents [12, 13]. On the other hand, liver is a primary site of NPs accumulation after they get entry to circulatory system [14]. Studies suggest that NPs get absorbed as they pass through the gastrointestinal tract and distributed different vital organs including liver via the circulatory system [Glutathione assay Intracellular glutathione (GSH) content was estimated utilizing Ellman’s method [32]. In brief, a mixture of 0.1 ml of crude cell extract and 0.9 ml of 5 % TCA was centrifuged at 2300g for 15 min. After that 0.5 ml of the supernatant was added into 1.5 ml of 0.01 % DTNB and the reaction was monitored at 412 nm. The content of GSH was presented in terms of nmole/mg protein. Mitochondrial membrane potential (MMP) was estimated using the method of Zhang et al. [33] with few changes [34]. Briefly, cells (5 × 10⁴ cells/well) were exposed to different concentrations (10–40 µg/ml) of zinc ferrite NPs for 24 h. After the completion of exposure time, cells were harvested and washed twice with PBS. Then, cells were treated with 10 µg/ml of Rh-123 fluorescent dye for 1 h at 37 °C in dark. Furthermore, cells were washed twice with PBS then the fluorescence intensity of Rh-123 dye was determined using upright fluorescence microscope (OLYMPUS CKX 41) by grabbing the images at 20× magnification. A parallel set of cells (1 × 10⁴ cells/well) in 96-well plate were analyzed for quantification of Rh-123 using the microplate reader (Synergy-HT, BioTek, USA). Cells were cultured in 6-well plates and treated with zinc ferrite NPs at a dosage of 20 μg/ml for 24 h. After the completion of exposure time, total RNA was extracted by Qiagen RNeasy mini Kit (Valencia, CA, USA) according to the manufacturer’s protocol. The RNA content was estimated using Nanodrop 8000 spectrophotometer (Thermo-Scientific, Wilmington, DE, USA), and the integrity of RNA was visualized on a 1 % agarose gel using the gel documentation system (Universal Hood II, BioRad, Hercules, CA, USA). The first strand of cDNA was synthesized from 1 μg of total RNA by the reverse transcriptase using M-MLV (Promega, Madison, WI, USA) and oligo (dT) primers (Promega) according to the manufacturer’s instructions. Quantitative real-time PCR was performed by QuantiTect SYBR Green PCR kit (Qiagen) using the ABI PRISM 7900HT Sequence Detection System (Applied Biosystems, Foster City, CA, USA). Two microliters of template cDNA was added to the final volume of 20 μl of reaction mixture. Real-time PCR cycle parameters included 10 min at 95 °C followed by 40 cycles involving denaturation at 95 °C for 15 s, annealing at 60 °C for 20 s, and elongation at 72 °C for 20 s. The sequences of the specific sets of primer for p53, bax, bcl-2, caspase-3, caspase-9 and β-actin utilized in the present investigation are given in our previous study [25]. Expressions of selected genes were normalized to the β-actin gene, which was used as controls. Caspase-3 and caspase-9 enzymes activity was evaluated in exposed and control cells using Bio-Vision colorimetric assay kits. Preparation of cell extract is reported above. This assay is based on the principle that activated caspases in apoptotic cells cleave the synthetic substrates to release free chromophore p-nitroanilide (pNA), which is measured at 405 nm. The pNA was generated after specific action of caspase-3 and caspase-9 on tertrapeptide substrates DEVD-pNA and LEHD-pNA, respectively [25, 35]. In brief, reaction mixture consisted of 50 µl of cell extract protein (as prepared above), 50 µl of 2× reaction buffer (containing 10 mM dithiothreitol) and 5 µl of 4 mM DEVD-pNA (for caspase-3) or LEHD-pNA (for caspase-9) substrate in a total volume of 105 µl. The reaction mixture was incubated at 37 °C for 1 h and absorbance of the final product was estimated utilizing the microplate reader (Synergy-HT, BioTek, USA) at 405 nm according to kit’s instruction. Protein content was estimated by the Bradford method [36] using bovine serum albumin as the standard. Statistical significance was measured by one-way analysis of variance followed by Dunnett’s multiple comparison tests. Significance was ascribed at p < 0.05.Mitochondrial membrane potential assay
Quantitative assay of apoptotic genes by real-time PCR
Determination of caspase-3 and caspase-9 enzymes activity
Protein assay
Statistical analysis
Results
Zinc ferrite nanoparticle characterization
Techniques such as FETEM, FESEM and DLS was used to characterize the zinc ferrite NPs. FESEM image depicts the surface morphology zinc ferrite NPs (Fig. 1a). Figure 1b shows the typical TEM image of zinc ferrite NPs. As we can see in Fig. 1c the high resolution TEM indicated the crystalline behavior of zinc ferrite NPs. TEM and SEM images have shown that particles were almost spherical with smooth surfaces. The average size of NPs was calculated from estimating over 120 particles in random fields of TEM view. The average size of zinc NPs was approximately 44.3 nm. Figure 1d shows the size distribution frequency of zinc ferrite NPs.

Electron microscopy characterization of zinc ferrite NPs. a FESEM image, b FETEM image, c FETEM image with high resolution and d frequency of particle size distribution
Characterization of zinc ferrite NPs in aqueous state by DLS technique is given in Table 1. Secondary particle size (hydrodynamic size) of zinc ferrite NPs in de-ionized water and cell culture medium was 312 and 289 nm, respectively. Further, zeta-potential of zinc ferrite NPs in water and culture medium was −18 and −23 mV, respectively.
Zinc ferrite nanoparticles reduced the cell viability
A431, A549 and HepG2 cells were treated with zinc ferrite NPs (10–40 µg/ml) for 24 h and cell viability was determined by MTT assay. Results have shown that zinc ferrite NPs significantly decreased the viability of all three types of cells in a dose-dependent manner. We also observed that zinc ferrite NPs induced cytotoxicity in following order A549 cells > HepG2 cells > A431 cells. Cell viability was decreased to 81, 63 and 38 % for A431 and 74, 57 and 31 % for HepG2, while 67, 48 and 25 % for A549 cells, at the concentrations of 10, 20, and 40 µg/ml, respectively (p < 0.05 for each) (Fig. 2).

Zinc ferrite NPs reduced the viability of A431, HepG2 and A549 cells. Data represented are mean ± SD of three identical experiments made in three replicate. *Significant difference as compared to the controls (p < 0.05 for each)
Zinc ferrite nanoparticle-induced membrane damage
LDH is an enzyme widely found in the cytosol that converts lactate to pyruvate. When the integrity of plasma membrane is disrupted, LDH leaks into media and its extracellular content increases depending upon the extent of NPs cytotoxicity. Therefore, higher level of LDH in culture medium indicates higher cytotoxic response of NPs. We also observed that zinc ferrite NPs induced LDH leakage dose-dependently in all three types of cells (Fig. 3). Effects of zinc ferrite NPs on A549 cells was higher than those of HepG2 and A431 cells. LDH leakage in A431 cells was increased to 119, 130 and 143 %, and 125, 149 and 163 % for HepG2, while 129, 155 and 172 % were A549 cells for the dosages of 10, 20 and 40 µg/ml, respectively (p < 0.05 for each) (Fig. 3).

Zinc ferrite NPs induced membrane damage in A431, HepG2 and A549 cells. Data represented are mean ± SD of three identical experiments made in three replicate. *Significant difference as compared to the controls (p < 0.05 for each)
Zinc ferrite nanoparticle-induced reactive oxygen species generation
ROS generation has been suggested to be involved in several cellular events including inflammation, senescence mutation, DNA damage and apoptosis. We evaluated the potential of zinc NPs to induce intracellular ROS generation in A431, HepG2 and A549 cells. Quantitative results indicated that zinc ferrite NPs induced ROS generation dose-dependently in all three types of cells (p < 0.05 for each) (Fig. 4a). Fluorescent microscopy results also suggested that zinc ferrite NPs treated cells show higher intensity of green fluoresce of DCF dye (ROS generation marker) than those of the control cells (Fig. 4b).

Zinc ferrite NPs induced ROS generation in A431, HepG2 and A549 cells. a Percentage change in ROS generation in all three cells after zinc ferrite NPs exposure at the concentrations of 0, 10, 20 and 40 µg/ml for 24 h. b Representative microphotographs showing ROS generation in A431, HepG2 and A549 cells after zinc ferrite NPs exposure at a concentration of 20 µg/ml for 24 h. Images were captured with a fluorescence microscope (OLYMPUS CKX 41). Data represented are mean ± SD of three identical experiments made in three replicate. *Significant difference as compared to the controls (p < 0.05 for each)
Zinc ferrite nanoparticle-reduced glutathione level
Antioxidant GSH depletion and changes in the activity of various antioxidant enzymes indicative of lipid peroxidation have been implicated in oxidative damage of cellular macromolecules [37]. Therefore, we further examined the GSH level in A431, HepG2 and A549 cells exposed to zinc ferrite NPs at the concentrations of 10, 20 and 40 µg/ml for 24 h. Results showed that zinc ferrite NPs reduced the level of GSH in all three types of cell in a dose-dependent manner (Fig. 5).

Zinc ferrite NPs induced GSH depletion in A431, HepG2 and A549 cells. Data represented are mean ± SD of three identical experiments made in three replicate. *Significant difference as compared to the controls (p < 0.05 for each)
Zinc ferrite nanoparticle-reduced mitochondrial membrane potential
Earlier studies have shown that MMP loss during the process of apoptosis [23]. We studied the effect of zinc ferrite NPs on MMP in A431, HepG2 and A549 cells. Quantitative data showed that zinc ferrite NPs induced MMP loss in a dose-dependent manner in all three types of cells (p < 0.05 for each) (Fig. 6a). Fluorescence microscopy results were also according to the quantitative data. The brightness of the fluorescent intensity was decreased in cells treated with zinc ferrite NPs that shows a significant loss MMP (Fig. 6b).
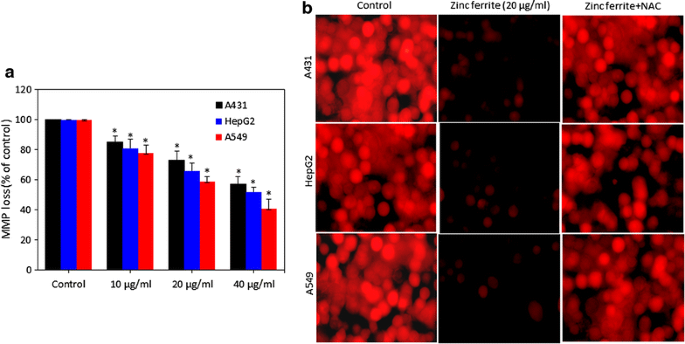
Zinc ferrite NPs induced MMP loss in A431, HepG2 and A549 cells. a Percentage change in MMP in all three cells after zinc ferrite NPs exposure at the concentrations of 0, 10, 20 and 40 µg/ml for 24 h. b Representative microphotographs showing MMP loss in A431, HepG2 and A549 cells after zinc ferrite NPs exposure at a concentration of 20 µg/ml for 24 h. Images were captured with a fluorescence microscope (OLYMPUS CKX 41). Data represented are mean ± SD of three identical experiments made in three replicate. *Statistically significant difference as compared to control (p < 0.05)
Zinc ferrite nanoparticle-altered the expression of apoptotic genes
Quantitative real-time PCR was used to analyze the expression of mRNA level of various genes involved in apoptosis (p53, bax, bcl-2, caspase-3 and caspase-9) in A431, HepG2 and A549 cells exposed to zinc ferrite NPs at a concentration of 20 µg/ml for 24 h. We noticed that zinc ferrite NPs altered the expression of these genes in all three types of cells (p < 0.05 for each) (Fig. 7a). Transcription expression level of tumor suppressor gene p53 and pro-apoptotic gene bax were up-regulated while the expression of anti-apoptotic gene bcl-2 was down-regulated in cells treated with zinc ferrite NPs. We also observed the higher expression of caspase-3 and caspase-9 genes in NPs treated cells as compared to the control.

Zinc ferrite NPs induced apoptotic response in A431, HepG2 and A549 cells. a Regulation of mRNA levels of apoptotic genes in all the cells after exposure to zinc ferrite NPs at a concentration of 20 µg/ml for 24 h. The mRNA levels were determined by quantitative real-time PCR as described in “Methods” section. b Activity of caspase-3 and caspase-9 enzymes in A431, HepG2 and A549 cells after exposure to zinc ferrite NPs at a concentration of 20 µg/ml for 24 h. Data represented are mean ± SD of three identical experiments made in three replicate. *Significant difference as compared to the controls (p < 0.05 for each)
Zinc ferrite nanoparticle-induced the activity of caspase-3 and caspase-9 enzymes
In support of real-time PCR results, we further determined the activity of caspase-3 and caspase-9 enzymes in A431, HepG2 and A549 cells treated with zinc ferrite NPs at a concentration of 20 µg/ml for 24 h. Results have shown that zinc ferrite NPs increased the activity of both apoptotic enzymes (caspas-3 and caspase-9) in all three types of cells (p < 0.05 for each) (Fig. 7b).
Zinc ferrite nanoparticle- induced cytotoxicity through ROS generation
In order to investigate whether ROS generation might plays a critical role in cytotoxicity of zinc ferrite NPs, cells were exposed to zinc ferrite NPs in the presence of NAC (ROS scavenger). Results showed that NAC abolished almost fully the cytotoxic effect of zinc ferrite NPs in all three types of cells (A431, HepG2 and A549) (Fig. 8).
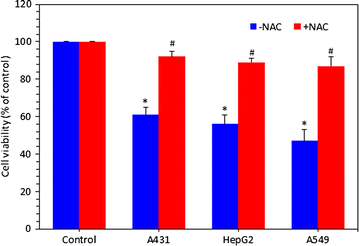
Zinc ferrite NPs induced cytotoxicity in A431, HepG2 and A549 cells through ROS generation. Cells were exposed to zinc ferrite NPs at a concentration of 20 µg/ml in the presence of 10 mM N-acetyl-cystein (NAC) for 24 h. At the end of the exposure time, cell viability was determined. We observed that NAC significantly preserved the viability of all three cells induced by zinc ferrite NPs. Data represented are mean ± SD of three identical experiments made in three replicate. *Significant difference as compared to the controls (p < 0.05 for each). #Significant inhibitory effect of NAC on cell viability reduction (p < 0.05 for each)
Taken together, there was marginally difference in the sensitivity of three cells against zinc ferrite NPs exposure. Cytotoxic response of zinc ferrite NPs were in following order; A549 cells > HepG2 cells > A431cells. However, the modes of action of cytotoxicity of zinc ferrite NPs in all three cells were look similar.
Discussion
Despite many advantages in using spinel ferrite NPs, evidences are increasing to indicate that spinet ferrite NPs may cause toxic effects to human cells [9, 20, 25, 38]. Although the beneficial effects of zinc ferrite (ZnFe2O4) have attracted considerable attention in biomedical application, their human and environmental hazards should also be considered. Therefore, in this study, we have examined the toxicological effects of zinc ferrite NPs in three different cell lines of human body. The NPs may pose toxic effects due to their tiny size and unique physiochemical properties [27]. Therefore, it is essential to characterize the NPs before their toxicological investigations. The principal parameters of NPs are their size, shape, crystallanity, purity/impurity, hydrodynamic size and agglomeration/dispersion that influence the biological interaction of NPs [21, 27, 39]. We have employed SEM, TEM and DLS techniques to characterize the NPs. The SEM image suggested the smooth surfaces of NPs. The primary particle size of zinc ferrite measured by TEM was approximately 44 nm. High-resolution TEM images represented the crystalline behavior of this material. Secondary particle size (aqueous suspension) of the NPs is also regarded as an important parameter for in vitro assays. Therefore, extent of aggregation and secondary size of zinc ferrite NPs in water and cell culture medium was evaluated through dynamic light scattering (DLS). The DLS is widely used to determine the size of Brownian NPs in colloidal suspensions in the nano and submicron ranges [44]. We observed that the secondary particle size (hydrodynamic diameter) of zinc ferrite NPs was several times higher as compared with the primary size measured by TEM. The greater size of NPs in liquid medium than the primary size could be due to tendency of NPs to aggregate in aqueous state. This finding is supported by other studies, [40, 41] and has been briefly discussed in our earlier work [42]. The average hydrodynamic size of NPs in cell culture medium were slightly smaller (289 nm) as compared to de-ionized water (312 nm), which indicates the possible interaction of zinc ferrite NPs with the protein of culture media, which has been widely reported with different NPs that leads to the formation of ‘protein corona’ [43, 44]. The tendency of particles to form aggregates depends on the surface modification and charge. The surface charge of zinc ferrite NPs measured as zeta potential was around −18 and −23 mV for water and culture medium, respectively.
After characterization of zinc ferrite NPs, we performed a series of tests to determine the cytotoxic potential of zinc ferrite NPs in in vitro systems. Because of the limited metabolic capacity of the in vitro models, the biotransformation of a chemical in vitro may be minimal compared with that in in vivo systems. However, despite their known limited metabolic capacity, in vitro cell lines still represent promising tools for the development of high-throughput, predictive and mechanism-based assays to evaluate the potential toxicity of agents such as NPs [26]. As demonstrated in Fig. 2, it is evident that A549, A431 and HepG2 cells responded differently to zinc ferrite NPs exposure. The viability values indicate that A549 cells were more sensitive to the NPs exposure than A431 and HepG2 cells after 24 h. Decrease in cell viability after zinc ferrite NPs treatment were in following order; A549 cells > HepG2 cells > A431 cells. LDH leakage from cells is also an evidence of cell membrane damage. Studies have shown that LDH level was elevated in cells culture medium after exposure of cells to the magnetic NPs [20, 45]. Our results also demonstrated that LDH leakage was higher in a dose-dependent manner in all three types of cells treated with zinc ferrite NPs.
Normally, NPs enter into cells through endocytosis and localize in the vacuoles and cell cytoplasm of the cells [46, 47]. During internalization by endocytosis, magnetic NPs may undergo dissolution or degradation due to acidic pH of endosomes, [48] and release iron (Fe) ions that most likely promotes the generation of ROS via Haber–Weiss and/or Fenton reactions, and consequently cause oxidative damage to cell macromolecules [49]. Fe ions can also potentially escape into the cytoplasm and become a part of accessible Fe ions called the labile iron pool, which has also been shown to exist in the nucleus [50, 51]. Moreover, the tiny size with large surface area makes NPs more compatible for generation of ROS in the cell. Cancer cells as compared to normal cells are under greater intrinsic oxidative stress due to alterations in metabolism and higher accumulation of ROS due to an imbalance between ROS generation and elimination [52]. Higher sensitivity of cancer cells toward ROS generation due to NPs exposure as compared to normal cells makes them more suitable to explore the potential mechanisms of ROS mediated toxicity of NPs. We also observed ROS level was significantly higher whereas the antioxidant GSH level was significantly lower in all three A549, A431 and HepG2 cells exposed to zinc ferrite NPs. Moreover, induction ROS generation as well as reduction in cell viability due to zinc ferrite NPs exposure was efficiently prevented by antioxidant NAC treatment. These findings suggest that ROS generation might be the primarily responsible for the cytotoxicity of zinc ferrite NPs. This observation was according to the earlier findings in various human cell lines that indicate ROS generation and oxidative stress due to magnetic NPs [9, 53].
We further observed MMP loss against zinc ferrite NPs exposure in all three human cells. Changes in mitochondrial activity was based on cationic fluorescent probe Rh123, indicated the role of oxidative stress in toxicity of zinc ferrite NPs. We assume that lesser fluorescence intensity of Rh123 indicates perturbation of inner mitochondrial membranes, and consequently mitochondrial dysfunction as a result of ROS. Because ROS scavenger NAC significantly prevents the loss of MMP in zinc ferrite NPs treated cells. The transcriptional data on modulation of p53 and bax/bcl-2 ratio and release of caspases have strengthened the role of zinc ferrite in inducing mitochondrial dependent apoptotic pathway. In general, the caspases are crucial for the activation and execution of apoptosis. The main intrinsic pathway is characterized by mitochondrial dysfunction, with the release of cytochrome c, activation of caspase 9, and subsequently of caspase 3 enzyme [54]. Typically, p53 is activated when DNA damage occurs or cells are stressed and p53 is translocated to the nucleus, where it can induce pro-apoptotic gene expression on the mitochondrial membrane and activate the effector caspases and accelerate cell death [9, 55].
Conclusion
Our results have shown that zinc ferrite NPs induced cytotoxicity (MTT and LDH) in human lung (A549), skin (A431) and (HepG2) cells in a dose-dependent manner. Zinc ferrite NPs were also found to induce oxidative stress dose-dependently, indicated by ROS generation and glutathione depletion. Cytotoxicity of zinc ferrite NPs was effectively abolished N-acetyl-cysteine (ROS scavenger) indicating that oxidative stress might be one of the possible causes of zinc ferrite NPs toxicity. Zinc ferrite NPs also showed apoptotic response in all three cells evident by loss of MMP and alteration in the regulation of the apoptotic genes (p53, bax, bcl-2, caspase-3, and caspase-9). The sensitivity of these three cells against zinc ferrite NPs exposure was marginally different. Cytotoxic response of zinc ferrite NPs were in following order; A549 cells > HepG2 cells > A431 cells. Overall, present investigation suggests that zinc ferrite NPs induced cytotoxicity was mediated through ROS generation. Further studies are underway to explore the toxic potential of zinc ferrite NPs at in vivo level.
References
Sun C, Lee JSH, Zhang M. Magnetic nanoparticles in MR imaging and drug delivery. Adv Drug Deliv Rev. 2008;60:1252–65.
Taylor EN, Webster TJ. The use of superparamagnetic nanoparticles for prosthetic biofilm prevention. Int J Nanomedicine. 2009;4:145–52.
Klostergaard J, Seeney CE. Magnetic nanovectors for drug delivery. Nanomedicine. 2012;8(Suppl 1):S37–50.
Song Q, Zhang ZJ. Correlation between spin-orbital coupling and the superparamagnetic properties in magnetite and cobalt ferrite spinel nanocrystals. J Phys Chem B. 2006;110:11205–9.
Willard MA, Kurihara LK, Carpenter EE, Calvin S, Harris VG. Chemically prepared magnetic nanoparticles. Int Mat Rev. 2004;49:125–70.
Hafeli UO, Riffle JS, Harris-Shekhawat L, Carmichael-Baranauskas A, Mark F, Dailey JP, et al. Cell uptake and in vitro toxicity of magnetic nanoparticles suitable for drug delivery. Mol Pharm. 2009;6(5):1417–28.
Lartigue L, Wilhelm C, Servais J, Factor C, Dencausse A, Bacri J-C, et al. Nanomagnetic sensing of blood plasma protein interactions with iron oxide nanoparticles: impact on macrophage uptake. ACS Nano. 2012;6(3):2665–78.
Barcena C, Sra AK, Chaubey GS, Khemtong C, Liu JP, Gao J. Zinc ferrite nanoparticles as MRI contrast agents. Chem Commun. 2008;19:2224–6.
Saquib Q, Al-Khedhairy AA, Ahmad J, Siddiqui MA, Dwivedi S, Khan ST, Musarrat J. Zinc ferrite nanoparticles activate IL-1b, NFKB1, CCL21 and NOS2 signaling to induce mitochondrial dependent intrinsic apoptotic pathway in WISH cells. Toxicol Appl Pharmacol. 2013;273(2):289–97.
Vochita G, Creanga D, Focanici-Ciurlica EL. Magnetic nanoparticle genetic impact on root tip cells of sunflower seedlings. Water Air Soil Pollut. 2012;223:2541–9.
Oberdorster G, Oberdorster E, Oberdorster J. Nanotoxicology: an emerging discipline evolving from studies of ultrafine particles. Environ Health Perspect. 2005;113:823–39.
Madl AK, Pinkerton KE. Health effects of inhaled engineered and incidental nanoparticles. Crit Rev Toxicol. 2009;39:629–58.
Ursini CL, Cavallo D, Fresegna AM, Ciervo A, Maiello R, Tassone P, Buresti G, Casciardi S, Iavicoli S. Evaluation of cytotoxic, genotoxic and inflammatory response in human alveolar and bronchial epithelial cells exposed to titanium dioxide nanoparticles. J Appl Toxicol. 2014;34(11):1209–19.
Johnston HJ, Hutchison GR, Christensen FM, Peters S, Hankin S, Stone V. Identification of the mechanisms that drive the toxicity of TiO2 particulates: the contribution of physicochemical characteristics. Part Fibre Toxicol. 2009;6:33.
Chen Z, Meng H, Yuan H, **ng G, Chen C, Zhao F, et al. Identification of target organs of copper nanoparticles with ICPMS technique. J Radioanal Nucl Chem. 2007;272:599–603.
Wang B, Feng W, Wang M, Wang T, Gu T, Zhu M, et al. Acute toxicological impact of nano- and submicro-scaled zinc oxide powder on healthy adult mice. J Nanopart Res. 2008;2008(10):263–76.
Barillet S, Jugan ML, Laye M, Leconte Y, Herlin-Boime N, Reynaud C, et al. In vitro evaluation of SiC nanoparticles impact on A549 pulmonary cells: cyto-, genotoxicity and oxidative stress. Toxicol Lett. 2010;198:324–30.
Shukla RK, Sharma V, Pandey AK, Singh S, Sultana S, Dhawan A. ROS-mediated genotoxicity induced by titanium dioxide nanoparticles in human epidermal cells. Toxicol In Vitro. 2011;25:231–41.
Piret JP, Jacques D, Audinot JN, Mejia J, Boilan E. Copper (II) oxide nanoparticles penetrate into HepG2 cells, exert cytotoxicity via oxidative stress and induce pro-inflammatory response. Nanoscale. 2012;2012(4):7168–84.
Ahamed M, Alhadlaq HA, Alam J, Khan MA, Ali D, Alarafi S. Iron oxide nanoparticle-induced oxidative stress and genotoxicity in human skin epithelial and lung epithelial cell lines. Curr Pharm Des. 2013;19(37):6681–90.
Nel A, **a T, Madler L, Li N. Toxic potential of materials at the nanolevel. Science. 2006;311:622–7.
Kumar A, Pandey AK, Singh SS, Shanker R, Dhawan A. Engineered ZnO and TiO(2) nanoparticles induce oxidative stress and DNA damage leading to reduced viability of Escherichia coli. Free Radic Biol Med. 2011;51(10):1872–81.
Sharma V, Anderson D, Dhawan A. Zinc oxide nanoparticles induce oxidative DNA damage and ROS-triggered mitochondria mediated apoptosis in human liver cells (HepG2). Apoptosis. 2012;17(8):852–70.
Magdolenova Z, Collins A, Kumar A, Dhawan A, Stone V, Dusinska M. Mechanisms of genotoxicity. A review of in vitro and in vivo studies with engineered nanoparticles. Nanotoxicology. 2014;8(3):233–78.
Ahamed M, Akhtar MJ, Siddiqui MA, Ahmad J, Musarrat J, Al-Khedhairy AA, Alrokayan SA. Oxidative stress mediated apoptosis induced by nickel ferrite nanoparticles in cultured A549 cells. Toxicology. 2011;2011(283):101–8.
Ahamed M, Akhtar MJ, Alhadlaq HA, Khan MAM, Alrokayan SA. Comparative cytotoxic response of nickel ferrite nanoparticles in human liver HepG2 and breast MFC-7 cancer cells. Chemosphere. 2015;135:278–88.
Murdock RC, Braydich-Stolle L, Schrand AM, Schlager JJ, Hussain SM. Characterization of nanomaterial dispersion in solution prior to in vitro exposure using dynamic light scattering technique. Toxicol Sci. 2008;101:239–53.
Mossman T. Rapid colorimetric assay for cellular growth and survival: application to proliferation and cytotoxicity assays. J Immunol Methods. 1983;65:55–63.
Wang H, Joseph JA. Quantifying cellular oxidative stress by dichlorofluorescin assay using microplate reader. Free Radic Biol Med. 1999;27:612–6.
Siddiqui MA, Alhadlaq HA, Ahmad J, Al-Khedhairy AA, Musarrat J, Ahamed M. Copper oxide nanoparticles induced mitochondria mediated apoptosis in human hepatocarcinoma cells. PLoS One. 2013;8:e69534.
Ahmad J, Ahamed M, Akhtar MJ, Alrokayan SA, Siddiqui MA, Musarrat J, Al-Khedhairy AA. Apoptosis induction by amorphous silica nanoparticles mediated through reactive oxygen species generation in human liver cell line HepG2. Toxicol Appl Pharmacol. 2012;259:160–8.
Ellman GI. Tissue sulfhydryl groups. Arch Biochem Biophys. 1959;82:70–7.
Zhang Y, Jiang L, Jiang L, Geng C, Li L, Shao J, Zhong L. Possible involvement of oxidative stress in potassium bromateinduced genotoxicity in human HepG2 cells. Chem Biol Int. 2011;189:186–91.
Ahamed M, Alhadlaq HA. Nickel nanoparticle-induced dose-dependent cyto-genotoxicity in human breast carcinoma MCF-7cells. Onco Targets Ther. 2014;7:269–80.
Berasain C, Garcia-Trevijano ER, Castillo J, Erroba E, Santamaria M, Lee DC. Novel role for amphiregulin in protection from liver injury. J Biol Chem. 2005;280:19012–20.
Bradford MM. A rapid and sensitive method for the quantitation of microgram quantities of protein utilizing the principle of protein-dye binding. Anal Biochem. 1976;72:248–54.
Ahamed M, AlSalhi MS, Siddiqui MKJ. Silver nanoparticle applications and human health. Clin Chim Acta. 2010;411:1841–8.
Horev-Azaria L, Baldi G, Beno D, Bonacchi D, Golla-Schindler U, Kirkpatrick JC, et al. Predictive toxicology of cobalt ferrite nanoparticles: comparative in vitro study of different cellular models using methods of knowledge discovery from data. Part Fibre Toxicol. 2013;10:32.
Yu KO, Grabinski CM, Schrand AM, Murdock RC, Wang W, Gu B, et al. Toxicity of amorphous silica nanoparticles in mouse keratinocytes. J Nanopart Res. 2009;11:15–24.
Sharma V, Shukla RK, Saxena N, Parmar D, Das M, Dhawan A. DNA damaging potential of zinc oxide nanoparticles in human epidermal cells. Toxicol Lett. 2009;185:211–8.
Bai W, Zhang Z, Tian W, He X, Ma Y, Zhao Y, Chai Z. Toxicity of zinc oxide nanoparticles to zebrafish embryo: a physicochemical study of toxicity mechanism. J Nanopart Res. 2009;12:1645–54.
Ahamed M, Posgai R, Gorey TJ, Nielsen M, Hussain S, Rowe J. Silver nanoparticles induced heat shock protein 70, oxidative stress and apoptosis in Drosophila melanogaster. Toxicol Appl Pharmacol. 2010;242:263–9.
Lundqvist M, Stigler J, Elia G, Lynch I, Cerdevall T, Dawson K. Nanoparticle size and surface properties determine the protein corona with possible implications for biological impacts. Proc Natl Acad Sci USA. 2008;105:14265–70.
Lynch I, Dawson K. Protein–nanoparticle interactions. Nanotoday. 2008;3:40–7.
Mahmoudi M, Laurent S, Shokrgozar MA, Hosseinkhani M. Toxicity evaluations of superparamagnetic iron oxide nanoparticles: cell “vision” versus physicochemical properties of nanoparticles. ACS Nano. 2011;5:7263–6.
Hussain S, Thomassen L, Ferecatu I, Borot MC, Andreau K, Martens J, et al. Carbon black and titanium dioxide nanoparticles elicit distinct apoptotic pathways in bronchial epithelial cells. Part Fibre Toxicol. 2010;7:10.
Saquib Q, Al-Khedhairy AA, Siddiqui MA, Abou-Tarboush FM, Azam A, Musarrat J. Titanium dioxide nanoparticles induced cytotoxicity, oxidative stress and DNA damage in human amnion epithelial (WISH) cells. Toxicol In Vitro. 2012;2012(26):351–61.
Singh N, Jenkins GJS, Nelson BC, Marquis BJ, Maffeis TGG, Brown AP, et al. The role of iron redox state in the genotoxicity of ultrafine superparamagnetic iron oxide nanoparticles. Biomaterials. 2012;33:163–70.
Soenen SJH, Himmelreich U, Nuytten N, Pisanic TR, Ferrari A, De Cuyper M. Intracellular nanoparticle coating stability determines nanoparticle diagnostics efficacy and cell functionality. Small. 2010;6:2136–45.
Kruszewski M, Iwaneńko T. Labile iron pool correlates with iron content in the nucleus and the formation of oxidative DNA damage in mouse lymphoma L5178Y cell lines. Acta Biochim Pol. 2003;50:211–5.
Petrat F, de Groot H, Rauen U. Subcellular distribution of chelatable iron: a laser scanning microscopic study in isolated hepatocytes and liver endothelial cells. Biochem J. 2001;356:61–9.
Cairns RA, Harris IS, Mak TW. Regulation of cancer cell metabolism. Nat Rev Cancer. 2011;11(2):85–95.
Al-Qubaisi MS, Rasedee A, Flaifel MH, Ahmad SH, Hussein-Al-Ali S, Hussein MZ, et al. Cytotoxicity of nickel zinc ferrite nanoparticles on cancer cells of epithelial origin. Int J Nanomedicine. 2013;8:2497–508.
Porter AG, Jänicke RU. Emerging roles of caspase-3 in apoptosis. Cell Death Differ. 1999;6:99–104.
Farnebo M, Bykov VN, Wiman KG. The p53 tumor suppressor: a master regulator of diverse cellular processes and therapeutic target in cancer. Biochem Biophys Res Commun. 2010;396:85–9.
Authors’ contributions
HAA, MJA, and MA performed the experiments and analyzed the data. MA conceived of the study, and participated in its design and coordination and helped to draft the manuscript. All authors read and approved the final manuscript.
Acknowledgements
The authors would like to extend their sincere appreciation to the Deanship of Scientific Research at King Saud University for its funding through research group no RG-1435-308.
Compliance with ethical guidelines
Competing interests The authors declare that they have no competing interests.
Author information
Authors and Affiliations
Corresponding author
Rights and permissions
Open Access This article is distributed under the terms of the Creative Commons Attribution 4.0 International License (http://creativecommons.org/licenses/by/4.0/), which permits unrestricted use, distribution, and reproduction in any medium, provided you give appropriate credit to the original author(s) and the source, provide a link to the Creative Commons license, and indicate if changes were made. The Creative Commons Public Domain Dedication waiver (http://creativecommons.org/publicdomain/zero/1.0/) applies to the data made available in this article, unless otherwise stated.
About this article

Cite this article
Alhadlaq, H.A., Akhtar, M.J. & Ahamed, M. Zinc ferrite nanoparticle-induced cytotoxicity and oxidative stress in different human cells. Cell Biosci 5, 55 (2015). https://doi.org/10.1186/s13578-015-0046-6
Received:
Accepted:
Published:
DOI: https://doi.org/10.1186/s13578-015-0046-6