
Abstract
Background
Transcriptome map is a powerful tool for a variety of biological studies; transcriptome maps that include different organs, tissues, cells and stages of development are currently available for at least 30 plants. Some of them include samples treated by environmental or biotic stresses. However, most studies explore only limited set of organs and developmental stages (leaves or seedlings). In order to provide broader view of organ-specific strategies of cold stress response we studied expression changes that follow exposure to cold (+ 4 °C) in different aerial parts of plant: cotyledons, hypocotyl, leaves, young flowers, mature flowers and seeds using RNA-seq.
Results
The results on differential expression in leaves are congruent with current knowledge on stress response pathways, in particular, the role of CBF genes. In other organs, both essence and dynamics of gene expression changes are different. We show the involvement of genes that are confined to narrow expression patterns in non-stress conditions into stress response. In particular, the genes that control cell wall modification in pollen, are activated in leaves. In seeds, predominant pattern is the change of lipid metabolism.
Conclusions
Stress response is highly organ-specific; different pathways are involved in this process in each type of organs. The results were integrated with previously published transcriptome map of Arabidopsis thaliana and used for an update of a public database TraVa: http://travadb.org/browse/Species=AthStress.
Background
Since the construction of the first plant transcriptome map [1], gene expression atlases were published for many plants belonging to the variety of families and became a widely used tool in plant studies. By definition, transcriptome map, or gene expression atlas, is a collection of expression profiles of all genes in different organs, tissues or cells under various environmental conditions [1]. For the current moment, such collections are covering plant taxa from moss [2] and pine [3] to many species of Rosids and Asterids, including model [4, 5], agricultural [35]. Hypocotyl 27 showed photosynthetic enrichment in upregulated genes. Upregulated genes in Young Flower 27 were enriched for catabolic processes and pollen-related terms (Additional file 1: Tables S9 and S10).
The remarkable diversity of the processes leading to cold acclimation in various organs provides evidence for the adjustment of the general response to stress by organ-specific responses. This fact may limit the application of knowledge on the cold response in one organ (e.g. leaf) to another organ (e.g. seed).
Stress response in non-leaf organs does not involve many known regulators and stress-response genes
We found a surprisingly low fraction of DE genes annotated as stress responsive (GO category “GO:0006950~response to stress” and downstream categories). The fraction of genes from this category varied between 8 and 12% for both 3 h and 27 h samples; the absolute number of stress-annotated genes was the lowest in the Young Flower 3 (106 genes) and highest in Leaf 27 (628 genes). These results show that GO annotation of the Arabidopsis genome strongly underestimates the number of stress-responsive genes. This is especially pronounced in organs that are not usually the focus of stress response studies, such as flowers and seeds (Fig. 2a). GO annotation has several shortcomings and is known to be incomplete; in particular, approximately 50% of A. thaliana genes do not have biological process annotations. Additionally, many GO annotations are based only on computational predictions and are not supported by experimental data [36].
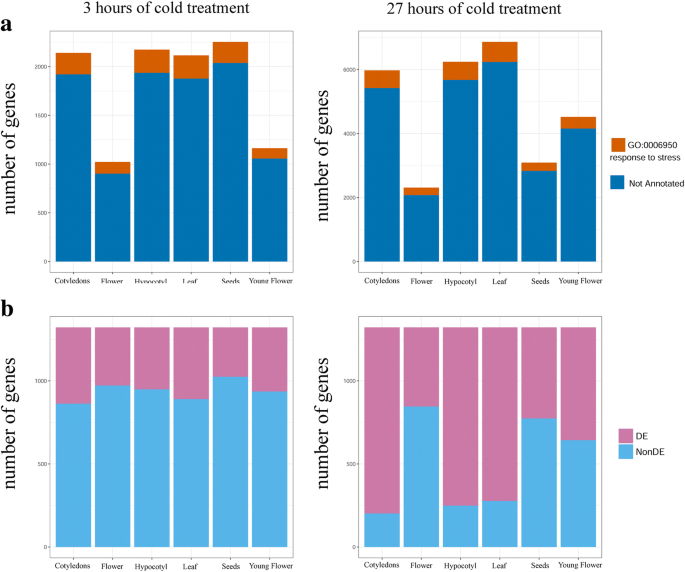
(a) Number of DE genes for each sample that are annotated or not annotated as stress-responses via Gene Ontology. (b) Number of COR genes that are DE in our data
Searching a list of genes for which participation in the cold stress response is defined by experimental data (1322 COR genes) [21], we found that 64% of these genes were DE in at least one organ after 3 h of cold treatment (26% belong to Down, 34% to Up, and 4% to Mix category) (Additional file 1: Table S11). Considering the genes by organ, the percentage of DE genes varied from 22% in Seeds 3 to 35% in Cotyledons 3 (Fig. 2b). After 27 h, the picture was even more pronounced. Although 99% of COR genes were DE in at least one organ, the distribution of genes by organ varied greatly; 79–85% of COR genes were DE in Cotyledons 27, Leaf 27, and Hypocotyl 27, although the percentages in Flower 27, Young Flower 27, and Seeds 27 were 36, 51 and 41%, respectively (Fig. 2b, Additional file 1: Table S12). These results show that the cold stress response in non-photosynthetic organs not only involves additional genes that were not previously associated with stress but also does not recruit many known regulators.
The CBF1, CBF2 and CBF3 genes are known to be activated within a few minutes after exposure to cold [15, 18]. Despite their crucial importance in cold acclimation, these genes are not unique in the early response to stress. Using the time course experiments performed by Kilian et al. [24], Park et al. [21], identified 27 transcriptional factors as having the same behavior as CBF-encoded genes (named “first-wave” genes). In our data, the first expression measurement time was 3 h after the beginning of the low temperature conditions, which is not the earliest possible time point, although we were still able to identify all except one of the first-wave genes as DE in at least one organ. Four genes were DE in all organs after 3 h of cold treatment (including CBF3), while others had noticeable differences in their expression patterns (Additional file 1: Table S13). For 5 genes, we observed opposite changes in expression in various organs, with high differences in fold changes (e.g., the fold change for ZAT12 in Hypocotyl 3 and Leaf 3 were 0.22 and 2.96, respectively). After 27 h, the diversity of the expression changes became more notable; the first-wave genes from most organs showed downregulated expression or their expression had returned to the control value. However, in Leaf 27, there were 19 genes that were still upregulated (Additional file 1: Table S14). This variety in responses to cold from early activated transcriptional factors confirms the inadequacy of simple transfer or the results obtained on one organ to another.
Expression characteristics of stress-response genes: Shannon entropy
We assessed several parameters that are associated with organ-specific stress-response genes based on the RNA-seq transcriptome map for A. thaliana [5]. We first estimated the expression pattern width using Shannon entropy H [37, 38]. Genes with high H value are expressed ubiquitously, while those with a low H value have a narrow expression pattern. The distribution of entropy for all of the expressed genes was noticeably skewed to the right, indicating a high number of genes with wide expression patterns [5]. The second small peak appears at very low H values and corresponds to genes that are highly expressed in an organ-, tissue- or stage-specific manner. The distribution for the 15,459 genes that have expression changes in response to stress resembled the overall distribution, while genes that are common in at least 5 organs genes lacked low H peaks (Fig. 3 a and b). The entropy of unique genes for most of the samples was distributed similarly to common DE genes. However, some samples had distinct features in the H distribution. Specifically, for genes that were upregulated in Leaf 3, there was a peak at low (0–0.3) entropy values (Fig. 3c). We analyzed the expression patterns of these genes in the transcriptome map. Surprisingly, under non-stress conditions, the expression of all of these genes (with one exception) as restricted to mature anthers and whole flowers containing anthers at the same stage (Additional file 1: Table S15). These genes were differentially expressed in Leaf after 3 h of cold treatment, and the half of them (44%) were also DEs in Leaf 27. Only 33% of the genes were DE in Flower 27, and none of them had shifted expression in Flower 3. For most of these genes, their function is related to controlling cell wall conditions and pollen tube growth (Additional file 1: Table S15). Among them, the most pronounced changes were in genes encoding pectin methylesterases. Pectin is a crucial component in the cell wall, as the matrix in which other polysaccharides (cellulose and hemicellulose) are embedded. Pectins are produced in the Golgi in a highly methylesterified form and are then modified by pectin methylesterases, which catalyze deesterification [39]. The ratio of esterified to de-esterified pectins determines many cell wall properties, such as rigidity, permeability and cohesion. This increase in pectin methylesterase activity under cold stress has been found in other plants [40, 41]. It is regarded as a cold acclimation mechanism because the increase in cell wall rigidity offers a higher resistance to dehydration and inhibits organ growth. Our results indicate that implementation of this mechanism in A. thaliana occurs by the recruitment of pollen-specific genes.
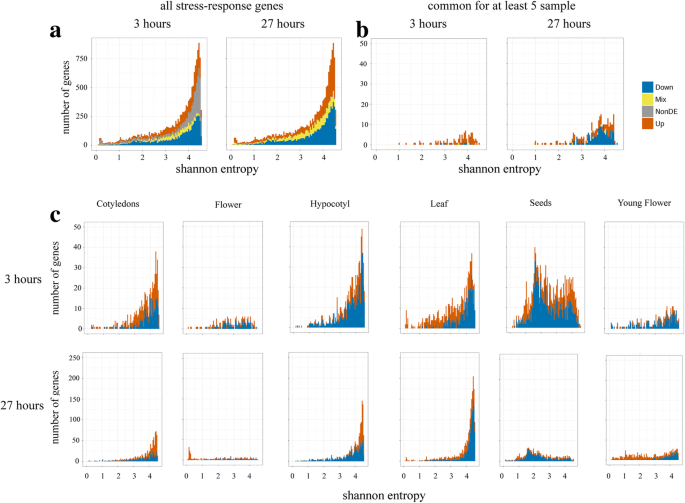
Shannon entropy distribution. (a) Shannon entropy for the 15,459 stress-response genes in the transcriptome map. (b) Shannon entropy for genes that are DE in at least 5 samples. (c) Shannon entropy for unique sample genes
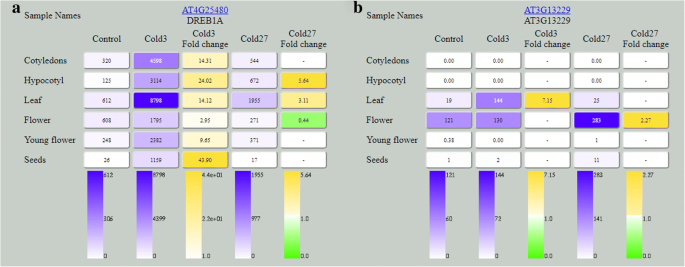
Similar to Leaf 3, the H distribution for DE genes uniquely upregulated in Flower 27 has a peak at low values (Fig. 3c). All of these genes are also anther-specific. GO enrichment analysis revealed overrepresentation of terms associated with pollen tube growth and cell wall modification (Additional file 1: Table S16). These genes revealed a complex picture. In particular, we observed concerted upregulation of pectin methylesterase inhibitors (PMEI5 (AT2G31430) and others), while the expression of pectin methylesterases (PPME1, VGD1, VGDH2 (AT1G69940, AT2G47040, and AT3G62170) was also increased. Pectin methylesterase PPME1 has been shown to linearly demethylesterify pectin chains in pollen tube walls. A reduction in PPME1 activity in ppme1 mutant leads to decreased cell wall rigidity [42]. VGD1 is another gene that encodes a pectin methylesterase. VGD1 also has a linear demethylesterification activity and modifies pollen wall pectin [Genes unique to organs: Overrepresentation of regulatory elements from transcription factors outside the ERF/AP2 family For a deeper understanding of the gene networks involved in cold acclimation in different organs, we analyzed the overrepresentation of regulatory elements from transcription factors from different gene lists (e.g., common in all or at least five organs, DE genes unique for certain samples, or genes with a certain Shannon entropy H; for a full list of the tested gene groups see Additional file 1: Table S19). As expected, the promoter regions of DE genes upregulated in all or at least 5 organs were enriched with CBF regulatory elements. Genes which have these elements and are thus likely to be under regulation of CBF1–3 transcription factors displayed stress GO enrichment terms (Additional file 1: Table S20). As expected, promoter regions of DE genes upregulated in all or at least 5 organs were enriched with CBF regulatory elements. Genes that cause this overrepresentation and can be under regulation of CBF1–3 transcription factors have stress GO enrichment. Among these genes 12 transcription factors that also are characterized by overrepresentation in DE genes common for at least 5 organs and possibly regulated by them genes are enriched with stress GO terms too. Four of these transcription factors belong to ERF/AP2 family and were described as participants in both biotic and abiotic stress response [61]. Regarding genes that are unique for each sample, we did not find any overrepresentation of CBF regulatory elements, which shows that factors other than CBF govern organ-specific stress responses. In particular, we found an overrepresentation of regulatory elements for 9 NAC transcription factors in promoters of upregulated DE genes in Young Flower 27 (Additional file 1: Table S21). To make these data available to the plant science community, we included them in our database TraVA (https://travadb.org). The interface and options are similar to the datasets from Klepikova et al. [5] and Kasianov et al. [10]. The profiles for each gene in the cotyledons, hypocotyl, leaves, young flowers, mature flowers and seeds are represented under both the control and cold treatment conditions as the number of reads and as fold change in the expression level relative to the control (Fig. 5). Database view. (a) Read counts and fold changes for CBF3 (DREB1A) among all samples. (b) Read counts and fold changes for AT3G13229 among all samplesDatabase
Conclusions
We analyzed gene expression in six Arabidopsis organs and tissues after 3 and 27 h of cold treatment using RNA-seq. We found that 15,459 genes were differentially expressed in at least one sample. Well-studied organs (leaf, cotyledons and the hypocotyl) showed similar results to other studies, while seeds, flowers and young flowers displayed pronounced differences. Only a small number of genes were common in all samples. These core genes were strongly enriched in stress-related GO categories. Unique sample genes were related to different processes in each organ. Some of these genes displayed expression specificities, such as peaks in Shannon entropy or DE Score distributions. Thus, while the mechanisms of cold stress response are common in all plants, in every organ they are modified in a unique fashion, including the recruitment of genes that are expressed in other organs in non-stress conditions.
Methods
Plant growth, cold treatment and sample collection
Col-0 A. thaliana (accession CS70000) plants were grown as described in Klepikova et al. [62], with the exception of vernalization. The collected samples are described in Additional file 1: Table S1. For each sample, two biological replicates with 15 individual plants were obtained and fixed in RNAlater (Qiagen, USA).
Control samples were harvested from ZT 8 to 9 and on the next day at ZT 5 temperature in a climate chamber set at + 4 °C. Samples treated with cold for 3 h were collected at ZT 8 and for 27 h at ZT 8 the next day.
RNA extraction and sequencing
Total RNA was extracted with a RNeasy Plant Kit (Qiagen, USA) following the manufacturer’s protocol. cDNA libraries for sequencing were constructed with the TruSeq RNA Sample Prep Kits v2 (Illumina) following the manufacturer’s protocol. An Illumina HiSeq2000 was used for sequencing with a 50 bp read length and a sequence depth of 20 million uniquely mapped reads.
Trimming and map** of reads and expression level determination
For read trimming, the CLC Genomics Workbench 6.5.1 was used with the following parameters: “quality scores - 0.005; trim ambiguous nucleotides – 2; remove 5’-terminal nucleotides – 1; remove 3’-terminal nucleotides – 1; and discard reads below a length of 25”. The trimmed reads were mapped using the CLC Genomics Workbench to the reference A. thaliana genome (TAIR10 genome release) with unique map** only (length fraction = 1 and similarity fraction = 0.95). For each gene, total gene reads (TGR) was determined as the sum of all the reads mapped on this gene. Sequencing and map** statistics are shown at Additional file 1: Table S22. Total gene reads and RPKM are provided for all samples at Additional file 1: Table S23 and S24, respectively.
Identification of differentially expressed genes
Differentially expressed (DE) genes were identified using the R package “DESeq2” [63]. A false discovery rate (FDR) of 0.05 and fold change of 2 were chosen as the initial threshold for significant differential expression.
Gene ontology enrichment analysis
Downregulated and upregulated DE gene lists were analyzed by Gene Ontology (GO) and other annotation (as key words or as a protein domain) enrichments using the DAVID gene functional annotation tool with an FDR value of 0.05 and fold change category representation of 2 as the threshold of significance [64, 65].
Hierarchical clustering
A hierarchical tree was obtained with the “hclust” function from the R package “stats” [66].
Identification of key transcription factors
To identify the transcription factors involved in the regulation of observed differential gene expression we used annotations of the transcription factor targets based on ampDAP-seq [67]. For each set of DE genes, we considered data for all transcription factors. We estimated the relative enrichment of targets among differentially expressed genes as the log2 of the %target (DE) / %target (non-DE). The statistical significance was assessed using the right-tailed Fisher’s exact test with 2 × 2 contingency tables (targets vs. non-targets and DE vs. non-DE) with FDR correction for multiple tested transcription factors (219 TFs).
Accession numbers
The Illumina sequence reads have been deposited into the NCBI Sequence Read Archive with project ID PRJNA411947.
Abbreviations
- COR:
-
Cold-response
- DE:
-
Differentially expressed
- GO:
-
Gene ontology
- PPR:
-
Pentatricopeptide repeat
- TF:
-
Transcription factor
References
Schmid M, Davison TS, Henz SR, Pape UJ, Demar M, Vingron M, et al. A gene expression map of Arabidopsis thaliana development. Nat Genet. 2005;37:501–6.
Ortiz-Ramırez C, Hernandez-Coronado M, Thamm A, Catarino B, Wang M, Dolan L, et al. A transcriptome atlas of Physcomitrella patens provides insights into the evolution and development of land plants. Mol Plant. 2016;9:205–20.
Rafael A, Canas RA, Li Z, Pascual MB, Castro-Rodrıguez V, Avila C, et al. The gene expression landscape of pine seedling tissues. Plant J. 2017;91:1064–87.
Alves-Carvalho S, Aubert G, Carrere S, Cruaud C, Brochot A, Jacquin F, et al. Full-length de novo assembly of RNA-seq data in pea (Pisum sativum L.) provides a gene expression atlas and gives insights into root nodulation in this species. Plant J. 2015;84:1–19.
Klepikova AV, Kasianov AS, Gerasimov ES, Logacheva MD. Penin AA. A high resolution map of the Arabidopsis thaliana developmental transcriptome based on RNA-seq profiling. Plant J. 2016;88:1058–70.
Wang L, **e W, Chen Y, Tang W, Yang J, Ye R, et al. A dynamic gene expression atlas covering the entire life cycle of rice. Plant J. 2010;61:752–66.
McCormick RF, Truong SK, Sreedasyam A, Jenkins J, Shu S, Sims D, et al. The Sorghum bicolor reference genome: improved assembly, gene annotations, a transcriptome atlas, and signatures of genome organization. Plant J. 2018;93(2):338–54.
Dubois A, Carrere S, Raymond O, Pouvreau B, Cottret L, Roccia A, et al. Transcriptome database resource and gene expression atlas for the rose. BMC Genomics. 2012;13:638.
Edwards KD, Bombarely A, Story GW, Allen F, Mueller LA, Steve A, Coates SA, Jones L. TobEA: an atlas of tobacco gene expression from seed to senescence. BMC Genomics. 2010;11:142.
Kasianov AS, Klepikova AV, Kulakovskiy IV, Gerasimov ES, Fedotova AV, Besedina EG, et al. high-quality genome assembly of Capsella bursa-pastoris reveals asymmetry of regulatory elements at early stages of polyploid genome evolution. Plant J 2017;91:278–291.
Nobuta K, Venu RC, Lu C, Belo A, Vemaraju K, Kulkarni K, et al. An expression atlas of rice mRNAs and small RNAs. Nat Biotech. 2007;24(4):473–7.
Massa AN, Childs KL, Lin H, Bryan GJ, Giuliano G, et al. The transcriptome of the reference potato genome Solanum tuberosum group Phureja clone DM1-3 516R44. PLoS One. 2011;6(10):e26801.
Knight MR, Knight H. Low-temperature perception leading to gene expression and cold tolerance in higher plants. New Phytol. 2012;195:737–51.
Thomashow MF. Plant cold acclimation: freezing tolerance genes and regulatory mechanisms. Annu Rev Plant Physiol Plant Mol Biol. 1999;50:571–99.
Gilmour SJ, Zarka DG, Stockinger EJ, Salazar MP, Houghton JM, Thomashow MF. Low temperature regulation of the Arabidopsis CBF family of AP2 transcriptional activators as an early step in cold-induced COR gene expression. Plant J. 1998;16:433–42.
Jaglo-Ottosen KR, Gilmour SJ, Zarka DG, Schabenberger O, Thomashow MF. Arabidopsis CBF1 overexpression induces COR genes and enhances freezing tolerance. Science 1998:280:104–106.
Liu Q, Kasuga M, Sakuma Y, Abe H, Miura S, Yamaguchi-Shinozaki K, et al. Two transcription factors, DREB1 and DREB2, with an EREBP/AP2 DNA binding domain separate two cellular signal transduction pathways in drought- and low-temperature-responsive gene expression, respectively, in Arabidopsis. Plant Cell. 1998;10:1391–406.
Medina J, Bargues M, Terol J, Pérez-Alonso M, Salinas J. The Arabidopsis CBF gene family is composed of three genes encoding AP2 domain-containing proteins whose expression is regulated by low temperature but not by abscisic acid or dehydration. Plant Physiol. 1999;119:463–70.
Stockinger EJ, Gilmour SJ, Thomashow MF. Arabidopsis thaliana CBF1 encodes an AP2 domain-containing transcriptional activator that binds to the C-repeat/DRE, a cis-acting DNA regulatory element that stimulates transcription in response to low temperature and water deficit. Proc Natl Acad Sci U S A. 1997;94:1035–40.
Gilmour SJ, Fowler SG, Thomashow MF. Arabidopsis transcriptional activators CBF1, CBF2, and CBF3 have matching functional activities. Plant Mol Biol. 2004;54:767–81.
Park S, Lee CM, Doherty CJ, Gilmour SJ, Kim Y, Thomashow MF. Regulation of the Arabidopsis CBF regulon by a complex low-temperature regulatory network. Plant J. 2015;82:193–207.
Vogel JT, Zarka DG, Van Buskirk HA, Fowler SG, Thomashow MF. Roles of the CBF2 and ZAT12 transcription factors in configuring the low temperature transcriptome of Arabidopsis. Plant J. 2005;41:195–211.
Fowler S, Thomashow MF. Arabidopsis transcriptome profiling indicates that multiple regulatory pathways are activated during cold acclimation in addition to the CBF cold response pathway. Plant Cell. 2002;14:1675–90.
Kilian J, Whitehead D, Horak J, Wanke D, Weinl S, Batistic O, et al. The AtGenExpress global stress expression data set: protocols, evaluation and model data analysis of UV-B light, drought and cold stress responses. Plant J. 2007;50:347–63.
Robinson SJ, Parkin IAP. Differential SAGE analysis in Arabidopsis uncovers increased transcriptome complexity in response to low temperature. BMC Genomics. 2008;9:434.
Rasmussen S, Barah P, Suarez-Rodriguez MC, Bressendorff S, Friis P, Costantino P, et al. Transcriptome responses to combinations of stresses in Arabidopsis. Plant Physiol. 2013;161:1783–94.
Smyth DR, Bowman JL, Meyerowitz EM. Early flower development in Arabidopsis. Plant Cell. 1990;2:755–67.
Fowler SG, Cook D, Thomashow MF. Low temperature induction of Arabidopsis CBF1, 2, and 3 is gated by the circadian clock. Plant Physiol. 2005;137:961–8.
Harmer SL, Hogenesch JB, Straume M, Chang HS, Han B, Zhu T, et al. Orchestrated transcription of key pathways in Arabidopsis by the circadian clock. Science. 2000;290:2110–3.
Stitt M. Hurry V. A plant for all seasons: alterations in photosynthetic carbon metabolism during cold acclimation in Arabidopsis. Curr Opin Plant Biol. 2002;5:199–206.
Kotera E, Tasaka M. Shikanai T. A pentatricopeptide repeat protein is essential for RNA editing in chloroplasts. Nature. 2005;433:326–30.
Lurin C, Andrés C, Aubourg S, Bellaoui M, Bitton F, Bruyère C, et al. Genome-wide analysis of Arabidopsis pentatricopeptide repeat proteins reveals their essential role in organelle biogenesis. Plant Cell. 2004;16:2089–103.
Jiang SC, Mei C, Liang S, Yu YT, Lu K, Wu Z, et al. Crucial roles of the pentatricopeptide repeat protein SOAR1 in Arabidopsis response to drought. salt and cold stresses Plant Mol Biol. 2015;88:369–85.
Li Q, Zheng Q, Shen W, Cram D, Fowler DB, Wei Y, et al. Understanding the biochemical basis of temperature-induced lipid pathway adjustments in plants. Plant Cell. 2015;27:86–103.
Penfield S, Rylott EL, Gilday AD, Graham S, Larson TR, Graham IA. Reserve mobilization in the Arabidopsis endosperm fuels hypocotyl elongation in the dark, is independent of abscisic acid, and requires phosphoenolpyruvate CARBOXYKINASE1. Plant Cell. 2004;16:2705–18.
Bolger ME, Arsova B, Usadel B. Plant genome and transcriptome annotations: from misconceptions to simple solutions. Brief Bioinform. 2018;19(3):437–49.
Lin S, Lin Y, Nery JR, Urich MA, Breschi A, Davis CA, et al. Comparison of the transcriptional landscapes between human and mouse tissues. Proc Natl Acad Sci U S A. 2014;111:17224–9.
Schug J, Schuller WP, Kappen C, Salbaum JM, Bucan M, Stoeckert CJ. Promoter features related to tissue specificity as measured by Shannon entropy. Genome Biol. 2005;6:R33.
Micheli F. Pectin methylesterases: cell wall enzymes with important roles in plant physiology. Trends Plant Sci. 2001;6:414–9.
Baldwin L, Domon JM, Klimek JF, Fournet F, Sellier H, Gillet F, et al. Structural alteration of cell wall pectins accompanies pea development in response to cold. Phytochemistry. 2014;104:37–47.
Solecka D, Żebrowski J, Kacperska A. Are pectins involved in cold acclimation and de-acclimation of winter oil-seed rape plants? Ann Bot. 2008;101:521–30.
Tian GW, Chen MH, Zaltsman A, Citovsky V. Pollen-specific pectin methylesterase involved in pollen tube growth. Dev Biol. 2006;294:83–91.
Jiang L, Yang SL, **e LF, Puah CS, Zhang XQ, Yang WC, et al. VANGUARD1 encodes a pectin methylesterase that enhances pollen tube growth in the Arabidopsis style and transmitting tract. Plant Cell. 2005;17:584–96.
Sharma KD, Nayyar H. Regulatory networks in pollen development under cold stress. Front Plant Sci. 2016;7:402.
Ohnishi S, Miyoshi T, Shirai S. Low temperature stress at different flower developmental stages affects pollen development, pollination, and pod set in soybean. Environ Exp Bot. 2010;69:56–62.
Oliver SN, Van Dongen JT, Alfred SC, Mamun EA, Zhao X, Saini HS, et al. Cold-induced repression of the rice anther-specific cell wall invertase gene OSINV4 is correlated with sucrose accumulation and pollen sterility. Plant Cell Environ. 2005;28:1534051.
Nibau C, Wu HM, Cheung AY. RAC/ROP GTPases: ‘hubs’ for signal integration and diversification in plants. Trends Plant Sci. 2006;11:309–15.
Li Z, Liu D. ROPGEF1 and ROPGEF4 are functional regulators of ROP11 GTPase in ABA-mediated stomatal closure in Arabidopsis. FEBS Lett. 2012;586:1253–8.
Gu Y, Li S, Lord EM, Yang Z. Members of a novel class of Arabidopsis rho guanine nucleotide exchange factors control rho GTPase-dependent polar growth. Plant Cell. 2006;18:366–81.
Zhang Y, McCormick S. A distinct mechanism regulating a pollen-specific guanine nucleotide exchange factor for the small GTPase Rop in Arabidopsis thaliana. Proc Natl Acad Sci U S A. 2007;104:18830–5.
Gu Y, Fu Y, Dowd P, Li S, Vernoud V, Gilroy S, et al. A rho family GTPase controls actin dynamics and tip growth via two counteracting downstream pathways in pollen tubes. J Cell Biol. 2005;169:127–38.
Lee YJ, Szumlanski A, Nielsen E, Yang Z. Rho-GTPase-dependent filamentous actin dynamics coordinate vesicle targeting and exocytosis during tip growth. J Cell Biol. 2008;181:1155–68.
Hua Z, Zou C, Shiu SH, Vierstra RD. Phylogenetic comparison of F-box FBX gene superfamily within the plant kingdom reveals divergent evolutionary histories indicative of genomic drift. PLoS One. 2011;6:e16219.
Kim HS, Delaney TP. Arabidopsis SON1 is an F-Box protein that regulates a novel induced defense response independent of both salicylic acid and systemic acquired resistance. Plant Cell. 2002;14:1469–82.
Silverstein KAT, Graham MA, Paape TD, VandenBosch KA. Genome organization of more than 300 defensin-like genes in Arabidopsis. Plant Physiol. 2005;138:600–10.
Silverstein KAT, Moskal WA, Wu HC, Underwood BA, Graham MA, Town CD, et al. Small cysteine-rich peptides resembling antimicrobial peptides have been under-predicted in plants. Plant J. 2007;51:262–80.
Lyzenga WJ, Stone SL. Abiotic stress tolerance mediated by protein ubiquitination. J Exp Bot. 2012;63:599–616.
Callis J. The ubiquitination machinery of the ubiquitin system. In: Arabidopsis Book, American Society of Plant Biologists; 2014. p. e0174.
Kuroda H, Yanagawa Y, Takahashi N, Horii Y. Matsui M. A comprehensive analysis of interaction and localization of Arabidopsis SKP1-LIKE ASK and F-box FBX proteins. PLoS One. 2012;7:e50009.
Gladman NP, Marshall RS, Lee KH, Vierstra RD. The proteasome stress regulon is controlled by a pair of NAC transcription factors in Arabidopsis. Plant Cell. 2016;28:1279–96.
Tsutsui T, Kato W, Asada Y, Sako K, Sato T, Sonoda Y, et al. DEAR1, a transcriptional repressor of DREB protein that mediates plant defense and freezing stress responses in Arabidopsis. J Plant Res. 2009;122:633–43.
Klepikova AV, Logacheva MD, Dmitriev SE, Penin AA. RNA-seq analysis of an apical meristem time series reveals a critical point in Arabidopsis thaliana flower initiation. BMC Genomics. 2015;16:466.
Love MI, Huber W, Anders S. Moderated estimation of fold change and dispersion for RNA-seq data with DESeq2. Genome Biol. 2014;15:550.
Huang d W, Sherman BT, Lempicki RA. Systematic and integrative analysis of large gene lists using David bioinformatics resources. Nat Protoc. 2009;4:44–57.
Huang d W, Sherman BT, Lempicki RA. Bioinformatics enrichment tools: paths toward the comprehensive functional analysis of large gene lists. Nucleic Acids Res. 2009;37:1–13.
R Core Team. R: language and environment for statistical computing. Vienna, Austria: R Foundation for Statistical Computing; 2017.
O’Malley RC, Huang SC, Song L, Lewsey MG, Bartlett A, Nery JR, et al. Cistrome and Epicistrome features shape the regulatory DNA landscape. Cell. 2016;165:1280–92.
Acknowledgements
The authors thank American Journal Experts (https://www.aje.com/) for editing this manuscript.
Funding
The study was supported by the Russian Science Foundation (project #14–50-00150). Plant growth was performed using facilities at the Department of Genetics, Lomonosov Moscow State University. Analysis of regulatory elements was supported by the Program of fundamental research for state academies for 2013–2020 years (№ 01201363825). Database TraVA was updated with support of budgetary subsidy to IITP RAS (Laboratory of Plant Genomics). TraVA database was updated with support of budgetary subsidy to IITP RAS (Laboratory of Plant Genomics).
Availability of data and materials
The datasets generated and analyzed during the current study are available in the NCBI Sequence Read Archive repository, project ID PRJNA411947.
About this supplement
This article has been published as part of BMC Plant Biology Volume 19 Supplement 1, 2018: Selected articles from BGRS\SB-2018: plant biology. The full contents of the supplement are available online at https://bmcplantbiol.biomedcentral.com/articles/supplements/volume-19-supplement-1.
Author information
Authors and Affiliations
Contributions
AVK collected the plant materials, generated the images, performed most of the computational analyses and participated in writing the manuscript. IVK performed the transcription factor analysis. ASK prepared the data for transcription factor analysis. MDL designed and coordinated the study and contributed to sequencing as well as writing the manuscript. AAP conceived and coordinated the study, constructed the transcriptome libraries, designed the final figures and participated in the sequencing and computational analyses. All of the authors read and approved the final manuscript.
Corresponding author
Ethics declarations
Ethics approval and consent to participate
Not applicable.
Consent for publication
Not applicable.
Competing interests
The authors declare that they have no competing interests
Publisher’s Note
Springer Nature remains neutral with regard to jurisdictional claims in published maps and institutional affiliations.
Additional files
Additional file 1:
The description of the supplementary tables is located in the beginning of the xlsx file. (XLSX 15389 kb)
Additional file 2:
Hierarchical clustering of samples (PDF 8 kb)
Additional file 3:
Venn diagram of sample-specific DE genes (PDF 443 kb)
Additional file 4:
Histogram of fold enrichment in groups of GO terms enriched in common for all or at least five samples genes (PDF 7 kb)
Rights and permissions
Open Access This article is distributed under the terms of the Creative Commons Attribution 4.0 International License (http://creativecommons.org/licenses/by/4.0/), which permits unrestricted use, distribution, and reproduction in any medium, provided you give appropriate credit to the original author(s) and the source, provide a link to the Creative Commons license, and indicate if changes were made. The Creative Commons Public Domain Dedication waiver (http://creativecommons.org/publicdomain/zero/1.0/) applies to the data made available in this article, unless otherwise stated.
About this article

Cite this article
Klepikova, A.V., Kulakovskiy, I.V., Kasianov, A.S. et al. An update to database TraVA: organ-specific cold stress response in Arabidopsis thaliana. BMC Plant Biol 19 (Suppl 1), 49 (2019). https://doi.org/10.1186/s12870-019-1636-y
Published:
DOI: https://doi.org/10.1186/s12870-019-1636-y