
Abstract
Background
Multimodal imaging that combines mass spectrometry imaging (MSI) with Raman imaging is a rapidly develo** multidisciplinary analytical method used by a growing number of research groups. Computational tools that can visualize and aid the analysis of datasets by both techniques are in demand.
Results
Raman2imzML was developed as an open-source converter that transforms Raman imaging data into imzML, a standardized common data format created and adopted by the mass spectrometry community. We successfully converted Raman datasets to imzML and visualized Raman images using open-source software designed for MSI applications.
Conclusion
Raman2imzML enables both MSI and Raman images to be visualized using the same file format and the same software for a straightforward exploratory imaging analysis.
Background
In recent years, mass spectrometry imaging (MSI) has become an important analytical technique because of its capacity to spatially localize a wide range of biomolecules from plant, animal and human tissues [1]. The main advantage of MSI is its high specificity, which makes it possible to identify endogenous and exogenous compounds such as metabolites, lipids, peptides and proteins. Consequently, a considerable number of advanced data analysis tools have emerged as proprietary or open source software, with a tendency towards data format standardization [2].
However, the most common MSI instruments and sample preparation protocols have difficulty in acquiring high spatial resolution images. The spatial resolution of current acquisitions is limited to a few micrometres, which prevents the detailed molecular characterization at the micron scale so necessary for the study of microorganisms and cells [3]. Thus, it was suggested that the molecular images produced by MSI could be combined with images obtained by other high spatial resolution techniques. Several studies proposed correlating MSI with optical or fluorescence images [4,5,6] or with molecular images of spectroscopic techniques such as Fourier Transformed-Infrared Spectroscopy (FTIR) [7, 8] and Raman Spectroscopy imaging [9,10,11,12,13,14,15,16,17]. The combination of MSI and Raman imaging is becoming increasingly popular for exploring biological tissues because Raman is a non-destructive label-free technique which characterizes tissues at a submicron lateral resolution. Moreover, Raman imaging provides MSI proteomic studies with complimentary information about the chemical composition of the sample, such as lipid-to-protein ratio or changes in lipid content [10].
Nonetheless, collecting molecular information for sample characterization with two analytical instruments means that there are two different data formats, which need two different software to visualize and analyse the two datasets. A unified data format, common to all spectral imaging techniques, would benefit and promote the development of multimodal imaging applications. So far, only a few studies have visualized and analysed datasets using techniques such as spectroscopic, mass spectrometric, and X-ray diffraction data within the same software [18,19,20]. However, the data format supported in these cases was common text (.txt) which is not suitable for MSI datasets because it cannot encode a complete MSI dataset in a text file because of its large data size. The standard data format adopted by the MSI community to exchange and process data is imzML [21]. Currently instrument manufacturers and the scientific community are not using a standard file format for Raman imaging data. Due to the similarities between MSI and Raman imaging data structure, we suggest adapting Raman imaging datasets to the standardized open format imzML. In this way, MSI and Raman imaging data can be explored with the same software, so that data from different imaging experiments can be visualized more straightforwardly.
Here, we present Raman2imzML, an open-source data converter distributed as an R package which converts Raman data acquired with Renishaw and WITec instruments to imzML. We converted Raman imaging datasets collected from mouse brain tissue, and then visualized them with commonly used MSI software tools. The Raman2imzML package together with its documentation is available online (github.com).
Implementation
Raman2imzML converts text files (.txt) exported from imaging data acquired using Renishaw and WITec Raman instruments to imzML format (Fig. 1). To convert the Raman data to imzML, the Raman text file (.txt) is parsed to extract the imaging information: number of pixels, pixel coordinates and number of data points in each spectrum. Then, the imaging information is used to calculate the binary offsets according to the imzML format specification and stored in an intermediate data structure. Immediately, the binary part of the imzML format is written by directly transferring each Raman spectrum to binary stream encoded as 32-bit floating-point numbers. Finally, the Raman2imzML converter uses the imzML parser in the rMSI package [22] to write the XML part of the imzML using the imaging information (metadata) stored in the intermediate data structure. The Raman2imzML converter is distributed as an R package and includes a converter function for each instrument manufacturer to simplify user access. A Raman2imzML R project that includes a markdown and a set of example measurements from Renishaw and WITec to test the package is available in Additional files 1 and 2.

Data conversion from Raman *.txt files (exported from datasets collected with Renishaw and WITec spectrometers) into the imzML format. Coloured arrows indicate how and where the information is stored in the imzML format
The imzML format was designed to store mass spectrometry data, so it has some limitations when it is used for Raman data. Several specific words defined in the imzML ontology do not suit Raman experiments or do not exist. For example, “Raman Shift” units or diffraction grating definitions (cm−1) are nonexistent in the imzML format. Therefore, after the conversion, only numeric imaging information such as pixel position, intensity values and Raman shift axis values are preserved. It should also be pointed out that some information (integration time, excitation wavelength, etc.) is not preserved by the converter, as it is lost when the data is exported to text. Nevertheless, we suggest that the imzML specification be extended to handle imaging modalities other than MSI. This will enable future versions of Raman2imzML to perform data conversion without losing any information.
Results and discussion
Figure 2 illustrates how images produced by MSI and Raman imaging can be visualized and explored using the same software. First, we used laser desorption/ionization (LDI) MSI and Raman to acquire molecular images from consecutive histological sections of a fresh-frozen mouse brain. For MSI (Fig. 2a), we placed the tissue section onto an ITO-coated glass slide and covered the surface of the tissue with a thin Au nanolayer by sputtering [23]. For Raman measurements (Fig. 2b), we placed the consecutive tissue slice onto a CaF2 slide. Images were acquired using MALDI TOF/TOF UltrafleXtreme (50–1200 Da mass range, positive reflectron mode, large laser spot size, 500 shots per pixel, 20 μm lateral resolution) for MSI, and Renishaw (633 nm excitation wavelength, 50x objective, 2 s integration time, 50% laser power, 2 μm step) for Raman imaging. To explore both imaging datasets, we exported the MSI data using Bruker’s software flexImaging™ directly into imzML, and converted the Raman text data using Raman2imzML into the imzML format. Finally, we imported both imzML files independently, and visualized the molecular images using the rMSI package [22] although other MSI software can be used for data exploration: for example, open-source options such as Datacube Explorer [24], CARDINAL [25], MSiReader [26] and msiQuant [27] and commercial options such as SCiLS Lab and MALDIVision. For MSI (Fig. 2c), we showed the spatial distribution of ion m/z 850 (putatively annotated as a glycerophospholipid—phosphatidylcholine (38:3), experimental m/z 850.58 as [M + K]+ adduct, mass error 9 ppm) [28] on the whole mouse cerebellum. For Raman (Fig. 2d) we chose to illustrate the band at 2850 cm−1 Raman shift, which is specific for lipids [29] on one specific nerve tract in the cerebellum. The possible merger of the two molecular images (Fig. 2c and d) is shown in Fig. 3. The high spatial resolution image from Raman clearly enhances the low-resolution image obtained with MSI. When co-registration strategies are used together with multimodal imaging techniques it can accurately coordinate the relationship between pixel position and information between the two images. This way Raman2imzML could also enable hyperspectral data analysis of Raman and MSI datasets within the same software.
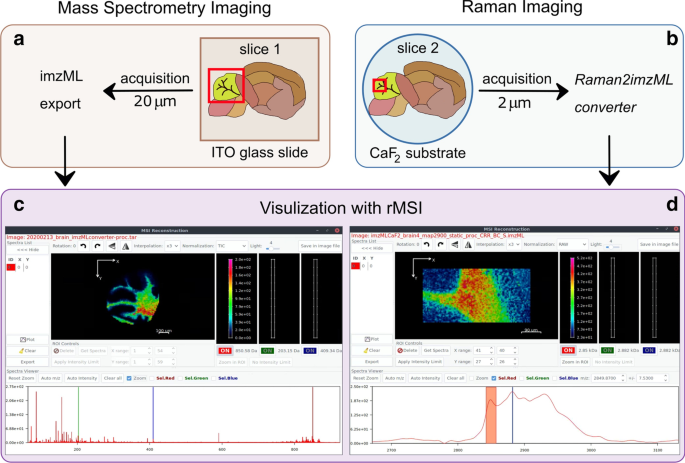
Imaging mouse brain sections: MSI (a) and Raman imaging (b) sample preparation steps and visualization within the same open-source software (rMSI) of each dataset (c and d); rMSI: R package for MSI data handling and visualization, Copyright© 2014 Pere Rafols Soler

Merged molecular images collected from MSI (20 μm lateral resolution) and Raman (2 μm lateral resolution). Molecular images are the same as Fig. 2
Conclusion
The Raman2imzML converter was created so that the same software could be used to visualize different imaging datasets, and in particular to explore Raman images using MSI software tools. We demonstrated that the similarities between Raman imaging and MSI data structures favour the use of the same data visualization software. Therefore, we recommend that a comprehensive multimodal strategy be created to facilitate the combination of spectral imaging techniques such as Raman and MSI. We propose that imzML be used as a template for a standardized file format for Raman imaging and other spectral imaging techniques, and that specific Raman ontology be included in future imzML format iterations.
Availability and requirements
-
Project name: Raman2imzML.
-
Project home page: https://github.com/LlucSF/Raman2imzML.
-
Operating system(s): Platform independent.
-
Other requirements: R, Rtools, RStudio.
-
Programming language: R and C++.
-
License: GNU GPL-3.0.
-
Any restrictions to use by non-academics: none.
-
The datasets generated and/or analysed during the current study are available in the GitHub repository, https://github.com/LlucSF/Raman2imzML. The associated additional files contains the Raman2imzML R project that includes a markdown and a set of example measurements to test this package.
Abbreviations
- MSI:
-
Mass spectrometry imaging
- FTIR:
-
Fourier transformed-infrared spectroscopy
- LDI-MSI:
-
Laser desorption/ionization mass spectrometry imaging
References
McDonnell LA, Heeren RMA. Imaging mass spectrometry. Mass Spectrom Rev. 2007;26:606–43.
Rafols P, Vilalta D, Brezmes J, Cañellas N, Del Castillo E, Yanes O, et al. Signal preprocessing, multivariate analysis and software tools for MA(LDI)-TOF mass spectrometry imaging for biological applications. Mass Spectrom Rev. 2018;37:281–306.
Buchberger AR, DeLaney K, Johnson J, Li L. Mass spectrometry imaging: a review of emerging advancements and future insights. Anal Chem. 2018;90(1):240–65.
Van De Plas R, Yang J, Spraggins J, Caprioli RM. Image fusion of mass spectrometry and microscopy: a multimodality paradigm for molecular tissue map**. Nat Methods. 2015;12(4):366–72.
Lenz B, Brink A, Siam M, De Paepe AD, Bassett S, Eichinger-Chapelon A, et al. Application of imaging techniques to cases of drug-induced crystal nephropathy in preclinical studies. Toxicol Sci. 2018;163(2):409–19.
Porta Siegel T, Hamm G, Bunch J, Cappell J, Fletcher JS, Schwamborn K. Mass spectrometry imaging and integration with other imaging modalities for greater molecular understanding of biological tissues. Mol Imaging Biol. 2018;20(6):888–901.
Rabe JH, Sammour DA, Schulz S, Munteanu B, Ott M, Ochs K, et al. Fourier transform infrared microscopy enables guidance of automated mass spectrometry imaging to predefined tissue morphologies. Sci Rep. 2018;8(1):1–11.
Neumann EK, Comi TJ, Spegazzini N, Mitchell JW, Rubakhin SS, Gillette MU, et al. Multimodal chemical analysis of the brain by high mass resolution mass spectrometry and infrared spectroscopic imaging. Anal Chem. 2018;90(19):11572–80.
Bradshaw R, Wolstenholme R, Ferguson LS, Sammon C, Mader K, Claude E, et al. Spectroscopic imaging based approach for condom identification in condom contaminated fingermarks. Analyst. 2013;138(9):2546–57.
Ryabchykov O, Popp J, Bocklitz T. Fusion of MALDI spectrometric imaging and Raman spectroscopic data for the analysis of biological samples. Front Chem. 2018;6(JUL):1–10.
Bergholt MS, Serio A, McKenzie JS, Boyd A, Soares RF, Tillner J, et al. Correlated heterospectral lipidomics for biomolecular profiling of remyelination in multiple sclerosis. ACS Central Sci. 2018;4(1):39–51.
Fagerer SR, Schmid T, Ibáñez AJ, Pabst M, Steinhoff R, Jefimovs K, et al. Analysis of single algal cells by combining mass spectrometry with Raman and fluorescence map**. Analyst. 2013;138(22):6732–6.
Jadoul L, Malherbe C, Calligaris D, Longuespée R, Gilbert B, Eppe G, et al. Matrix-assisted laser desorption/ionization mass spectrometry and Raman spectroscopy: an interesting complementary approach for lipid detection in biological tissues. Eur J Lipid Sci Technol. 2014;116(8):1080–6.
Bocklitz TW, Crecelius AC, Matthäus C, Tarcea N, Von Eggeling F, Schmitt M, et al. Deeper understanding of biological tissue: quantitative correlation of MALDI-TOF and Raman imaging. Anal Chem. 2013;85(22):10829–34.
Ahlf DR, Masyuko RN, Hummon AB, Bohn PW. Correlated mass spectrometry imaging and confocal Raman microscopy for studies of three-dimensional cell culture sections. Analyst. 2014;139(18):4578–85.
Bocklitz T, Bräutigam K, Urbanek A, Hoffmann F, von Eggeling F, Ernst G, et al. Novel workflow for combining Raman spectroscopy and MALDI-MSI for tissue based studies. Anal Bioanal Chem. 2015;407(26):7865–73.
Lasch P, Noda I. Two-dimensional correlation spectroscopy for multimodal analysis of FT-IR, Raman, and MALDI-TOF MS hyperspectral images with hamster brain tissue. Anal Chem. 2017;89(9):5008–16.
Race AM, Palmer AD, Dexter A, Steven RT, Styles IB, Bunch J. Spectral analysis: software for the masses. Anal Chem. 2016;88(19):9451–8.
Rubens U, Hoyoux R, Vanosmael L, Ouras M, Tasset M, Hamilton C, et al. Cytomine: toward an open and collaborative software platform for digital pathology bridged to molecular investigations. Proteom Clin Appl. 2019;13(1):1–4.
Foose DP, Sizemore IEP. Vespucci: a free, cross-platform tool for spectroscopic data analysis and imaging. J Open Res Softw. 2016;4(1):e4.
Schramm T, Hester A, Klinkert I, Both JP, Heeren RMA, Brunelle A, et al. ImzML—a common data format for the flexible exchange and processing of mass spectrometry imaging data. J Proteom. 2012;75(16):5106–10.
Rafols P, Torres S, Ramirez N, Del Castillo E, Yanes O, Brezmes J, et al. rMSI: an R package for MS imaging data handling and visualization. Bioinformatics. 2017;33(March):2427–8.
Ràfols P, Vilalta D, Torres S, Calavia R, Heijs B, McDonnell LA, et al. Assessing the potential of sputtered gold nanolayers in mass spectrometry imaging for metabolomics applications. PLoS One. 2018;13(12):e0208908.
Klinkert I, Chughtai K, Ellis SR, Heeren RMA. Methods for full resolution data exploration and visualization for large 2D and 3D mass spectrometry imaging datasets. Int J Mass Spectrom. 2014;362(1):40–7.
Bemis KD, Harry A, Eberlin LS, Ferreira C, Van De Ven SM, Mallick P, et al. Cardinal: an R package for statistical analysis of mass spectrometry-based imaging experiments. Bioinformatics. 2015;31(14):2418–20.
Robichaud G, Garrard KP, Barry JA, Muddiman DC. MSiReader: an open-source interface to view and analyze high resolving power MS imaging files on matlab platform. J Am Soc Mass Spectrom. 2013;24(5):718–21.
Källback P, Nilsson A, Shariatgorji M, Andrén PE. MsIQuant—quantitation software for mass spectrometry imaging enabling fast access, visualization, and analysis of large data sets. Anal Chem. 2016;88(8):4346–53.
Cerruti CD, Benabdellah F, Laprévote O, Touboul D, Brunelle A. MALDI imaging and structural analysis of rat brain lipid negative ions with 9-aminoacridine matrix. Anal Chem. 2012;84(5):2164–71.
Dybas J, Marzec KM, Pacia MZ, Kochan K, Czamara K, Chrabaszcz K, et al. Raman spectroscopy as a sensitive probe of soft tissue composition—imaging of cross-sections of various organs vs. single spectra of tissue homogenates. TrAC Trends Anal Chem. 2016;85:117–27.
Acknowledgements
The authors would like to acknowledge the technical support of Eric Pedrol Ripoll from the Scientific and Technical Resources Service at Rovira i Virgili University.
Funding
This work was supported by the Spanish Ministry of Economy and Competitivity (MINECO) pre-doctoral Grant BES-2016-076483, the Rovira i Virgili University pre-doctoral grant 2017PMF-PIPF-60, the Spanish Ministry of Science, Innovation and Universities (MICIN) project RTI2018-096061-B-I00, the Agency for Management of University and Research Grants of the Generalitat de Catalunya (AGAUR). post-doctoral Grant 2018 BP 00188 and the 2017-SGR-1119 Grant. All funding bodies contributed equally in the design of the study, the collection, analysis, and interpretation of data and in the writing of the manuscript.
Author information
Authors and Affiliations
Contributions
SAI: data curation, investigation, validation, visualization, writing—original draft. LS: methodology, software, validation, visualization, writing—original draft. MGA: conceptualization, supervision, writing—review and editing. XC: conceptualization, funding acquisition, writing—review and editing. PR: conceptualization, supervision, software, writing—review and editing. The manuscript was written through contributions of all authors. All authors read and approved the final manuscript.
Corresponding author
Ethics declarations
Ethics approval and consent to participate
Animal handling was conformed to the Guide for the Care and Use of Laboratory Animals published by the U.S. National Institutes of Health (NIH publication no. 85-23, revised 1996). All procedures were approved by the University Rovira i Virgili Bioethics Committee, as stated in Law 5/21 July 1995 passed by the Generalitat de Catalunya (Autonomous Government of Catalonia). No animals were sacrificed specifically for this work. The tissues used were unused in previous experiments.
Consent for publication
Not applicable.
Competing interests
The authors declare that they have no competing interests.
Additional information
Publisher's Note
Springer Nature remains neutral with regard to jurisdictional claims in published maps and institutional affiliations.
Supplementary information
Additional file 1.
Example datasets collected with Renishaw and WITec Raman instruments as common text files.
Additional file 2.
Markdown for using the Raman2imzML package.
Rights and permissions
Open Access This article is licensed under a Creative Commons Attribution 4.0 International License, which permits use, sharing, adaptation, distribution and reproduction in any medium or format, as long as you give appropriate credit to the original author(s) and the source, provide a link to the Creative Commons licence, and indicate if changes were made. The images or other third party material in this article are included in the article's Creative Commons licence, unless indicated otherwise in a credit line to the material. If material is not included in the article's Creative Commons licence and your intended use is not permitted by statutory regulation or exceeds the permitted use, you will need to obtain permission directly from the copyright holder. To view a copy of this licence, visit http://creativecommons.org/licenses/by/4.0/. The Creative Commons Public Domain Dedication waiver (http://creativecommons.org/publicdomain/zero/1.0/) applies to the data made available in this article, unless otherwise stated in a credit line to the data.
About this article

Cite this article
Iakab, S.A., Sementé, L., García-Altares, M. et al. Raman2imzML converts Raman imaging data into the standard mass spectrometry imaging format. BMC Bioinformatics 21, 448 (2020). https://doi.org/10.1186/s12859-020-03789-8
Received:
Accepted:
Published:
DOI: https://doi.org/10.1186/s12859-020-03789-8