
Abstract
We present a web resource MEM (Multi-Experiment Matrix) for gene expression similarity searches across many datasets. MEM features large collections of microarray datasets and utilizes rank aggregation to merge information from different datasets into a single global ordering with simultaneous statistical significance estimation. Unique features of MEM include automatic detection, characterization and visualization of datasets that includes the strongest coexpression patterns. MEM is freely available at http://biit.cs.ut.ee/mem/.
Rationale
During the last decade, the gene expression microarrays have become a standard tool in studying a large variety of biological questions [1]. Beginning from the first experiments [2], microarrays have been used for pinpointing disease-specific genes and drug targets [3, 4], uncovering signaling networks [5], describing cellular processes [6], among many other applications. While the methods for single experiment analysis are well established and popular [7], it is clear that information extracted from a single experiment is constrained by details of experimental design such as conditions and cell types. Integrating data from different experiments widens the spectrum of biological conditions and increases the power to find subtler effects.
Coexpression is one of the central ideas in gene expression analysis. The 'Guilt by association' principle states that gene coexpression might indicate shared regulatory mechanisms and roles in related biological processes. The validity of the principle is proved in several studies, see for example [8–10]. The idea can be applied in many tasks of computational biology, such as inferring functions to poorly characterized genes [9, 11, 12], discovering new putative members for metabolic pathways [12], or predicting and validating of protein-protein interactions [13, 14]. Many de novo regulatory motif discovery methods use gene expression similarity information as a primary input for identifying co-regulated genes [15, 16]. More recently, gene expression similarity search has been utilized in a pathway reconstruction study [17].
Multi-experiment coexpression analysis can be a labour-intensive and computationally challenging task. First steps involve collecting suitable datasets, data downloads, preprocessing, normalization, and gene annotation management. Then, methodological and technical questions arise, namely the integration of different datasets, merging cross-platform data, and handling ambiguous map**s between genes and probesets. Finally, the sheer size of targeted data requires efficient computational strategies or caching of pre-calculated results. The complexity of multi-experiment microarray analysis is likely its main limitation, as researchers often lack the time and resource to take on such a task. Consequently, there is a clear need for services that provide coexpression information in an easy and accessible format.
Surprisingly, the resources and tools for finding genes with similar expression profiles in multiple experiments are still rather scarce.
Microarray databases ArrayExpress [18] and Gene Expression Omnibus (GEO) [19] have implemented a data mining layer for finding and analyzing most relevant datasets, but neither yet provides a comprehensive gene coexpression search over many datasets simultaneously. Gemma is a web based resource that utilizes a global inference strategy to detect genes that have similar expression profiles in all covered datasets [20]. However, global coexpression analysis is likely to miss similarities that occur in a tissue or condition specific manner [21]. SPELL is a resource that puts a strong emphasis on selecting the appropriate datasets for the query [22]. The method identifies the subset of most relevant datasets by analyzing the coexpression of a user-defined list of genes, and uses the subset to find additional genes. Unfortunately, detecting relevant datasets relies on the user's knowledge of genes that are likely to have similar expression profiles. Furthermore, it currently features relatively small number of datasets, all of them describing yeast.
We have developed the query engine MEM that detects coexpressed genes in large platform-specific microarray collections. The Affymetrix microarray data originates from ArrayExpress and also includes datasets submitted to GEO and automatically uploaded to ArrayExpress. MEM encompasses a variety of conditions, tissues and disease states and incorporates nearly a thousand datasets for both human and mouse, as well as hundreds of datasets for other model organisms.
MEM coexpression search requires two types of input: first, the user types in a gene ID of interest, and second, chooses a collection of relevant datasets. The user may pick the datasets manually by browsing their annotations, or allow MEM to make an automatic selection based on statistical criteria such as gene variability. MEM performs the coexpression analysis individually for each dataset and assembles the final list of similar genes using a novel statistical rank aggregation algorithm. Efficient programming guarantees rapid performance of the computationally intensive real-time analysis that does not rely on precomputed or indexed data. The results are presented in highly interactive graphical format with strong emphasis on further data mining. Query results and datasets can be ordered by significance or clustered. The MEM visualization method helps highlights datasets with highest coexpression to input gene and helps the user distinguish evidence with poor or negative correlation. Datasets are additionally characterized with automatic text analysis of experiment descriptions, and represented as word clouds that highlight predominant terms. With MEM we aim to make multi-experiment coexpression analysis accessible to a wider community of researchers.
MEM web interface
Input
Primary input
The primary input of MEM is a single query gene that acts as the template pattern for the coexpression search. The tool recognizes common gene identifiers and automatically retrieves corresponding probesets, the conversion is based on g: Profiler [23] and Ensembl [24] ID map**s. When several probesets link to a gene, the user needs to choose one of the probesets for further analysis.
Second, the user needs to select the collection of datasets where similarities between expression profiles are detected (the search space). ArrayExpress datasets are organized into platform-specific collections and the user may choose perform the search over all datasets of a specific platform. The search space may be further narrowed by browsing dataset annotations and composing a collection that covers a specific disease or tissue type.
Dataset selection
In multi-experiment coexpression analysis, some individual datasets may produce noisy or even entirely random results that are either caused by poor data quality or low expression levels of the query gene. The quality of the analysis can be improved considerably by eliminating the datasets that create a noise bias for the query gene. Low dataset-wide variability of expression levels is one of the key indicators of spurious results. Minute changes in gene expression are often caused by experimental noise rather than cellular mechanics. Therefore, corresponding similarity searches are likely to be less informative about gene function.
We have included a standard deviation filter in the MEM interface that allows the users to detect and disregard datasets where the variability of the query gene is low. Based on extensive simulations detailed in the Methods section, we conclude that the standard deviation σ = 0.29 is a reasonable threshold for distinguishing informative datasets. The above filter holds for the entire analysis since all related datasets are normalized and preprocessed using the same algorithm.
Search algorithm parameters
The first step of MEM multi-experiment coexpression analysis detects the most similar candidate genes for each individual dataset. The most important parameter for this stage is the distance measure that defines the similarity between expression profiles and has a significant impact on the contents and interpretation of results. Pearson correlation is the default distance measure in MEM. It evaluates the dynamic similarity of expression profiles and has become a standard method of measuring coexpression [25]. Another useful measure is the anti-correlation distance that detects inverse expression patterns, such as genes responding to repressor activity. For example, anti-correlation queries have been used to validate predicted micro RNA targets [26]. Absolute correlation distance is a combination of the above measures, as it detects both direct and inverse similarity.
After detecting the most similar genes in individual datasets, we apply a novel rank aggregation algorithm that merges candidates of different datasets and creates the final list of coexpressed genes. The rank aggregation algorithm assigns a P-value to each gene, in order to evaluate its similarity to the query gene across the given collection of datasets. Statistically, the P-value reflects the likelihood of the gene appearing with certain observed ranks in the datasets if the similarity lists were shuffled randomly. Selecting the expression profiles with most significant P-values accurately retrieves genes with high expression similarity and functional relevance to the query gene (Figure 1).
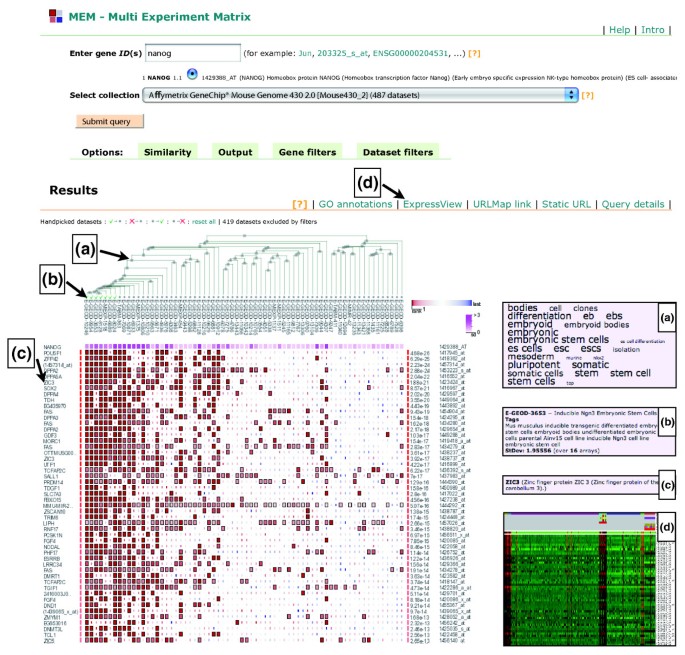
MEM user interface and results for the transcription factor NANOG. The top of the page contains controls for the query: gene input field, dataset selection and advanced options. Bottom of the page shows the results of the query. The genes, which are displayed as rows, are ordered by multi-experiment similarity to the query gene. Additionally, the single experiment similarity ranks are displayed as a matrix of colored squares, where red and blue denote small and large ranks, respectively. The larger squares indicate the ranks that contributed to the final P-value. Each element corresponds to a experiment and the columns are clustered. Hovering over the results brings up context specific information: (a) word cloud that characterizes the corresponding experiments; (b) single dataset annotations; (c) gene names with short descriptions. The row of links above the results facilitates the further analysis of results. For example, the user can visualize the expression of selected datasets (marked with green ticks) as a heat map (d).
Output
The principal output of MEM is a ranked list of genes that are coexpressed with the query gene in the provided datasets. For each resulting gene, MEM provides a P-value that reflects the significance of its expression similarity to the query gene across the collection on analyzed datasets. A wealth of interesting information is presented in the graphical rank matrix (Figure 1). Each column of the matrix stands for a dataset, each row represents a gene, and each matrix element reflects the individual similarity rank for the given gene in the given dataset. Visual inspection of the rank matrix allows the researcher to detect patterns of correlation across datasets and spot significantly stronger coexpression profiles. The rank aggregation algorithm provides a natural cutoff between informative and non-informative ranks for each gene. Colors and cell size is used to highlight datasets where the given gene was particularly similar to the query gene and hence contributed significantly to the final P-value.
Genes with the greatest similarity rankings are frequently in strong correlation only within a relatively small fraction of datasets that are biologically relevant to gene function. If the contributing datasets can be related in the context of experimental design, one may learn additional information about the query gene and its association to the resulting genes. Columns of the rank matrix are clustered hierarchically, so that datasets with similar correlation patterns are grouped together using a tree visualization, and datasets with most impact are aligned to the left. While the default policy is to filter datasets based on the standard deviation criterion, one may take advantage of the high contribution of few datasets and manually remove experiments that have little impact on the final list of correlated genes. Single clicks on datasets or tree nodes toggle whether selected experiments or entire experiment groups are regarded in downstream analysis.
A text mining technique called word cloud gives a compact semantic overview of a selected group of datasets through the descriptions of experimental designs. The word cloud detects keywords that are enriched in the experimental descriptions of the group, and uses different font sizes to highlight terms with strong statistical significance. One may study the experiment descriptions of single datasets and dataset clusters by moving the mouse over the dataset clustering tree.
Additional features of the tool reveal finer details of underlying data and create multiple pointers for further analysis. Besides coexpression associations in the rank matrix, MEM also displays standard heat maps with expression profiles and experimental details of individual datasets. The heat maps provide an easy visual validation of detected coexpression patterns. MEM includes filters that constrain the output to certain genes and allow the researcher to seek answers to interesting problems. For instance, one may study the association of the query gene in relation to a certain pathway or biological process, by comparing the expression patterns of its members. The URLMap feature provides easy access to external resources, as it automatically links resulting genes to multiple genomic databases [27]. Coexpressed genes can be directed to the g: Profiler toolset for functional enrichment analysis of Gene Ontology terms, pathways and cis-regulatory motifs [23].
Case studies
MEM query with embryonic stem cell regulator NANOG retrieves ES cells related genes and datasets
The homeobox transcription factor NANOG is a key regulator of differentiation and pluripotency maintenance in mammalian embryonic stem cells [28, 29]. NANOG forms a complex circuitry together with the factors OCT4 and SOX2 and is involved in the combinatorial regulation of a range of downstream developmental processes.
We demonstrate the power of the MEM toolset by analyzing the genes that show strong coexpression patterns with NANOG across multiple datasets (see Figure 1). We chose a collection of 487 mouse datasets of the Affymetrix 430-2 platform, as the platform includes the largest amount of ES cells related experiments. After applying the default standard deviation filter (σ = 0.29), MEM automatically removed 419 datasets where the expression level of NANOG was insufficient for coexpression analysis. As the role of NANOG role is believed to be restricted to embryonic stem cells only, datasets covering other tissues and conditions are expectedly uninformative and provide no results of statistical significance (data not shown). On the other hand, datasets considered relevant by MEM appear to be related to the role of NANOG. Keyword analysis of experimental annotations reveals enriched terms like 'embryonic', 'pluripotent', 'stem cell' and so on (see word cloud, Figure 1a).
In response to the NANOG query, MEM retrieves a list of coexpressed genes that appear to be functionally related to embryonic stem cells. Enrichment analysis with top 50 probesets reveals important functional terms from Gene Ontology (for example, stem cell development P < 10-12 and regulation of transcription P < 10-6). The top list includes key transcription factors OCT4 (position 1) and SOX2 (position 7) as well as other genes with known roles in stem cell regulation and maintenance of pluripotency. For instance, UTF1 is a ES cell specific transcriptional coactivator [30], while DPPA2/3/4/5A are nuclear factors with a role in regulating pluripotency [31]. NODAL is a member of the TGF-beta superfamily whose signaling is required for maintaining pluripotency in human embryonic stem cells [32]. Signaling of TDGF (Cripto) in a NODAL-dependent manner directs the differentiation and fate determination of ES cells [33]. TGF3 is another growth factor that has been shown to involve in the patterning of the anterior-posterior axis and exhibit signaling similar to NODAL [34].
In a previous study, Sharov et al. inferred direct targets of NANOG by computational integration of gene expression and chromatin immunoprecipitation data [ Rank aggregation is the heart of MEM coexpression analysis. It uses the statistical distribution of orderings to integrate individual lists of similar genes into final lists with significance P-values for each gene. The rank aggregation problem has been studied mainly in the context of voting and social choice, but there are also several bioinformatics applications, for example, [51, 52]. Most classical methods assume that each individual ranking is reasonable and should be taken into account in composing the final ordering. However, in the case of gene coexpression analysis, some rankings include considerable amounts of noise as they are derived from genes and conditions with low variation. In order to overcome this, we first identify reliable gene lists that are based on sufficient variation, and then compute the rank aggregation based on the limited set of lists. The input of rank aggregation is a collection of ordered lists, where every element in a list corresponds to a gene in a specific experiment, showing the rank of similarity to the query gene g*, relative to all other genes in the organism. We normalize the lists into the range [0.1], by dividing each individual rank by the maximal rank, that is, the number of genes in the microarray platform. We transform the ranks so that for each gene g
i
, we have a rank vector r(g*, g
i
) = [ A straightforward solution for rank aggregation involves reordering the genes g
i
based on their arithmetic means of individual ranks r(g*, g
i
). Unfortunately this approach is rather sensitive to noise, since the mean is heavily influenced by large ranks that indicate no strong correlation. Geometric mean is more sensitive to small ranks and robust to fluctuations among large uninformative ranks. An alternative and empirically more successful approach uses trimmed mean that only considers k smallest elements, but requires the estimation of the parameter k. We developed a statistical strategy for robust rank aggregation that overcomes the problems of mean-based methods and allows us to evaluate the statistical significance of detected similarity. As a null hypothesis, we consider a model ranking where similar genes are permuted randomly and the distribution of each rank vector r(g*, g
i
) is approximately uniform. In the biological case of strong coexpression, we observe an unexpectedly large amount of small ranks between genes with correlated expression patterns, so that the distribution of r(g*, g
i
) is skewed towards small values and significantly different from a uniform distribution. We can reorder the rank vector r(g*, g
i
) increasingly to gain the vector of order statistics The final similarity score ρ between g* and g
i
is defined as follows: In other words, for every value of k, we compute the P-value for each rank statistic r(k)being randomly as small as observed in the dataset, and as a final score we use the minimal P-value. The final ρ score itself is not a P-value, since it is a minimum of P-values. Still, we may use a multiple testing correction to remove false positives that occur due to several independent tests. As we calculate the ρ scores for each gene, we actually find a P-value corresponding to each rank matrix element. According to Bonferroni correction for multiple testing, an individual P-value is significant if it is smaller than the desired significance level after multiplication by the number of rows and columns of the rank matrix. We cannot use any less stringent criteria for correction, since P-values for the same gene are strongly correlated. As a byproduct of the above computation, we gain information about the datasets that contain significant coexpression between any two genes. A dataset with a ranking All data used in the analyses has been obtained from ArrayExpress and it also includes datasets that were originally submitted to GEO. We only included Affymetrix datasets where raw data was available, and performed a uniform Robust Multi-array Average (RMA) normalization [53] with the Bioconductor affy package [54] using the default parameters. MEM also includes biological annotations of the datasets as annotated according to the Minimum Information About a Microarray Experiment (MIAME) standard [1]. The annotations are used for building word clouds and annotation tracks in heat map visualization of gene expression data. We performed a simulation study to find the threshold for query gene variation that would best identify the datasets where the gene has meaningful expression patterns. All the experiments in MEM are normalized and preprocessed the same way, so we may compute a uniform threshold that applies to all datasets. In the simulation, we chose random sets of 2000 genes and 140 experiments on human Affymetrix platform HG-U133A, and calculated the standard deviation for each gene in each experiment. We also performed a MEM query with each of the genes and used similarity score cutoff that yielded on average 20 genes per query. Now we tried several thresholds for the standard deviation and in each case we calculated correlation between the number of experiments exceeding the threshold and the number of genes in the result of the query. We achieved strongest coexpression patterns between the query genes and the resulting genes when using a standard deviation cutoff between 0.25 and 0.39, while the peak performance was observed at the threshold 0.29 (Additional file 4). MEM uses word clouds to display aggregated annotations of multiple datasets. As a first step in generating the word clouds, we process textual annotations of each dataset to extract words and multi-word expressions. Out of all the words present in the dataset description we pick only nouns, adjectives and some other matching predefined patterns. Selected words are then normalized to ignore inflected forms (for example, gene, genes) using WordNet lemmatiser [55]. Besides single words, we also extract noun and adjective phrases. Syntactic analysis is performed using MedPost part-of-speech tagger [56]. Next, for a given group of datasets, we figure out a set of descriptive terms (words and phrases) that are over-represented in this group, compared to all the available datasets. We use hypergeometric P-value to identify such group-specific terms. The word cloud is then composed out of the terms with the lowest P-value. Within the word cloud, font size depicts their extent of over-representation of the term in the corresponding group of datasets. The following additional data are available with the online version of this paper. Additional file 1 is a table listing datasets used for network reconstruction. The datasets were all on mouse platform Affymetrix U74Av2. In addition the analysis included an unpublished dataset that cannot be found in databases. Additional file 2 is a table listing datasets used for MCM complex study. Additional file 3 is a table listing the 116 genes that occur in more than two of the six cohorts of subunits MCM1-MCM6, where each cohort contains 100 probesets with most correlation relative to the corresponding subunit. Additional file 4 is a figure describing the selection of standard deviation cutoff. The figure shows correlation between number of significant query results and the number of datasets where the query gene standard deviation exceeds certain threshold. The maximal correlation is achieved when the threshold is 0.29.Methods
Rank aggregation
 , ...,
  ] where
  corresponds to the position of g
i
in the query on dataset j.
corresponds to the position of g
i
in the query on dataset j. which range from the smallest to the largest value of r(g*, g
i
). Assuming the null hypothesis, we can use the binomial distribution to calculate the probability that k or more ranks are smaller than
which range from the smallest to the largest value of r(g*, g
i
). Assuming the null hypothesis, we can use the binomial distribution to calculate the probability that k or more ranks are smaller than  , for every k:
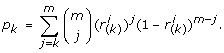
 that is smaller than the ranking that gave rise to ρ(g*, g
i
) can be considered significant. This feature allows us to highlight the contributions of different datasets into the final similarity ranking, and observe interesting patterns between related datasets. The score ρ also has the advantage of being non-parametric, as it makes no requirements on the number of input datasets or the magnitude of relevant ranks. In a way our ρ-score represents a natural balance between two scenarios: a gene that strongly correlates with the query gene in a small number of samples, and a gene that shows weak correlation in a large range of samples.
that is smaller than the ranking that gave rise to ρ(g*, g
i
) can be considered significant. This feature allows us to highlight the contributions of different datasets into the final similarity ranking, and observe interesting patterns between related datasets. The score ρ also has the advantage of being non-parametric, as it makes no requirements on the number of input datasets or the magnitude of relevant ranks. In a way our ρ-score represents a natural balance between two scenarios: a gene that strongly correlates with the query gene in a small number of samples, and a gene that shows weak correlation in a large range of samples.Microarray data
Standard deviation threshold selection
Dataset annotation word cloud
Additional files
Abbreviations
- ES:
-
embryonic stem
- GEO:
-
gene expression omnibus
- GO:
-
gene ontology
- KEGG:
-
Kyoto Encyclopedia of Genes and Genomes
- MCL:
-
Markov cluster
- MCM:
-
mini chromosome maintenance
- MEM:
-
multi experiment matrix
- MIAME:
-
minimum information about a microarray experiment
- ORC:
-
origin recognition complex
- preRC:
-
pre-replicative complex
- RMA:
-
robust multi-array average.
References
Brazma A, Hingamp P, Quackenbush J, Sherlock G, Spellman P, Stoeckert C, Aach J, Ansorge W, Ball CA, Causton HC, Gaasterland T, Glenisson P, Holstege FC, Kim IF, Markowitz V, Matese JC, Parkinson H, Robinson A, Sarkans U, Schulze-Kremer S, Stewart J, Taylor R, Vilo J, Vingron M: Minimum information about a microarray experiment (MIAME)-toward standards for microarray data. Nat Genet. 2001, 29: 365-371. 10.1038/ng1201-365.
Schena M, Shalon D, Davis RW, Brown PO: Quantitative monitoring of gene expression patterns with a complementary DNA microarray. Science. 1995, 270: 467-470. 10.1126/science.270.5235.467.
Zhang L, Zhou W, Velculescu VE, Kern SE, Hruban RH, Hamilton SR, Vogelstein B, Kinzler KW: Gene expression profiles in normal and cancer cells. Science. 1997, 276: 1268-1272. 10.1126/science.276.5316.1268.
Welsh JB, Sapinoso LM, Su AI, Kern SG, Wang-Rodriguez J, Moskaluk CA, Frierson HF, Hampton GM: Analysis of gene expression identifies candidate markers and pharmacological targets in prostate cancer. Cancer Res. 2001, 61: 5974-5978.
Segal E, Shapira M, Regev A, Pe'er D, Botstein D, Koller D, Friedman N: Module networks: identifying regulatory modules and their condition-specific regulators from gene expression data. Nat Genet. 2003, 34: 166-176. 10.1038/ng1165.
Spellman PT, Sherlock G, Zhang MQ, Iyer VR, Anders K, Eisen MB, Brown PO, Botstein D, Futcher B: Comprehensive identification of cell cycle-regulated genes of the yeast Saccharomyces cerevisiae by microarray hybridization. Mol Biol Cell. 1998, 9: 3273-3297.
Allison DB, Cui X, Page GP, Sabripour M: Microarray data analysis: from disarray to consolidation and consensus. Nat Rev Genet. 2006, 7: 55-65. 10.1038/nrg1749.
Wolfe CJ, Kohane IS, Butte AJ: Systematic survey reveals general applicability of "guilt-by-association" within gene coexpression networks. BMC Bioinformatics. 2005, 6: 227-10.1186/1471-2105-6-227.
Hughes TR, Marton MJ, Jones AR, Roberts CJ, Stoughton R, Armour CD, Bennett HA, Coffey E, Dai H, He YD, Kidd MJ, King AM, Meyer MR, Slade D, Lum PY, Stepaniants SB, Shoemaker DD, Gachotte D, Chakraburtty K, Simon J, Bard M, Friend SH: Functional discovery via a compendium of expression profiles. Cell. 2000, 102: 109-126. 10.1016/S0092-8674(00)00015-5.
Stuart JM, Segal E, Koller D, Kim SK: A gene-coexpression network for global discovery of conserved genetic modules. Science. 2003, 302: 249-255. 10.1126/science.1087447.
Wilson BJ, Giguère V: Identification of novel pathway partners of p68 and p72 RNA helicases through Oncomine meta-analysis. BMC Genomics. 2007, 8: 419-10.1186/1471-2164-8-419.
Basso K, Margolin AA, Stolovitzky G, Klein U, Dalla-Favera R, Califano A: Reverse engineering of regulatory networks in human B cells. Nat Genet. 2005, 37: 382-390. 10.1038/ng1532.
Rhodes DR, Tomlins SA, Varambally S, Mahavisno V, Barrette T, Kalyana-Sundaram S, Ghosh D, Pandey A, Chinnaiyan AM: Probabilistic model of the human protein-protein interaction network. Nat Biotechnol. 2005, 23: 951-959. 10.1038/nbt1103.
Kemmeren P, van Berkum NL, Vilo J, Bijma T, Donders R, Brazma A, Holstege FCP: Protein interaction verification and functional annotation by integrated analysis of genome-scale data. Mol Cell. 2002, 9: 1133-1143. 10.1016/S1097-2765(02)00531-2.
Pennacchio LA, Loots GG, Nobrega MA, Ovcharenko I: Predicting tissue-specific enhancers in the human genome. Genome Res. 2007, 17: 201-211. 10.1101/gr.5972507.
Brazma A, Jonassen I, Vilo J, Ukkonen E: Predicting gene regulatory elements in silico on a genomic scale. Genome Res. 1998, 8: 1202-1215.
Adler P, Peterson H, Agius P, Reimand J, Vilo J: Ranking genes by their co-expression to subsets of pathway members. Ann NY Acad Sci. 2009, 1158: 1-13. 10.1111/j.1749-6632.2008.03747.x.
Parkinson H, Kapushesky M, Shojatalab M, Abeygunawardena N, Coulson R, Farne A, Holloway E, Kolesnykov N, Lilja P, Lukk M, Mani R, Rayner T, Sharma A, William E, Sarkans U, Brazma A: ArrayExpress - a public database of microarray experiments and gene expression profiles. Nucleic Acids Res. 2007, 35: D747-D750. 10.1093/nar/gkl995.
Barrett T, Troup DB, Wilhite SE, Ledoux P, Rudnev D, Evangelista C, Kim IF, Soboleva A, Tomashevsky M, Edgar R: NCBI GEO: mining tens of millions of expression profiles - database and tools update. Nucleic Acids Res. 2007, 35: D760-D765. 10.1093/nar/gkl887.
Lee HK, Hsu AK, Sajdak J, Qin J, Pavlidis P: Coexpression analysis of human genes across many microarray data sets. Genome Res. 2004, 14: 1085-1094. 10.1101/gr.1910904.
Huttenhower C, Hibbs M, Myers C, Troyanskaya OG: A scalable method for integration and functional analysis of multiple microarray datasets. Bioinformatics. 2006, 22: 2890-2897. 10.1093/bioinformatics/btl492.
Hibbs MA, Hess DC, Myers CL, Huttenhower C, Li K, Troyanskaya OG: Exploring the functional landscape of gene expression: directed search of large microarray compendia. Bioinformatics. 2007, 23: 2692-2699. 10.1093/bioinformatics/btm403.
Reimand J, Kull M, Peterson H, Hansen J, Vilo J: g: Profiler - a web-based toolset for functional profiling of gene lists from large-scale experiments. Nucleic Acids Res. 2007, 35: W193-W200. 10.1093/nar/gkm226.
Hubbard TJP, Aken BL, Ayling S, Ballester B, Beal K, Bragin E, Brent S, Chen Y, Clapham P, Clarke L, Coates G, Fairley S, Fitzgerald S, Fernandez-Banet J, Gordon L, Graf S, Haider S, Hammond M, Holland R, Howe K, Jenkinson A, Johnson N, Kahari A, Keefe D, Keenan S, Kinsella R, Kokocinski F, Kulesha E, Lawson D, Longden I, et al: Ensembl 2009. Nucleic Acids Res. 2009, 37: D690-D697. 10.1093/nar/gkn828.
Hardin J, Mitani A, Hicks L, Vankoten B: A robust measure of correlation between two genes on a microarray. BMC Bioinformatics. 2007, 8: 220-10.1186/1471-2105-8-220.
Gennarino VA, Sardiello M, Avellino R, Meola N, Maselli V, Anand S, Cutillo L, Ballabio A, Banfi S: MicroRNA target prediction by expression analysis of host genes. Genome Res. 2009, 19: 481-490. 10.1101/gr.084129.108.
Vilo J, Kapushesky M, Kemmeren P, Sarkans U, Brazma A: Expression profiler. The Analysis of Gene Expression Data: Methods and Software. 2003, New York: Springer
Boyer LA, Lee TI, Cole MF, Johnstone SE, Levine SS, Zucker JP, Guenther MG, Kumar RM, Murray HL, Jenner RG, Gifford DK, Melton DA, Jaenisch R, Young RA: Core transcriptional regulatory circuitry in human embryonic stem cells. Cell. 2005, 122: 947-956. 10.1016/j.cell.2005.08.020.
Loh YH, Wu Q, Chew JL, Vega VB, Zhang W, Chen X, Bourque G, George J, Leong B, Liu J, Wong KY, Sung KW, Lee CWH, Zhao XD, Chiu KP, Lipovich L, Kuznetsov VA, Robson P, Stanton LW, Wei CL, Ruan Y, Lim B, Ng HH: The Oct4 and Nanog transcription network regulates pluripotency in mouse embryonic stem cells. Nat Genet. 2006, 38: 431-440. 10.1038/ng1760.
Okuda A, Fukushima A, Nishimoto M, Orimo A, Yamagishi T, Nabeshima Y, Kuro-o M, i Nabeshima Y, Boon K, Keaveney M, Stunnenberg HG, Muramatsu M: UTF1, a novel transcriptional coactivator expressed in pluripotent embryonic stem cells and extra-embryonic cells. EMBO J. 1998, 17: 2019-2032. 10.1093/emboj/17.7.2019.
Maldonado-Saldivia J, Bergen van den J, Krouskos M, Gilchrist M, Lee C, Li R, Sinclair AH, Surani MA, Western PS: Dppa2 and Dppa4 are closely linked SAP motif genes restricted to pluripotent cells and the germ line. Stem Cells. 2007, 25: 19-28. 10.1634/stemcells.2006-0269.
James D, Levine AJ, Besser D, Hemmati-Brivanlou A: TGFbeta/activin/nodal signaling is necessary for the maintenance of pluripotency in human embryonic stem cells. Development. 2005, 132: 1273-1282. 10.1242/dev.01706.
Parisi S, D'Andrea D, Lago CT, Adamson ED, Persico MG, Minchiotti G: Nodal-dependent Cripto signaling promotes cardiomyogenesis and redirects the neural fate of embryonic stem cells. J Cell Biol. 2003, 163: 303-314. 10.1083/jcb.200303010.
Chen C, Ware SM, Sato A, Houston-Hawkins DE, Habas R, Matzuk MM, Shen MM, Brown CW: The Vg1-related protein Gdf3 acts in a Nodal signaling pathway in the pre-gastrulation mouse embryo. Development. 2006, 133: 319-329. 10.1242/dev.02210.
Sharov AA, Masui S, Sharova LV, Piao Y, Aiba K, Matoba R, **n L, Niwa H, Ko MSH: Identification of Pou5f1, Sox2, and Nanog downstream target genes with statistical confidence by applying a novel algorithm to time course microarray and genome-wide chromatin immunoprecipitation data. BMC Genomics. 2008, 9: 269-10.1186/1471-2164-9-269.
Zhou XJ, Kao MCJ, Huang H, Wong A, Nunez-Iglesias J, Primig M, Aparicio OM, Finch CE, Morgan TE, Wong WH: Functional annotation and network reconstruction through cross-platform integration of microarray data. Nat Biotechnol. 2005, 23: 238-243. 10.1038/nbt1058.
Soinov LA, Krestyaninova MA, Brazma A: Towards reconstruction of gene networks from expression data by supervised learning. Genome Biol. 2003, 4: R6-10.1186/gb-2003-4-1-r6.
Guthke R, Möller U, Hoffmann M, Thies F, Töpfer S: Dynamic network reconstruction from gene expression data applied to immune response during bacterial infection. Bioinformatics. 2005, 21: 1626-1634. 10.1093/bioinformatics/bti226.
van Dongen S: Graph clustering by flow simulation. PhD thesis. 2000, University of Utrecht
Reimand J, Tooming L, Peterson H, Adler P, Vilo J: GraphWeb: mining heterogeneous biological networks for gene modules with functional significance. Nucleic Acids Res. 2008, 36: W452-W459. 10.1093/nar/gkn230.
Kelly TJ, Brown GW: Regulation of chromosome replication. Annu Rev Biochem. 2000, 69: 829-880. 10.1146/annurev.biochem.69.1.829.
Tye BK: MCM proteins in DNA replication. Annu Rev Biochem. 1999, 68: 649-686. 10.1146/annurev.biochem.68.1.649.
Blow JJ, Dutta A: Preventing re-replication of chromosomal DNA. Nat Rev Mol Cell Biol. 2005, 6: 476-486. 10.1038/nrm1663.
Davies RJ, Freeman A, Morris LS, Bingham S, Dilworth S, Scott I, Laskey RA, Miller R, Coleman N: Analysis of minichromosome maintenance proteins as a novel method for detection of colorectal cancer in stool. Lancet. 2002, 359: 1917-1919. 10.1016/S0140-6736(02)08739-1.
Feng D, Tu Z, Wu W, Liang C: Inhibiting the expression of DNA replication-initiation proteins induces apoptosis in human cancer cells. Cancer Res. 2003, 63: 7356-7364.
Gonzalez MA, Pinder SE, Callagy G, Vowler SL, Morris LS, Bird K, Bell JA, Laskey RA, Coleman N: Minichromosome maintenance protein 2 is a strong independent prognostic marker in breast cancer. J Clin Oncol. 2003, 21: 4306-4313. 10.1200/JCO.2003.04.121.
Johnson DG, Cress WD, Jakoi L, Nevins JR: Oncogenic capacity of the E2F1 gene. Proc Natl Acad Sci USA. 1994, 91: 12823-12827. 10.1073/pnas.91.26.12823.
DeGregori J, Kowalik T, Nevins JR: Cellular targets for activation by the E2F1 transcription factor include DNA synthesis- and G1/S-regulatory genes. Mol Cell Biol. 1995, 15: 4215-4224.
Hollstein M, Sidransky D, Vogelstein B, Harris CC: p53 mutations in human cancers. Science. 1991, 253: 49-53. 10.1126/science.1905840.
Kasashima K, Nakamura Y, Kozu T: Altered expression profiles of microRNAs during TPA-induced differentiation of HL-60 cells. Biochem Biophys Res Commun. 2004, 322: 403-410. 10.1016/j.bbrc.2004.07.130.
Pihur V, Datta S, Datta S: Finding common genes in multiple cancer types through meta-analysis of microarray experiments: a rank aggregation approach. Genomics. 2008, 92: 400-403. 10.1016/j.ygeno.2008.05.003.
Lin S, Ding J: Integration of ranked lists via cross entropy Monte Carlo with applications to mRNA and microRNA studies. Biometrics. 2009, 65: 9-18. 10.1111/j.1541-0420.2008.01044.x.
Irizarry RA, Bolstad BM, Collin F, Cope LM, Hobbs B, Speed TP: Summaries of Affymetrix GeneChip probe level data. Nucleic Acids Res. 2003, 31: e15-10.1093/nar/gng015.
Gautier L, Cope L, Bolstad BM, Irizarry RA: Affy-analysis of Affymetrix GeneChip data at the probe level. Bioinformatics. 2004, 20: 307-315. 10.1093/bioinformatics/btg405.
Miller G, Beckwith R, Fellbaum C, Gross D, Miller K: Five papers on WordNet. CSL Report 43. 1990, Cognitive Science Laboratory, Princeton University
Smith L, Rindflesch T, Wilbur WJ: MedPost: a part-of-speech tagger for bioMedical text. Bioinformatics. 2004, 20: 2320-2321. 10.1093/bioinformatics/bth227.
Acknowledgements
Authors wish to thank Tambet Arak for technical ingenuity and support, Sven Laur for proofreading, Toomas Neuman for initial biological setup and Misha Kapushesky for help in ArrayExpress data download. The financial support was provided by EU FP6 grants (ENFIN LSHG-CT-2005-518254 and COBRED LSHB-CT-2007-037730), ERDF through the Estonian Centre of Excellence in Computer Science project and Estonian Science Foundation ETF7427. JR acknowledges funding from Ustus Agur and Artur Lind foundations.
Author information
Authors and Affiliations
Corresponding author
Additional information
Authors' contributions
PA and MK implemented the resource. RK and PA developed the methods for the query. AT provided the annotation word clouds. PA, RK and JR performed the case studies. RK and JR drafted the manuscript. JV and HP conceived the study and provided general guidance. All authors read and approved the final manuscript.
Priit Adler, Raivo Kolde contributed equally to this work.
Electronic supplementary material
13059_2009_2289_MOESM1_ESM.xls
Additional file 1: The datasets were all on mouse platform Affymetrix U74Av2. In addition the analysis included an unpublished dataset that cannot be found in databases. (XLS 8 KB)
13059_2009_2289_MOESM3_ESM.xls
Additional file 3: A table listing the 116 genes that occur in more than two of the six cohorts of subunits MCM1-MCM6, where each cohort contains 100 probesets with most correlation relative to the corresponding subunit. (XLS 16 KB)
13059_2009_2289_MOESM4_ESM.pdf
Additional file 4: The figure shows correlation between number of significant query results and the number of datasets where the query gene standard deviation exceeds certain threshold. The maximal correlation is achieved when the threshold is 0.29. (PDF 4 KB)
Authors’ original submitted files for images
Below are the links to the authors’ original submitted files for images.
Rights and permissions
This article is published under an open access license. Please check the 'Copyright Information' section either on this page or in the PDF for details of this license and what re-use is permitted. If your intended use exceeds what is permitted by the license or if you are unable to locate the licence and re-use information, please contact the Rights and Permissions team.
About this article
Cite this article
Adler, P., Kolde, R., Kull, M. et al. Mining for coexpression across hundreds of datasets using novel rank aggregation and visualization methods. Genome Biol 10, R139 (2009). https://doi.org/10.1186/gb-2009-10-12-r139
Received:
Revised:
Accepted:
Published:
DOI: https://doi.org/10.1186/gb-2009-10-12-r139