
Abstract
Genome sequencing has shown strong capabilities in the initial stages of the COVID-19 pandemic such as pathogen identification and virus preliminary tracing. While the rapid acquisition of SARS-CoV-2 genome from clinical specimens is limited by their low nucleic acid load and the complexity of the nucleic acid background. To address this issue, we modified and evaluated an approach by utilizing SARS-CoV-2-specific amplicon amplification and Oxford Nanopore PromethION platform. This workflow started with the throat swab of the COVID-19 patient, combined reverse transcript PCR, and multi-amplification in one-step to shorten the experiment time, then can quickly and steadily obtain high-quality SARS-CoV-2 genome within 24 h. A comprehensive evaluation of the method was conducted in 42 samples: the sequencing quality of the method was correlated well with the viral load of the samples; high-quality SARS-CoV-2 genome could be obtained stably in the samples with Ct value up to 39.14; data yielding for different Ct values were assessed and the recommended sequencing time was 8 h for samples with Ct value of less than 20; variation analysis indicated that the method can detect the existing and emerging genomic mutations as well; Illumina sequencing verified that ultra-deep sequencing can greatly improve the single read error rate of Nanopore sequencing, making it as low as 0.4/10,000 bp. In summary, high-quality SARS-CoV-2 genome can be acquired by utilizing the amplicon amplification and it is an effective method in accelerating the acquisition of genetic resources and tracking the genome diversity of SARS-CoV-2.
Introduction
Since the first case of coronavirus disease 2019 (COVID-19) was reported as "pneumonia of unknown etiology" in early December 2019, this new coronavirus pneumonia epidemic caused by severe acute respiratory syndrome coronaviruses 2 (SARS-CoV-2), has spread around the world. As of Feb 24, 2021, there were 223 epidemic countries in the world, with 111,762,965 confirmed cases and 2,479,678 deaths (https://www.who.int/emergencies/diseases/novel-coronavirus-2019). The virus can infect people of almost all ages (Chen et al. 2018) (with the parameters of -x map-ont) based on the genome sequence of IVDC-HB-01 (GISAID accession number: EPI_ISL_402119), and filtered by SAMtools (Li et al. 2009) (with the parameters of -F 3840 -q 60). Then the number of map** reads, coverage length, and depth information of every site were obtained using the SAMtools (Li et al. 2009). Then the map** rate of reads was calculated from the previous result of total reads number and map** reads number, and the coverage rate of each sample was calculated from the coverage length information, and average depth and median depth were calculated from the depth information of every site using R language.
Correlation Test Between Ct Value and Different Data Quality Indexes
The correlation between Ct values and other different data quality indicators (total bases, map** rate of reads, coverage, average depth, median depth) was examined by SPSS. First, tested whether each group of data obeys the normal distribution, and judged by skewness value, kurtosis value, significance value of Shapiro–Wilk test, and Q-Q plot. Secondly, the Pearson correlation coefficient test was carried out for the two sets of data that both obeyed the normal distribution, and the Spearman correlation coefficient test was performed on data that did not follow the normal distribution.
Acquisition of SARS-CoV-2 Genome
Map** results were subjected to call SNPs using the tool Medaka (with the filter standards of ref_prob ≤ 0.01, QUAL ≥ 28, DP ≥ 15, AF ≥ 0.6 or ref_prob ≤ 0.06, QUAL ≥ 17, DP ≥ 30, AF ≥ 0.8) and the command bcftools mpileup (with the filter standards of depth of 10× and frequency of 0.6), followed by artificial verification, finally generated consensus using a script, margin_cons.py (Quick et al. 2A, Supplementary Table S1). The high-quality read lengths ranged from 102 to 584 bp (mean 366 bp, median 386 bp) (Fig. 2B). The main peak of the length distribution was about 400 bp, which was consistent with the theoretical length distribution (peak at ~390 bp) of the amplicons (Fig. 2B). The over-length and under-length reads possibly originated from non-specific amplification in the multi-amplification step with so many primers, because the initial nucleic acid contains a large number of host and other microbial nucleic acids, therefore inevitably there will be interaction with homologous sequences of other species. Cause when divided the high-quality sequencing data into two parts with a threshold of 350 bp, classification of reads using Kraken2 (Wood and Salzberg 2014) showed that except for the major reads from SARS-CoV-2, there were reads from the cellular organisms and a small number of other microorganisms in both parts of data. In addition, the noticeable part of reads much shorter might be caused by partially degraded or mechanically sheared genome fragments, which may not completely cover every amplicon. As a result of when map** to the SARS-CoV-2 reference genome showed that the two parts of the data were basically consistent with all data trends in map** rate (Supplementary Fig. S1). In general, ~99.72% of the virus genome were mapped with reads, the mean depth ranged from 3996.3 to 39,045.6, and the median depth ranged from 441 to 35,678 (Supplementary Table S1). In Fig. 2C, we showed the map** results of 10 representative samples with varied Ct values, from 18.74 to 39.14. As the Ct value increased, which means the viral load in the sample reduced, the quality of sequencing was decreased. The higher the Ct value, the more heterogeneous the map** depth along the genome. For sample A164 (Ct = 18.74), there is only 0.19% genome with map** depth < 100× and 1.83% genome with map** depth < 1000× , whereas the sample C77 (Ct = 39.14), 10.63% of the genome had map** depth < 100× and even 77.18% genome had map** depth < 1000× .
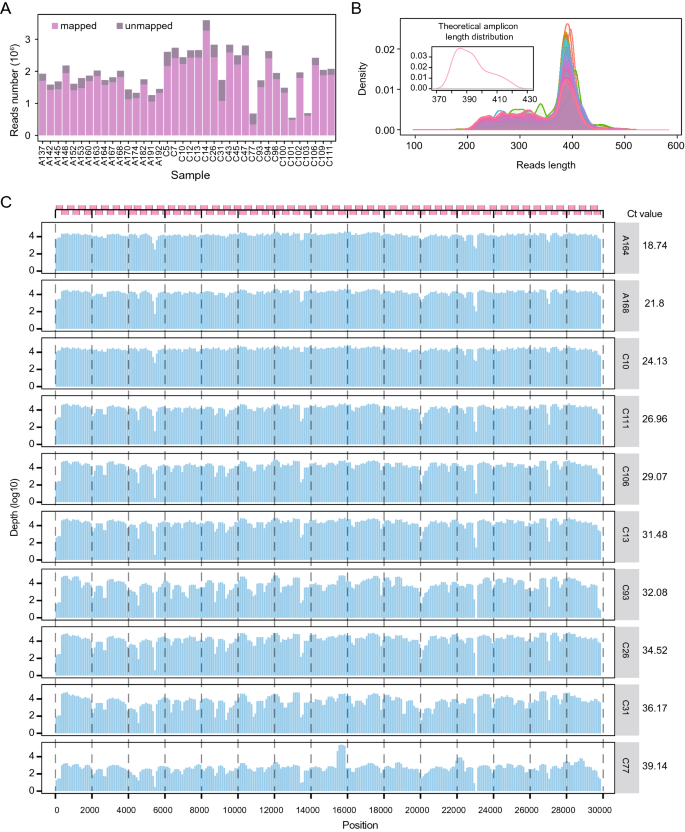
Performance of representative samples in the amplicon-Nanopore sequencing. A The proportion of mapped and unmapped reads of 38 samples when compared to the reference genome. Each bar represents a sample, bars in violet are reads mapped to the reference, and bars in dark-purple are unmapped reads. The order of samples is the same as the order of samples in Supplementary Table S1, excluding 4 low-quality samples. B The length distribution of reads. The internal small graph represents the reads distribution according to the theoretical length of amplicons, while the external large graph represents the reads length distribution of each sample in the actual sequencing results. C Sequencing coverage and depth overview of 10 samples with different Ct values. On the left is the corresponding situation of amplicons location and sequencing coverage and depth of each sample genome, and on the right is the Ct value of each sample.
The Quality of SARS-CoV-2 Genome Sequencing is related to the Viral Load of the Sample
The Ct value and different sequencing quality indicators were further assessed, and found that the total output high-quality bases, map** rate, the coverage of genome, and the mean and median of map** depth all were negatively correlated to the Ct value (Fig. 3A, 3B), though three indicators (total high-quality bases, average depth, and median depth) were not affected significantly (P-value > 0.05) in the sequencing batch PAE38111 (Fig. 3B). Moreover, data yielding for low and high Ct values were assessed. For sample A164 (Ct = 18.74), reads saturation reached after 8 h of sequencing, 99.84% of the genome had map** depth > 100×, and 98.29% genome had map** depth >1000× (Fig. 3C). For samples with Ct value between 20 and 25 (n = 8), sequencing saturation almost reached after 10 h of sequencing, 95.75% of genome had map** depth > 100× and 82.98% of genome had map** depth > 1000× (Fig. 3D). For samples with Ct value between 25 and 30 (n = 12), sequencing saturation reached nearly after 12 h of sequencing, 93.82% of genome had map** depth > 100× and 81.36% of genome had map** depth > 1000× (Fig. 3E). For samples with Ct value between 30 and 35 (n = 14), sequencing saturation almost reached after 16 h of sequencing, 89.42% of genome had map** depth > 100× and 73.95% of genome had map** depth > 1000× (Fig. 3F). For samples with Ct value greater than 35 (n = 3), sequencing saturation almost reached after 16 h of sequencing, 85.37% of genome had map** depth > 100× , and 52.11% of genome had map** depth > 1000× (Fig. 3G). Of course, the longer the sequencing time, the better the map** results. The saturation value may increase again for longer sequencing as showed in Fig. 3E–3G, but it is not necessary for urgent requirements. Sequencing time can also be adjusted specifically based on real-time analysis of Oxford Nanopore sequencing.

The correlation between different data quality indicators and Ct value and data yielding assessment. A, B Correlation between Ct value and five sequencing quality indicators (total data volume, map** rate, coverage, average sequencing depth, median sequencing depth) in the sequencing batch PAE36018 (A) and batch PAE38111 (B). C–F The genome coverage process with sequencing of samples in different range of Ct values: C, Ct values less than 20 cycles (n = 1); D, Ct values between 20 and 25 (n = 8); E, Ct values between 25 and 30 (n = 12); F, Ct values between 30 and 35 (n = 14); G, Ct values greater than 35 (n = 3). The coverage of the data when mapped to the reference genome at different sequencing time points: the black line represents the proportion of unmeasured regions to the genome, the blue dotted line represents the proportion of regions with sequencing depth greater than 10, the light-blue line represents the proportion of regions with sequencing depth greater than 100, and the green line represents the proportion of regions with sequencing depth greater than 1000. The gray vertical dotted line indicates the time at which the sequencing basically reached saturation. The proportion indicated in the figure is the data of sequencing time point of corresponding saturation timepoint.
High-quality Genome Revealed Genetic Variations of SARS-CoV-2
By using bcftools mpileup and Medaka for SNP calling and a published script (margin_cons.py; Quick et al. NGS Sequencing Verifies the High Accuracy of Amplicon Sequencing of SARS-CoV-2 Based on Oxford Nanopore Given that Oxford Nanopore sequencing had a higher error rate for single read (Jain et al. 2016), whether deep sequencing and bioinformatics would eliminate sequencing error is of concerns. To address this issue, six samples (A191, C10, C14, C31, C43, C106) were subjected to Illumina MiSeq platform, since they had more SNPs than the others. The same amplicon amplification products were used for Illumina library preparation. From the MiSeq platform, a total of 5.6 Gb of raw data were generated (11,711,358 paired-end reads). Genome coverage ranged from 98.81% to 99.90%, and 89.24% to 99.78% of the genome regions had sequencing depths higher than 10 × accordingly. Through comparison of results from Oxford Nanopore PromethION and Illumina MiSeq platforms, we found that 45 out of 50 SNPs discovered by Nanopore sequencing can also be found by Illumina sequencing, while 2 SNPs discovered by Illumina sequencing were failed to uncover by Nanopore sequencing (Fig. 5, Supplementary Table S3). For the six samples, the average error rate was less than 0.4 per 10,000 bp. Of note, the false positive and false negative SNPs only existed in two samples (A191 and C31), in which the concentration of purified amplicons was lower than 1 ng/µL. Thus, the quality of the sequencing library may affect the sequencing results to a certain extent. Evaluation of variation sites and mutated allele frequency of Nanopore sequencing using Miseq sequencing. A Comparison of mutation frequency of SNP sites obtained by Miseq sequencing analysis with those obtained by Nanopore sequencing analysis in six samples with more SNP sites than the others. The ordinate is the proportion of the number of major mutant bases to the total number of all sequenced bases at the mutation site. The various mutation types are shown in different colors and are marked on the right side of each small figure. B Correlation of mutated allele frequencies (MuAFs) observed for SNPs detected at viral genomes with Nanopore and Illumina sequencing. SNPs detected with Nanopore but not Illumina were considered to be false-positives (FP; green) and SNPs detected with Illumina but not Nanopore were considered to be false-negatives (FN; red). Moreover, MuAFs of each variation sites were further compared. For this, SNP-calling pipeline were conducted for determination of variation sites. The results showed that the proportion of the dominant variant type calculated by Nanopore sequencing was significantly lower than that of Illumina sequencing in 42 out of 45 simultaneous sites (t-test, P < 0.05, Fig. 5, Supplementary Table S3). The MuAFs of these sites ranged from 0.02 to 0.2 less on the Nanopore platform than on the MiSeq platform, with an average of 0.09 less per site. And the MuAFs of the three exceptional sites were about 0.02 more (no significance, t-test, P = 0.183) on the Nanopore platform than on the MiSeq platform. This possibly reflected the difference of sequencing and bioinformatic procedures between Nanopore and Illumina platforms.
Discussion
When dealing with the emerging infectious diseases, acquiring the genome of the causative pathogens is a top priority in early anti-epidemic works, as virus genomics is one of the direct ways to understand the etiology of an emerging infectious disease. Moreover, virus genome information can help researchers to carry out pathogen identification, important genes analysis, origins tracing, dynamic tracking and transmission and epidemic prejudgment etc. For the COVID-19 epidemic caused by SARS-CoV-2, direct detection of clinical samples is the fastest way to obtain the viral genome, such steps like cell culture (Kim et al. 2020), virus isolation (Park et al. 2020) can be omitted. The most commonly used method was the metagenomic next-generation sequencing (mNGS) (Zhou et al. 2020), it has unique advantages in the screening of unknown pathogens. But for known pathogens, mNGS will need more data than amplicon sequencing for genome acquisition because clinical samples such as that of COVID-19 patients (most are oropharyngeal swabs) often have low viral nucleic acid load and complicated background, which increases the sequencing cost and analysis cost to some extent. On the other hand, because complete genome coverage cannot be guaranteed, Sanger sequencing is often used to fill in the gaps, which increases workload and time cost.
With the continuous development of sequencing technology, Oxford-Nanopore sequencing has become one of the powerful means for the rapid detection of pathogens. Its rapid, portable, and real-time characteristics make it played an important role in the outbreak of Lassa fever (Kafetzopoulou et al. 2019), Zika (Quick et al. 2017), Ebola (Quick et al. 2016), and other infectious diseases. In the current COVID-19 pandemic, some research teams have also improved their SARS-CoV-2 whole-genome sequencing (WGS) methods in other ways, such as increasing the length of amplicons to reduce costs (Freed et al. 2020), combining multi-target amplification and rapid barcode library preparation to shorten time costs (James et al. 2020), and using transposase mediated addition of adapters and PCR based addition of symmetric barcodes to increase throughput (Baker et al. 2020). In the present study, we merged the reverse transcription (RT) PCR and amplicons amplification into one-step to shorten experiment time, and comprehensively evaluated this type of amplicon-Nanopore sequencing technology.
First of all, results demonstrated that high-quality SARS-CoV-2 virus genome covering all ORF regions could be obtained from clinical samples within 24 h (Figs. 1, 3). Since the coverage and depth of the viral genome were evaluated with the change of sequencing time, recommended sequencing time was given for samples with different Ct value ranges (Fig. 3C–3G), which can effectively guide the reasonable sequencing arrangement. Moreover, the throughput of Nanopore sequencers can meet the needs of large-scale sequencing, and a single Nanopore PromethION 48 sequencer can process more than 1000 samples per day. According to our rough estimate, the total cost of nucleic acid positive detection and sequencing for a sample is less than $170, which is equivalent to the generally accepted low-cost mNGS sequencing. In addition, there is still potential for further improvement in genome collection as we used the primers V1 published by the ARTIC network, and the ARTIC team is constantly optimizing the primer pool. Only in the current version, the Ct values of the clinical pharyngeal swab samples we evaluated ranged from 18.74 to 39.14 (Supplementary Table S1). Compared with other studies using Nanopore sequencing (Baker et al. 2020; Lu J et al. 2020), 42 samples sequenced in this study showed better results, 38 samples (90.5%) covered more than about 90% of the genome with sequencing depth of more than 100× , and the other 4 samples (9.5%) covered more than 70% of the genome with sequencing depth over 100× . Furthermore, Illumina sequencing verified that the high error rate for single read in Nanopore sequencing (Jain et al. 2016) could be reduced or even be completely eliminated via ultra-high deep sequencing in the Nanopore sequencing platform: in the six verification samples, the overall error rate is less than 0.4 per 10,000 bp; At the same time, 2/3 of the samples are 100% accurate (Fig. 5), and through the backtracking of the experimental process, it was found that 1/3 of the samples with false positives or false negatives may be caused by the low sample quality. Since the current SARS-CoV-2 virus genome variations are mostly random mutations (Supplementary Fig. S1), systematic errors in the genome sequences obtained by Nanopore sequencing is completely negligible in large-scale genomic analysis.
However, since the frequency of major mutant alleles in Nanopore sequencing is significantly lower than that in Illumina sequencing (Fig. 5, Supplementary Table S3), that is, there are still many minor mutations caused by technical errors in nanopore sequencing, which is the same as previous studies (Harel et al. 2019), so other auxiliary methods are needed in the analysis of intra-host mutations (e.g., iSNV).
Change history
17 November 2021
A Correction to this paper has been published: https://doi.org/10.1007/s12250-021-00465-w
References
Baker DJ, Kay GL, Aydin A, Le-Viet T, Rudder S, Tedim AP, Kolyva A, Diaz M, De Oliveira Martins L, Alikhan N, Meadows L, Bell A, Gutierrez AV, Trotter AJ, Thomson NM, Gilroy R, Griffith L, Adriaenssens EM, Stanley R, Charles IG, Elumogo N, Wain J, Prakash R, Meader E, Mather AE, Webber MA, Dervisevic S, Page AJ, O’grady J (2020) CoronaHiT: large scale multiplexing of SARS-CoV-2 genomes using Nanopore sequencing. bioRxiv. doi: https://doi.org/10.1101/2020.06.24.162156
Bangash MN, Patel J, Parekh D (2020) COVID-19 and the liver: little cause for concern. Lancet Gastroenterol Hepatol 1253:20–21
Chen C, Jiang D, Ni M, Li J, Chen Z, Liu J, Ye H, Wong G, Li W, Zhang Y, Wang B, Bi Y, Chen D, Zhang P, Zhao X, Kong Y, Shi W, Du P, **ao G, Ma J, Gao GF, Cui J, Zhang F, Liu W, Bo X, Li A, Zeng H, Liu D (2018) Phylogenomic analysis unravels evolution of yellow fever virus within hosts. PLoS Negl Trop Dis 12:1–15
Chen N, Zhou M, Dong X, Qu J, Gong F, Han Y, Qiu Y, Wang J, Liu Y, Wei Y, **a J, Yu T, Zhang X, Zhang L (2020) Epidemiological and clinical characteristics of 99 cases of 2019 novel coronavirus pneumonia in Wuhan, China: a descriptive study. Lancet 395:507–513
De Wit E, Van Doremalen N, Falzarano D, Munster VJ (2016) SARS and MERS: recent insights into emerging coronaviruses. Nat Rev Microbiol 14:523–534
Diao B, Feng Z, Wang C, Wang H, Liu L, Wang C, Wang R, Liu Y, Liu Y, Wang G, Yuan Z, Wu Y, Chen Y (2020) Human kidney is a target for novel severe acute respiratory syndrome coronavirus 2 (SARS-CoV-2) Infection. medRxiv. doi: https://doi.org/10.1101/2020.03.04.20031120
Dudas G, Carvalho LM, Bedford T, Tatem AJ, Baele G, Faria NR (2017) Virus genomes reveal factors that spread and sustained the Ebola epidemic. Nature 176:139–148
Faria NR, Kraemer MUG, Hill SC, Goes de Jesus J, Aguiar RS, Iani FCM, Xavier J, Quick J, du Plessis L, Dellicour S et al (2018) Genomic and epidemiological monitoring of yellow fever virus transmission potential. Science 361:894–899
Freed NE, Vlková M, Faisal MB, Silander OK (2020) Rapid and inexpensive whole-genome sequencing of SARS-CoV-2 using 1200 bp tiled amplicons and Oxford Nanopore Rapid Barcoding. Biol Methods Protoc 5:1–7
Guan WJ, Ni ZY, Hu Y, Liang WH, Ou CQ, He JX, Liu L, Shan H, Lei CL, Hui DSC, Du B, Li LJ, Zeng G, Yuen KY, Chen RC, Tang CL, Wang T, Chen PY, **ang J, Li SY, Wang JL, Liang ZJ, Peng YX, Wei L, Liu Y, Hu YH, Peng P, Wang JM, Liu JY, Chen Z, Li G, Zheng ZJ, Qiu SQ, Luo J, Ye CJ, Zhu SY, Zhong NS, China Medical Treatment Expert Group for Covid-19 (2020) Clinical characteristics of coronavirus disease 2019 in China. N Engl J Med 382:1708–1720
Harel N, Meir M, Gophna U, Stern A (2019) Direct sequencing of RNA with MinION nanopore: detecting mutations based on associations. Nucleic Acids Res 47:e148
Kim D, Lee JY, Yang JS, Kim JW, Kim VN, Chang H (2020) The architecture of SARS-CoV-2 transcriptome. Cell 181:1–8
Jain M, Olsen HE, Paten B, Akeson M (2016) The Oxford Nanopore MinION: delivery of nanopore sequencing to the genomics community. Genome Biol 17:1–11
James P, Stoddart D, Harrington ED, Beaulaurier J, Ly L, Reid S, Turner DJ, Juul S (2020) LamPORE: rapid, accurate and highly scalable molecular screening for SARS-CoV-2 infection, based on nanopore sequencing. medRxiv. doi: https://doi.org/10.1101/2020:2020.08.07.20161737
Jia L, Jiang M, Wu K, Hu J, Wang Y, Quan W, Hao M, Liu H, Wei H, Fan W, Liu W, Hu R, Wang D, Li J, Chen J, Liu D (2020) Nanopore sequencing of African swine fever virus. Sci China Life Sci 63:160–164
Kafetzopoulou LE, Pullan ST, Lemey P, Suchard MA, Ehichioya DU, Pahlmann M, Thielebein A, Hinzmann J, Oestereich L, Wozniak DM et al (2019) Metagenomic sequencing at the epicenter of the Nigeria 2018 Lassa fever outbreak. Science 363:74–77
Katoh K, Rozewicki J, Yamada KD (2018) MAFFT online service: Multiple sequence alignment, interactive sequence choice and visualization. Brief Bioinform 20:1160–1166
Lam TT, Jia N, Zhang YW, Shum MH, Jiang JF, Zhu HC, Tong YG, Shi YX, Ni XB, Liao YS, Li WJ, Jiang BG, Wei W, Yuan TT, Zheng K, Cui XM, Li J, Pei GQ, Qiang X, Cheung WY, Li LF, Sun FF, Qin S, Huang JC, Leung GM, Holmes EC, Hu YL, Guan Y, Cao WC (2020) Identifying SARS-CoV-2 related coronaviruses in Malayan pangolins. Nature 583:282–285
Li H (2018) Minimap2: pairwise alignment for nucleotide sequences. Bioinformatics 34:3094–3100
Li H, Handsaker B, Wysoker A, Fennell T, Ruan J, Homer N, Marth G, Abecasis G, Durbin R (2009) The sequence alignment/map format and SAMtools. Bioinformatics 25:2078–2079
Lu J, du Plessis L, Liu Z, Hill V, Kang M, Lin H, Sun J, François S, Kraemer MUG, Faria NR, McCrone JT, Peng J, **ong Q, Yuan R, Zeng L, Zhou P, Liang C, Yi L, Liu J, **ao J, Hu J, Liu T, Ma W, Li W, Su J, Zheng H, Peng B, Fang S, Su W, Li K, Sun R, Bai R, Tang X, Liang M, Quick J, Song T, Rambaut A, Loman N, Raghwani J, Pybus OG, Ke C (2020) Genomic epidemiology of SARS-CoV-2 in Guangdong Province, China. Cell 181:997–1003
Lu X, Zhang L, Du H, Zhang J, Li YY, Qu J, Zhang W, Wang Y, Bao S, Li Y, Wu C, Liu H, Liu D, Shao J, Peng X, Yang Y, Liu Z, **ang Y, Zhang F, Silva RM, Pinkerton KE, Shen K, **ao H, Xu S WGCPNCST (2020) SARS-CoV-2 infection in children. N Engl J Med 382:1663–1665
Ma L, **e W, Li D, Shi L, Mao Y, **ong Y, Zhang Y, Zhang M (2020) Effect of SARS-CoV-2 infection upon male gonadal function: a single center-based study. medRxiv. doi:https://doi.org/10.1101/2020.03.21.20037267
Ni M, Chen C, Qian J, **ao HX, Shi WF, Luo Y, Wang HY, Li Z, Wu J, Xu PS, Chen SH, Wong G, Bi Y, **a ZP, Li W, Lu H, Ma J, Tong YG, Zeng H, Wang SQ, Gao GF, Bo XC, Liu D (2016) Intra-host dynamics of Ebola virus during 2014. Nat Microbiol 1:16151
Park WB, Kwon NJ, Choi SJ, Kang CK, Choe PG, Kim JY, Yun J, Lee GW, Seong MW, Kim NJ, Seo JS, Oh MD (2020) Virus isolation from the first patient with SARS-CoV-2 in Korea. J Korean Med Sci 35:10–14
Quick J, Grubaugh ND, Pullan ST, Claro IM, Smith AD, Gangavarapu K, Oliveira G, Robles-Sikisaka R, Rogers TF, Beutler NA, Burton DR, Lewis-**menez LL, De Jesus JG, Giovanetti M, Hill SC, Black A, Bedford T, Carroll MW, Nunes M, Alcantara LC, Sabino EC, Baylis SA, Faria NR, Loose M, Simpson JT, Pybus OG, Andersen KG, Loman NJ (2017) Multiplex PCR method for MinION and Illumina sequencing of Zika and other virus genomes directly from clinical samples. Nat Protoc 12:1261–1266
Quick J, Loman NJ, Duraffour S, Simpson JT, Severi E, Cowley L, Bore JA, Koundouno R, Dudas G, Mikhail A, Ouédraogo N, Afrough B, Bah A, Carrol MW (2016) Real-time, portable genome sequencing for Ebola surveillance. Nature 530:228–232
Shen W, Le S, Li Y, Hu F (2016) SeqKit: a cross-platform and ultrafast toolkit for FASTA/Q file manipulation. PLoS ONE 11:e0163962
Wood DE, Salzberg SL (2014) Kraken: Ultrafast metagenomic sequence classification using exact alignments. Genome Biol 3:R46
Wu F, Zhao S, Yu B, Chen YM, Wang W, Song ZG, Hu Y, Tao ZW, Tian JH, Pei YY, Yuan ML, Zhang YL, Dai FH, Liu Y, Wang QM, Zheng JJ, Xu L, Holmes EC, Zhang YZ (2020) A new coronavirus associated with human respiratory disease in China. Nature 579:265–269
Zeng JH, Liu YX, Yuan J, Wang FX, Wu WB, Li JX, Wang LF, Gao H, Wang Y, Dong CF, Li YJ, **e XJ, Feng C, Liu L (2020) First case of COVID-19 infection with fulminant myocarditis complication: case report and insights. Infection 48:773–777
Zhang T, Wu Q, Zhang Z (2020) Probable pangolin origin of SARS-CoV-2 associated with the COVID-19 outbreak. Curr Biol 30:1–6
Zhao B, Ni C, Gao R, Wang Y, Yang L, Wei J, Lv T, Liang J, Zhang Q, Xu W, **e Y, Wang X, Yuan Z, Liang J, Zhang R, Lin X (2020) Recapitulation of SARS-CoV-2 infection and cholangiocyte damage with human liver ductal organoids. Protein Cell 11:771–775
Zhou P, Yang XL, Wang XG, Hu B, Zhang L, Zhang W, Si H-R, Zhu Y, Li B, Huang CL, Chen HD, Chen J, Luo Y, Guo H, Jiang RD, Liu MQ, Chen Y, Shen XR, Wang X, Zheng XS, Zhao K, Chen QJ, Deng F, Liu LL, Yan B, Zhan FX, Wang YY, **ao GF, Shi ZL (2020) A pneumonia outbreak associated with a new coronavirus of probable bat origin. Nature 579:270–273
Acknowledgements
The study was supported by grants from the Foundation for National Mega Project on Major Infectious Disease Prevention (grant number 2017ZX10103005-005), National Key Research and Development Program of China (2020YFC0845800 and 2020YFC0845600), and the National Natural Science Foundation of China (31970548 and 91631110). We thank the ARTIC-network for publishing their amplicon primers, we thank Lei Zhang, Ding Gao, Juan Min, Anna Du, Dongbo Nie of the core facility and technical support at Wuhan Institute of Virology, as well as Tao Du of National Biosafety Laboratory, Wuhan, Chinese Academy of Sciences for assistance with experimental platform and experimental environment maintenance.
Author information
Authors and Affiliations
Contributions
This project was designed by Jianjun Chen, DL, HW. Samples were collected and prepared by Jianjun Chen, Jun Chen, YH, YZ, JX. Experiments were conducted by Jianjun Chen, Jun Chen, YY, KW, WQ, YL. The methods were developed by Jianjun Chen, DL, HW, YY, HL, XW, KH, ZJ, DW. The data analysis was performed by YY, KW, HL, XW. The manuscript was prepared by Jianjun Chen, DL, HW, YY. All authors read and commented on the paper.
Corresponding authors
Ethics declarations
Conflict of interest
All authors declare that they have no conflict of interest.
Animal and Human Rights Statement
The study and use of all samples were approved by the Ethics Committee of Wuhan Pulmonary Hospital (No. 2020-LS-001), consents from patients were waived by the Ethics committee.
Supplementary Information
Below is the link to the electronic supplementary material.
Rights and permissions
About this article

Cite this article
Yan, Y., Wu, K., Chen, J. et al. Rapid Acquisition of High-Quality SARS-CoV-2 Genome via Amplicon-Oxford Nanopore Sequencing. Virol. Sin. 36, 901–912 (2021). https://doi.org/10.1007/s12250-021-00378-8
Received:
Accepted:
Published:
Issue Date:
DOI: https://doi.org/10.1007/s12250-021-00378-8