Abstract
Low-cost carriers (LCCs) have transformed the US airline industry. They are now much larger and have moved into more direct competition with legacy carriers. This paper re-examines airline fare determination in this transformed industry. It finds that LCCs have a much larger fare impact than do legacies, but that their fare-reducing effect diminishes as they become dominant on a route. It also finds that legacy carriers primarily affect each others’ prices, whereas LCCs have a significant impact on pricing by both other LCCs and legacies. These and other results suggest a new and more nuanced role for LCCs in the domestic airline industry.
Notes
Southwest acquired AirTran in 2011. The analyses and database examine airline price determination during a period that preceded this transaction.
Notable exceptions to this characterization include Virgin America’s greater level of service and USAir’s lower cost structure after its take-over by American West.
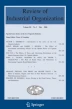
Some, but only some, of this difference was due to stage-length differences between LCCs and legacy carriers. Data on cost per equivalent seat mile—that is, adjusted for stage length—show more substantial cost increases for legacy carriers. Those are still exceeded by unit cost increases for LCCs and for Southwest in particular, although after stage-length adjustment Southwest’s costs remain below that of the legacy carriers.
Among many studies, see Morrison (2001). The measured effects are substantial, often on the order of 25 to 30 percent, and sufficient for that company’s influence to have its own moniker: the “Southwest effect”.
Since many of Southwest’s airport-pair routes involve secondary airports, these share figures may give an incomplete picture of customer alternatives and competition. In fact, by 2010 Southwest or some other LCC had become the largest single carrier on more than 30 percent of all routes (41 percent on a passenger-weighted basis).
See Bin Salam (2013). Also, “Six airlines match Southwest’s $10 fare hike,” Los Angeles Times, Sept. 12, 2012; and “Southwest Airlines chief warns that carrier’s labor costs are too high,” Dallas Morning News, Dec. 5, 2011.
By DOT directive, fares reported in the DB1B data are “the sum of the passenger fare plus any and all taxes, fees, and charges for the entire ticketed itinerary,” specifically including “fuel surcharges, passenger facility charges and security surcharges.” DOT Directive Number 242, February 15, 2000.
Financial problems as well as mergers affected some carriers. See, for example, Busse (2002).
The use of airports pairs is discussed below. As is conventional, only routes in the contiguous US are included, as air service to/from and within Alaska and Hawaii is structured differently.
Additional exclusions are for interline tickets and those that indicate ground transportation. Codes for certain carriers were reassigned to their corporate parent to account for mergers, acquisitions, and other ownership arrangements in the industry.
Specifically, for each calendar quarter in the study, DB1B survey data were used to identify tentatively the carriers that sold (“ticketed”) and operated single-coupon service. Single-coupon service was then verified as nonstop according to the following procedure: First, according to the DB1B survey, some single-coupon trips are both ticketed (marketed) and operated by the same carrier. If that operator scheduled at least three nonstop passenger departures according to the T-100 segment database, then the marketing carrier was considered to be offering nonstop service, so long as single-coupon DB1B trips for this carrier exceeded 100 during the quarter. Second, for single-coupon DB1B trips ticketed and operated by different carriers, the ticketing carrier was treated as offering nonstop service so long as the operating carrier scheduled a sufficient number of departures according to T-100, and that operator did not itself market or ticket single-coupon service according to DB1B. As a result of this procedure, most feeder airlines are included in DB1B according to the major carrier that markets their tickets.
An alternative approach is to combine tickets from all airports in a city and then designate those for particular airports. Studies show either approach to be satisfactory and yield consistent findings. For the same reason, both nonstop and connect service tickets on nonstop routes are combined. Again, studies find little different in results compared to separate estimation so long as controls for ticket type are included.
“Bulk” tickets include ones purchased, typically by travel agents, for resale as part of packaged tours.
The relevant literature includes Morrison (2001).
The very large values for maximum fare and maximum temperature differential both reflect particular circumstances. The largest fare occurs for carriers on long-haul routes that, while thinly traveled, have sufficient traffic to require reporting in DB1B). The maximum temperature differential arises for January travel between Fargo, ND, and Orlando, FL.
See, for example, BLS (2013). That study also cites research that finds that a correction for simultaneity changes results very little.
Tests reveal that legacy count is important, while for LCCs, the presence of any single one drives the statistical results. In most cases, there is only a single LCC anyway. The values that are reported here and for all dummy variables are the marginal effects, which are calculated by exponentiating the estimated coefficient, and subtracting 1.
See, for example, Borenstein (2011). In addition, quarter dummies are included but not reported here. Several of these effects emerge more clearly in the individual carrier specifications that are reported below.
There are few observations with four or more legacy carriers or LCCs.
References
Bin Salam, N. (2013). Is there still a southwest effect? Transportation Research Record, Journal of the Transportation Research Board, 2325, 1–8.
Borenstein, S. (2011). What happened to airline market power? University of California Berkeley Haas School of Business working paper.
Brueckner, J., Lee, D., & Singer, E. (2013). Airline competition and domestic U.S. airfares: A comprehensive appraisal. Economics of Transportation, 2(1), 1–17.
Busse, M. (2002). Firm financial condition and airline price wars. RAND Journal of Economics, 33(2), 298–318.
Emch, E. (2011, November). Measuring the full effect of LCC entry. Presentation at Southern Economics Association Conference, Washington, DC.
Goolsbee, A., & Syverson, C. (2008). How do incumbents respond to the threat of entry? Quarterly Journal of Economics, 123(4), 1611–1633.
Kwoka, J., & Shumilkina, E. (2010). The price effect of eliminating a potential competitor. Journal of Industrial Economics, 58(4), 767–793.
Morrison, S. (2001). Actual, adjacent, and potential competition: southwest airlines. Journal of Transport Economics and Policy, 35(2), 239–256.
Acknowledgments
The authors gratefully acknowledge the helpful comments on earlier versions of this paper from participants at the International Industrial Organization Conference and the Bates White Antitrust Conference, as well as from reviewers and the editor of this journal. We have also benefitted greatly from comments and suggestions from Gustavo Vicentini. All views expressed here as well as remaining errors are the sole responsibility of the authors.
Author information
Authors and Affiliations
Corresponding author
Rights and permissions
About this article

Cite this article
Kwoka, J., Hearle, K. & Alepin, P. From the Fringe to the Forefront: Low Cost Carriers and Airline Price Determination. Rev Ind Organ 48, 247–268 (2016). https://doi.org/10.1007/s11151-016-9506-3
Published:
Issue Date:
DOI: https://doi.org/10.1007/s11151-016-9506-3