
Avoid common mistakes on your manuscript.
1 Introduction
The research and technological area of data management encompasses various concepts, techniques, algorithms and technologies, including data modeling, data integration and ingestion, transactional data management, query languages, query optimization, physical data storage, data structures, analytical techniques (including On-Line Analytical Processing – OLAP), as well as service creation and orchestration (Garcia-Molina et al., 2009). Data management technologies are core components of every information system, either centralized or distributed, deployed in an on-premise hardware architecture or in a cloud ecosystem. Data management technologies have been used in commercial, mature products for decades. They were originally developed for managing structured data (mainly expressed in the relational data model).
Yet, the ubiquitous big data (Azzini et al., 2021) require development of new data management techniques, suitable for the variety of data formats (from structured, through semi-structured, to unstructured), overwhelming data volumes and velocity of big data generation. These new techniques draw upon the concepts applied to managing relational data.
One of the most frequently used data format for big data is based on graphs, which are a natural way of representing relationships between entities, e.g., knowledge, social connections and components of a complex system. Such data not only need to be efficiently stored but also efficiently analyzed. Therefore, some OLAP-like analysis approaches from graph data have been recently proposed, e.g., Chen et al. (2020), Ghrab et al. (2018), Ghrab et al. (2021), and Schuetz et al. (2021). Thus, combining graph and OLAP technologies offers ways of analyzing graphs in a manner already well accepted by the industry (Richardson et al., 2021).
The complexity of ecosystems for managing big data results in challenges for orchestrating these components and in optimizing their performance, as there are too many parameters in each system to be manually tuned by a human administrator. Thus, more and more frequently, machine learning techniques are applied to performance optimization, e.g., Hernández et al. (2018) and Witt et al. (2019). Conversely, data management techniques are used to solve challenges in machine learning, such as building end-to-end data processing pipelines (Romero and Wrembel, 2020).
In this editorial to the special section of Information Systems Frontiers, we outline research problems in graph processing, OLAP and machine learning. These problems are addressed by the papers in this special section.
2 Selected Research Problems in Data Management and Information Systems
2.1 Graph Processing
Graph processing algorithms have been attracting attention of researchers since the 1950’s. Several knowledge representation techniques (such as semantic networks) studied in the 1970’s utilize graph structures, including applications to rule-based systems (Griffith, 1982), data structures for efficient processing (Moldovan, 1984)), and several other aspects.
The concepts of semantic networks served as a base for the Semantic Web and evolved into knowledge graphs, also known as knowledge bases. Processing of large distributed RDF knowledge bases with the SPARQL language is addressed in Peng et al. (2016).
Graph-based models become a natural choice for a representation of semi-structured data (McHugh et al., 1997). Graph representations proved their usefulness for modeling hypertexts, including the World Wide Web (Meusel et al., 2014). Documents (e.g., Web pages) are mapped to vertices, while directed edges represent links. The graph representations of the WWW provided several features (such as page rank and simrank) for deep analysis of its structure and definition. Sources of large graphs include social networks, bioinformatics, road networks, and other application domains.
The need to store and process large graphs supports growing interest to graph databases. An overview of several aspects of graph databases can be found in (Deutsch and Papakonstantinou, 2018). Typically, such databases can store graph vertices and nodes, labeled with sets of attributes. A widespread opinion states that graph databases provide more powerful modeling features than the relational model used in traditional relational databases. This is doubtful, as a relational database schema (represented for example as an ER model) is also a graph (Pokorný, 2016). Actually, the advantage of graph databases is that the expensive and time-consuming modeling can be pushed forward to later phases of the information system lifecycle, providing more options for rapid prototy** and similar application development methodologies (Brdjanin et al., 2018).
A need of highly expressive tools for graph processing specification triggered a number of efforts in declarative query languages design. A step toward the standardization of graph query languages (Angles et al., 2018) is focused on providing a balance between high expressiveness and computational performance, avoiding constructs that may result in unacceptable computation complexity. The GSQL graph query language (Deutsch et al., 2020) supports the specification of complex analytical queries over graphs, including pattern matching and aggregations. A comparison of different graph processing techniques, available in the Neo4j graph database management system, can be found in Holzschuher and Peinl (2013).
Several similarities can be found between relational and graph declarative query languages: as soon as sets of labeled nodes or edges are produced as intermediate results, the remaining processing is typically expressed in terms of relational operations. The most significant differences between graph and relational database query languages follow.
-
Graph traversal (implicit and rarely used in relational languages) requires the intensive use of recursion and an efficient implementation in graph databases.
-
Graph query languages provide support for computationally complex processing, such as weighted shortest path search, potentially with additional constraints.
-
Locality of data placement is essential for high performance of relational systems. Data placement in graph databases is much more complex and often results in poor performance when the size of the database exceeds the available main memory of a single server.
The items listed above are inter-related: the performance of graph processing depends on locality needed for efficient traversing of a graph. However, traversing depends on the problem being solved. A generic approach is to rely on certain graph properties to optimize the storage of graph nodes and edges, that is, graph partitioning.
2.2 On-Line Analytical Processing
The term “On-Line Analytical Processing” (OLAP) was coined by Edgar F. Codd in 1993 (Codd et al., 1993). OLAP is defined in contrast to operational database systems that run On-Line Transactional Processing (OLTP). In OLTP, data representing the current state of information may be frequently modified and are interrogated through relatively simple queries. OLAP’s data are typically sourced from one or several OLTP databases, consolidated and historicized for decision-support purposes. They are seldom modified and are queried by complex, analytical queries that run over large data volumes.
Conceptually, OLAP rests on a metaphor that is easy to grasp by business users: the (hyper)cube. Facts constituted of numerical Key Performance Indicators (KPIs), e.g., product sales, are analysis subjects. They are viewed as points in a multidimensional space whose dimensions are analysis axes, e.g., time, store, salesperson, etc. Dimensions may also have hierarchies, e.g., \(store \rightarrow city \rightarrow state\). Thus, dimensions represent the coordinates of facts in the multidimensional space.
In the 1990’s, OLAP research mainly focused on designing efficient logical and physical models, synthetically surveyed by Vassiliadis and Sellis (1999). Relational OLAP (ROLAP) relies on storing data in time-tested relational Database Management Systems (DBMSs), complemented with new, OLAP-specific operators and queries available in SQL99. ROLAP is cheap and easy to implement, can handle large data volumes, and schema evolution is relatively easy. However, ROLAP induces numerous, costly joints that hinder query performance, and analysis results are not suitable to end-users, i.e., business users, and thus must be reformatted.
In contrast, Multidimensional OLAP (MOLAP) sticks to the cube metaphor. Hypercubes are natively stored in multidimensional tables, allowing quick aggregate computations. However, it turned out that MOLAP systems and languages (e.g., MDX) were in majority proprietary and difficult to implement. Moreover, data volume is limited to the RAM size and a cube can be quite sparse, wasting memory. Eventually, refreshing the system is limited, inducing full and costly periodical reconstructions.
Eventually, Hybrid OLAP (HOLAP) was proposed as the best of both worlds (Salka, 1998), by storing atomic data in a relational DBMS and aggregated data in MOLAP cubes, thus achieving a good cost/performance tradeoff on large data volumes. However, HOLAP is difficult to implement and neither as fast as MOLAP nor as scalable as ROLAP. Later on, in 2014, Gartner introduced the Hybrid Transaction/Analytical Processing (HTAPFootnote 1), where an in-memory DBMS helps process OLTP and OLAP simultaneously, which allows transactional data to be quickly available for analytics and induces fast, distributed query computation while avoiding data redundancy. However, this is a complex and drastic change in decision-support architectures.
After OLAP pioneers, many lines of research went on for more than fifteen years, which can be classified in two trends. In the first trend, OLAP is adapted to particular data formats. One of the most prominent of such adaptations is probably Spatial OLAP (SOLAP Han, 2017), where OLAP is applied on spatial (and even spatio-temporal) data, allowing for example to zoom and dezoom (i.e., drill-down and roll-up in terms of OLAP operations) spatial representations such as maps. Another well-researched adaptation was XML-OLAP (also called XOLAP), which allows OLAP on semi-structured data. Related approaches are surveyed in Mahboubi et al. (2009). Other examples include OLAP on trajectory data (Marketos and Theodoridis, 2010) and mobile OLAP (Maniatis, 2004).
In the second trend, OLAP is hybridized with other techniques for specific purposes. Quite quickly, OLAP was associated with data mining, with OLAP providing data navigation and identifying a subset of a cube; and data mining featuring association, classification, prediction, clustering, and sequencing on this data subset (Han, 1997).
With the Web becoming an important source of data, OLAP systems could not rely only on internal data any more and had to discover external, Web data, as well as their semantics. This issue was addressed with the help of Semantic Web (SW) technologies that support inference and reasoning on data. An extensive survey covers this research trend (Abelló et al., 2015). OLAP was also combined with information networks akin to social media, in the sense that they can be represented by very similar graphs. A comprehensive survey of the so-called Graph OLAP, with a focus on bibliographic data analysis, is provided in Loudcher et al. (2015).
Eventually, the Big Data era made OLAP meet new challenges such as: (1) design methods that handle a high complexity that tends to make the number of dimensions explosive; (2) computing methodologies that leverage the cloud computing paradigm for scaling and performance; and (3) query languages that can manage data variety (Cuzzocrea, 2015).
Big Data also pushed forward the exploitation of textual documents, which are acknowledged to represent the majority of the information stored worldwide. In the context of OLAP, i.e., Text or Textual OLAP, the key issue is to find ways of aggregating textual documents instead of numerical KPIs. Two trends emerge, based on the hypercube structure and text mining, respectively. They are thoroughly surveyed and discussed in Bouakkaz et al. (2017).
Finally, with the emergence of Data Lakes (DLs) in the 2010’s, the concept of Data Warehouse (DW), on which OLAP typically rests, is challenged in terms of data integration complexity, data siloing, data variety management and even scaling. However, DLs and DWs are actually synergistic. A DL can indeed be the source of a DW, and DWs can be components, among others, of DLs. Thence, OLAP remains very useful as an analytical tool in both cases. Two recent and complimentary surveys cover DL, DW and OLAP-related issues (Sawadogo and Darmont, 2021; Hai et al., 2021). DL applies algorithms that allow a machine to train itself from large volumes of data, in order to learn new models based on new input (data). DL turned out to be especially efficient in image and speech recognition.
In order to build prediction models by ML algorithms, massive amounts of pre-processed data are needed. The pre-processing includes a workflow of tasks (a.k.a. data wrangling (Bogatu et al., 2019), data processing/preparation pipeline (Konstantinou & Paton, 2020; Romero et al., 2020) or ETL (Ali & Wrembel, 2017)). The workflow includes the following tasks: data integration and transformation, data cleaning and homogenization, data preparation for a particular ML algorithm. Based on pre-processed data, ML models are built (trained, validated, and tuned Quemy, 2020). Since the whole workflow is very complex, constructing it requires a deep knowledge from its developer in multiple areas, including software engineering, data engineering, performance optimization, and ML. Thus, multiple works focus on automating the construction of such workflows. This research area is commonly called AutoML. It turned to be a hot research area in recent years (Bilalli et al., 2019; Giovanelli et al., 2021; Koehler et al., 2021; Quemy, 2019). (Kedziora et al., 2021; Goebel et al., 2018; Liang et al., 2021; Langer et al., 2021; Miller, 2019) or Interpretable Machine Learning (IML) (Du et al., 2019) techniques are being developed. This research problem is defined as “investigating methods to produce or complement AI to make accessible and interpretable the internal logic and the outcome of the model, making such process human understandable” (Bodria et al., 2021), chemistry (Karimi et al., 2021), text processing (Moradi & Samwald, 2021), finance (Ohana et al., 2021), energy management (Sardianos et al., 2021), and IoT (García-Magariño et al., 2019).
A substantial growth of this research topic is observed in years 2018-2019. The DBLP serviceFootnote 2 includes in total 215 papers on EAI and 163 papers on IML (as of September 25, 2021). Google TrendsFootnote 3 shows an increasing popularity trend of this research topic. Figure 1 shows an aggregated trend for EAI and IML.
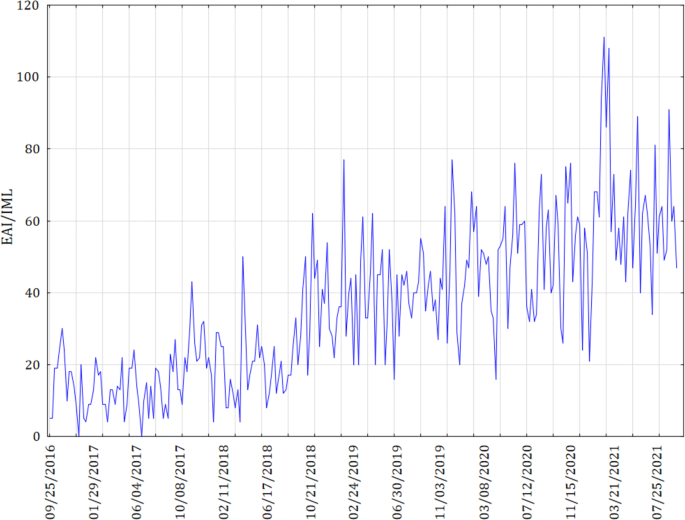
Aggregated popularity trend of EAI and IML topics (Google Trends)
Techniques for building interpretable ML models can be divided into two categories, namely intrinsic and post-hoc. An orthogonal classification divides the techniques into global and local interpretable models (Du et al., 2019).
Models from the intrinsic interpretability incorporate interpretability directly to their structures, making them self-interpretable. Examples of such models include for example: decision trees, rule-based models, and linear models. Models from the post-hoc interpretability require constructing an additional model, which provides explanations to the main model.
A globally interpretable model means that a user is able to understand how a model works globally, i.e., in a generalized way. A locally interpretable model allows a user to understand how an individual prediction was made by the model.
Multiple approaches to explaining models have been proposed. They may be specific to a type of data used to build a model, i.e., there are specific approaches for table-like data, for images, and for texts.
For explaining models that use table-like data, the most popular method is based either on rules or on feature importance. A rule-based explanation uses decision rules understandable by a user, which explain reasoning that produced the final prediction (decision). A feature importance explanation assigns a value to each input feature. The value represents the importance of a given feature in the produced model.
For explaining models that work on images, the most frequently used technique is called the Sailency Map (SM). The SM is an image where a brightness and/or color of a pixel reflects how important the pixel is (it is typically visualized as a divergent color map). This way, it can be visualized whether and how strongly a given pixel in an image contributes to the given output of a model. The SM is typically modeled as a matrix, whose dimensions are the sizes of the image being analyzed.
A concept similar to SM can be used to explain models that work on text data. When the SM is applied to a text, then every word in the text is assigned a color, which reflects the importance of a given word in the final output of a model.
An excellent overview of explanation methods in ML for various types of data is available in Bodria et al. (2021).
3 Special Section Content
This editorial paper overviews research topics covered in this special section of the Information Systems Frontiers journal. The special section contains papers invited from the 24th European Conference on Advances in Databases and Information Systems (ADBIS).
3.1 ADBIS Research Topics
The ADBIS conference has been running continuously since 1993. An overview of ADBIS past and present activities can be found in (Tsikrika and Manolopoulos, 2016) and at http://adbis.eu. ADBIS is considered among core European conferences on practical and theoretical aspects of databases, data engineering, data management as well as information systems development and management. In this context, the most frequent research topics addressed by researchers submitting papers to ADBIS within the last ten years include: Data streams, Data models and modeling, Data cleaning and quality, Graph processing, Reasoning and intelligent systems, On-Line Analytical Processing, Software and systems, Ontologies and RDF, Algorithms, Indexing, Spatio-temporal data processing, Data integration, Query language and processing, Machine Learning.
All research topics covered within the last 10 editions (years 2012-2021) of ADBIS are visualized in Fig. 2. We constrained the analysis to the 10-years period in order to reflect the recent research interests. Moreover, we analyzed papers published only in the LNCS volumes, to include the highest quality papers. In Fig. 2, the Y axis shows a total number of papers addressing a given topic (the median is equal to 7). Q1-Q4 represent the first, second, third, and fourth quartile, respectively.
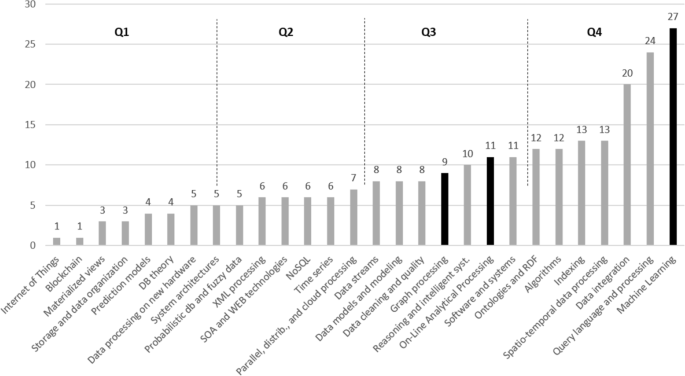
Research topics within the last 10 years of ADBIS (based on papers published only in LNCS volumes)
The papers included in this special section address topics from Q3 and Q4, and thus represent frequent ADBIS topics. These papers cover: Graph processing, OLAP, and Machine Learning (marked in black in Fig. 2). These three topics are outlined in Section 2, whereas the papers included in this special section are summarized in Section 3. It is worth to note that the most frequent ADBIS topics reflect world research trends and they follow research topics of top world conferences in databases and data engineering, including SIGMOD, VLDB, and ICDE (Wrembel et al., 2019). This special section includes three papers covering: Graph processing, OLAP, and Machine Learning.
3.2 Papers in this Special Section
The first paper (Belayneh et al., 2022), Speeding Up Reachability Queries in Public Transport Networks Using Graph, authored by Bezaye Tesfaye Belayneh, Nikolaus Augsten, Mateusz Pawlik, Michael H. Böhlen, and Christian S. Jensen, addresses the challenges discussed in Section 2.1 for a special case of temporal road networks graphs and a special case of queries, namely, reachability queries over public transport network.
An evaluation of such queries involves multiple computations of shortest paths with additional temporal constraints. Specifically, the connection time calculated as a difference between a departure of the outgoing vehicle and an arrival of previous incoming vehicle is added to the length of a path. The problem is, in general, NP-hard. Therefore, an approximate algorithm is needed to solve the problem efficiently. To this end, the authors propose an algorithm based on graph partitioning: the problem is split into smaller problems. A set of boundary nodes is pre-calculated for each partition. The shortest path is found in each partition (called a cell in the paper) and a choice of a path between partitions. Pre-calculated paths inside cells constitute an index that significantly speeds up the search. In the proposed evaluation, the search is limited to startpoint and endpoint cells and search for chains of cells, as the paths inside cells and boundary nodes are pre-calculatied. The partitioning provides locality, but of course actual performance depends on the choice of partitioning algorithm. The paper contains deep performance analysis and comparison of different partitioning algorithms.
The second paper (Francia et al., 2022), entitled Enhancing Cubes with Models to Describe Multidimensional Data, by Matteo Francia, Patrick Marcel, Veronika Peralta, and Stefano Rizzi, presents a first step toward a proof of concept of the Intentional Analytics Model (IAM).
IAM mobilizes both Online Analytical Processing (OLAP) and various machine learning methods to allow users express the so-called analysis intentions and obtain the so-called enhanced (annotated) data cube. Analysis intentions are expressed with five operators. The paper focuses on formalizing and implementing the describe operator, which describes cube measures. Enhanced cube cells are associated with interesting components of models (e.g., clustering models) that are automatically extracted from cubes. For example, cells containing outliers can be highlighted.
Moreover, the authors propose a measure to assess the interestingness of model components in terms of novelty, peculiarity and surprise during the user’s data navigation. A dataviz is also automatically produced by a heuristic to depict enhanced cubes, by coupling text-based representations (a pivot table and a ranked component list) and graphical representations, i.e., various possible charts. Eventually, the whole approach is evaluated through experiments that target efficiency, scalability, effectiveness, and formulation complexity.
The third paper (Ferrettini et al., 2022), entitled Coalitional Strategies for Efficient Individual Prediction Explanation, by Gabriel Ferrettini, Elodie Escriva, Julien Aligon, Jean-Baptiste Excoffier, and Chantal Soulé-Dupuy, addresses the problem of explaining machine learning models. The goal of this work was to develop a general method for facilitating the understanding of how a machine learning model works, with a particular focus on identifying groups of attributes that affect a ML model, i.e., a quality of prediction provided by the model.
A starting point of the investigation is an observation that attributes cannot be considered as independent of each other, therefore it was required to verify the influence of all possible attributes combinations on the model quality. The influence of an attribute is measured according to its importance in each group an attribute can belong to. A complete influence of an attribute now takes into consideration its importance among all the possible attribute combinations. Computing the complete influence is of exponential complexity. For this reason, efficient methods for finding influential groups are needed.
In this context, the paper describes a method for identifying groups of attributes that are crucial for a quality of a ML model. To this end, the authors proposed the so-called coalitions. A coalition includes these attributes that influence a ML model. In order to identify coalitions, the authors proposed to use the following techniques:
-
Model-based coalition, where interactions between attributes used in a model are detected by analyzing the usage of the attributes by the model. To this end, the values of attributes in an input data set are modified and it is observed how the model predictions vary.
-
PCA-based coalition, where the PCA method is applied to create a set of combined attributes, represented by a new attribute obtained from the PCA. This set is considered as an influential group of attributes.
-
Variance inflation factor-based coalitions, where the standard variance inflation factor (VIF) is an estimation of the multicollinearity of the attributes in a dataset, w.r.t. a given target attribute. VIF is based on the R coefficient of determination of the linear regression. Since the value of VIF is computed by means of a linear regression, this method is suitable for coalitions where linear correlation between attributes exist.
-
Spearman correlation coefficient-based coalition, which takes into account non-linear correlations between attributes. The correlations are computed between all pairs of attributes and their correlations are represented by the Spearman coefficient.
These methods were evaluated by excessive experiments on multiple data sets provided by openml.org, for two classification algorithms, namely Random Forest and Support Vector Machine. As the baseline, the so-called complete method was selected. The obtained results, show that the proposed methods provided promising performance characteristics in terms of computation time and model accuracy.
References
Abelló, A., Romero, O., Pedersen, T.B., Llavori, R.B., Nebot, V., Cabo, M.J.A., & Simitsis, A. (2015). Using semantic web technologies for exploratory OLAP: a survey. IEEE Transactions on Knowledge and Data Enginering, 27(2), 571–588.
Ali, S.M.F., & Wrembel, R. (2017). From conceptual design to performance optimization of ETL workflows: current state of research and open problems. The VLDB Journal, 26(6), 777–801.
Angles, R., Arenas, M., Barcelo, P., Boncz, P., Fletcher, G., Gutierrez, C., Lindaaker, T., Paradies, M., Plantikow, S., Sequeda, J., van Rest, O., & Voigt, H. (2018). G-core: a core for future graph query languages. In ACM SIGMOD Int. Conf. on management of data (pp. 1421–1432).
Azzini, A.S.B. Jr, Bellandi, V., Catarci, T., Ceravolo, P., Cudré-mauroux, P., Maghool, S., Pokorný, J., Scannapieco, M., Sédes, F., Tavares, G.M., & Wrembel, R. (2021). Advances in data management in the big data era. In Advancing research in information and communication technology, IFIP AICT, (Vol. 600 pp. 99–126). Springer.
Belayneh, B.T., Augsten, N., Pawlik, M., Böhlen, M. H., & Jensen, C.S. (2022). Speeding up reachability queries in public transport networks using graph partitioning. Inf. Syst Frontiers 24(1). https://doi.org/10.1007/s10796-021-10164-2.
Bengio, Y., Lecun, Y., & Hinton, G. (2021). Deep learning for ai. Communcations of the ACM, 64(7), 58–65.
Biggio, B., Diaz, C., Paulheim, H., & Saukh, O. (2021). Big minds sharing their vision on the future of ai (panel). In Database and expert systems applications (DEXA), LNCS, Vol. 12923. Springer.
Bilalli, B., Abelló, A., Aluja-banet, T., & Wrembel, R. (2019). PRESISTANT: learning based assistant for data pre-processing. Data & Knowledge Engineering 123.
Bodria, F., Giannotti, F., Guidotti, R., Naretto, F., Pedreschi, D., & Rinzivillo, S. (2021). Benchmarking and survey of explanation methods for black box models. ar**v:2102.13076.
Bogatu, A., Paton, N.W., Fernandes, A.A.A., & Koehler, M. (2019). Towards automatic data format transformations: Data wrangling at scale. The Computer Journal, 62(7), 1044–1060.
Bouakkaz, M., Ouinten, Y., Loudcher, S., & Strekalova, Y.A. (2017). Textual aggregation approaches in OLAP context: a survey. Int. Journal of Information Management, 37(6), 684–692.
Brdjanin, D., Banjac, D., Banjac, G., & Maric, S. (2018). An online business process model-driven generator of the conceptual database model. In Int. Conf. on web intelligence, mining and semantics.
Chen, H., Wu, B., Deng, S., Huang, C., Li, C., Li, Y., & Cheng, J. (2020). High performance distributed OLAP on property graphs with grasper. In Int. Conf. on management of data, SIGMOD (pp. 2705–2708). ACM.
Codd, E., Codd, S., & Salley, C. (1993). Providing OLAP to User-Analysts: an IT mandate. E.F codd & associates.
Cuzzocrea, A. (2015). Data warehousing and OLAP over Big Data: a survey of the state-of-the-art, open problems and future challenges. Int. Journal of Business Process Integration and Management, 7(4), 372–377.
Danso, S.O., Zeng, Z., Muniz, G.T., & Ritchie, C. (2021). Develo** an explainable machine learning-based personalised dementia risk prediction model: a transfer learning approach with ensemble learning algorithms. Frontiers Big Data, 613047, 4.
Deutsch, A., & Papakonstantinou, Y. (2018). Graph data models, query languages and programming paradigms. Proc. VLDB Endow., 11(12), 2106–2109.
Deutsch, A., Xu, Y., Wu, M., & Lee, V.E. (2020). Aggregation support for modern graph analytics in tigergraph. In ACM SIGMOD Int. Conf. on management of data (pp. 377–392).
Du, M., Liu, N., & Hu, X. (2019). Techniques for interpretable machine learning. Communcations of the ACM, 63(1), 68–77.
Ferrettini, G., Escriva, E., Aligon, J., Excoffier, J.B., & Soulé-Dupuy, C. (2022). Coalitional strategies for efficient individual prediction explanation. Inf. Syst Frontiers 24(1). https://doi.org/10.1007/s10796-021-10141-9.
Francia, M., Marcel, P., Peralta, V., & Rizzi, S. (2022). Enhancing cubes with models to describe multidimensional data. Inf. Syst Frontiers 24(1). https://doi.org/10.1007/s10796-021-10147-3.
García-Magariño, I., Rajarajan, M., & Lloret, J. (2019). Human-centric AI for trustworthy iot systems with explainable multilayer perceptrons. IEEE Access, 7, 125562–125574.
Garcia-Molina, H., Ullman, J.D., & Widom, J. (2009). Database systems - the complete book. London: Pearson Education.
Ghrab, A., Romero, O., Jouili, S., & Skhiri, S. (2018). Graph BI & analytics: Current state and future challenges. In Int. Conf. on big data analytics and knowledge discovery DAWAK, LNCS, (Vol. 11031 pp. 3–18). Springer.
Ghrab, A., Romero, O., Skhiri, S., & Zimányi, E. (2021). Topograph: an end-to-end framework to build and analyze graph cubes. Information Systems Frontiers, 23(1), 203–226.
Giovanelli, J., Bilalli, B., & Abelló, A. (2021). Effective data pre-processing for automl. In Int. Workshop on design, optimization, languages and analytical processing of big data (DOLAP), CEUR workshop proceedings, (Vol. 2840 pp. 1–10).
Goebel, R., Chander, A., Holzinger, K., Lécué, F., Akata, Z., Stumpf, S., Kieseberg, P., & Holzinger, A. (2018). Explainable AI: the new 42?. In IFIP TC 5 Int. Cross-domain conf. on machine learning and knowledge extraction CD-MAKE, LNCS, (Vol. 11015 pp. 295–303). Springer.
Griffith, R.L. (1982). Three principles of representation for semantic networks. ACM Transactions on Database Systems 417–442.
Hai, R., Quix, C., & Jarke, M. (2021). Data lake concept and systems: a survey ar**v:2106.09592.
Han, J. (1997). OLAP Mining: Integration of OLAP with data mining. In Conf. on database semantics (DS), IFIP conference proceedings, (Vol. 124 pp. 3–20).
Han, J. (2017). OLAP, Spatial, (pp. 809–812). Berlin: Encyclopedia of GIS Springer.
Hernández, A.́B., Pérez, M.S., Gupta, S., & Muntés-mulero, V. (2018). Using machine learning to optimize parallelism in big data applications. Future Gener. Comput. Syst., 86, 1076–1092.
Holzschuher, F., & Peinl, R. (2013). Performance of graph query languages: Comparison of cypher, gremlin and native access in neo4j. In Joint EDBT/ICDT workshops (pp. 195–204).
Karimi, M., Wu, D., Wang, Z., & Shen, Y. (2021). Explainable deep relational networks for predicting compound-protein affinities and contacts. Journal of Chemical Information and Modeling, 61(1), 46–66.
Kedziora, D.J., Musial, K., & Gabrys, B. (2020). Autonoml: Towards an integrated framework for autonomous machine learning. ar**v:2012.12600.
Koehler, M., Abel, E., Bogatu, A., Civili, C., Mazilu, L., Konstantinou, N., Fernandes, A.A.A., Keane, J.A., Libkin, L., & Paton, N.W. (2021). Incorporating data context to cost-effectively automate end-to-end data wrangling. IEEE Transactions on Big Data, 7(1), 169–186.
Konstantinou, N., & Paton, N.W. (2020). Feedback driven improvement of data preparation pipelines. Information Systems, 92, 101480.
Krensky, P., & Idoine, C. (2021). Magic quadrant for data science and machine learning platforms. https://www.gartner.com/doc/reprints?id=1-25D1UI0O&ct=210302&st=sb. Gartner.
Langer, M., Oster, D., Speith, T., Hermanns, H., Kästner, L., Schmidt, E., Sesing, A., & Baum, K. (2021). What do we want from explainable artificial intelligence (xai)? - a stakeholder perspective on XAI and a conceptual model guiding interdisciplinary XAI research. Artifitial Intelligence, 296, 103473.
Liang, Y., Li, S., Yan, C., Li, M., & Jiang, C. (2021). Explaining the black-box model: a survey of local interpretation methods for deep neural networks. Neurocomputing, 419, 168–182.
Loudcher, S., Jakawat, W., Soriano-Morales, E.P., & Favre, C. (2015). Combining OLAP and information networks for bibliographic data analysis: a survey. Scientometrics, 103(2), 471–487.
Mahbooba, B., Timilsina, M., Sahal, R., & Serrano, M. (2021). Explainable artificial intelligence (XAI) to enhance trust management in intrusion detection systems using decision tree model. Complexity, 2021, 6634811:1–6634811:11.
Mahboubi, H., Hachicha, M., & Darmont, J. (2009). XML Warehousing And OLAP, Encyclopedia of Data Warehousing and Mining, Second Edition, vol. IV, pp. 2109–2116 IGI Publishing.
Maniatis, A.S. (2004). The case for mobile OLAP. In Current trends in database technology – EDBT workshops, LNCS, (Vol. 3268 pp. 405–414).
Marketos, G., & Theodoridis, Y. (2010). Ad-hoc OLAP on Trajectory Data. In Int. Conf. on mobile data management (MDM) (pp. 189–198).
McHugh, J., Abiteboul, S., Goldman, R., Quass, D., & Widom, J. (1997). Lore: a database management system for semistructured data. SIGMOD Record, 26(3), 54–66.
Meusel, R., Vigna, S., Lehmberg, O., & Bizer, C. (2014). Graph structure in the web — revisited: a trick of the heavy tail. In Int. Conf. on world wide web (pp. 427–432).
Miller, T. (2019). Explanation in artificial intelligence: Insights from the social sciences. Artificial Intelligence, 267, 1–38.
Moldovan, D.I. (1984). An associative array architecture intended for semantic network processing. In Annual conf. of the ACM on the fifth generation challenge (pp. 212–221). ACM.
Moradi, M., & Samwald, M. (2021). Explaining black-box models for biomedical text classification. IEEE Journal of Biomedical and Health Informatics, 25(8), 3112–3120.
Ohana, J., Ohana, S., Benhamou, E., Saltiel, D., & Guez, B. (2021). Explainable AI (XAI) models applied to the multi-agent environment of financial markets. In Explainable and transparent AI and multi-agent systems, lecture notes in computer science, (Vol. 12688 pp. 189–207). Springer.
Panetta, K. (2020). Gartner top strategic technology trends for 2021. https://www.gartner.com/smarterwithgartner/gartner-top-strategic-technology-trends-for-2021. Gartner.
Peng, P., Zou, L., Özsu, M.T., Chen, L., & Zhao, D. (2016). Processing sparql queries over distributed rdf graphs. The VLDB Journal, 25, 243–268.
Pokorný, J. (2016). Conceptual and database modelling of graph databases. In Int. Symp. on database engineering and application systems (IDEAS) (pp. 370–377).
Quemy, A. (2019). Data pipeline selection and optimization. In Int. Workshop on design, optimization, languages and analytical processing of big data, CEUR workshop proceedings, Vol. 2324.
Quemy, A. (2020). Two-stage optimization for machine learning workflow. Information Systems, 92, 101483.
Richardson, J., Schlegel, K., Sallam, R., Kronz, A., & Sun, J. (2021). Magic quadrant for analytics and business intelligence platforms. https://www.gartner.com/doc/reprints?id=1-1YOXON7Q&ct=200330&st=sb. Gartner.
Romero, O., & Wrembel, R. (2020). Data engineering for data science: Two sides of the same coin. Int. Conf. on big data analytics and knowledge discovery DAWAK, LNCS, vol. 12393, pp. 157–166. Springer.
Romero, O., Wrembel, R., & Song, I. (2020). An alternative view on data processing pipelines from the DOLAP 2019 perspective. Information Systems 92.
Salka, C. (1998). Ending the MOLAP/ROLAP debate: Usage based aggregation and flexible HOLAP. In Int. Conf. on data engineering (ICDE) (p. 180).
Sardianos, C., Varlamis, I., Chronis, C., Dimitrakopoulos, G., Alsalemi, A., Himeur, Y., Bensaali, F., & Amira, A. (2021). The emergence of explainability of intelligent systems: Delivering explainable and personalized recommendations for energy efficiency. Int. Journal of Intelligent Systems, 36(2), 656– 680.
Sawadogo, P.N., & Darmont, J. (2021). On data lake architectures and metadata management. Journal of Intelligent Information Systems, 56(1), 97–120.
Schuetz, C.G., Bozzato, L., Neumayr, B., Schrefl, M., & Serafini, L. (2021). Knowledge graph OLAP. Semantic Web, 12(4), 649–683.
Tsikrika, T., & Manolopoulos, Y. (2016). A retrospective study on the 20 years of the ADBIS conference. In New trends in databases and information systems, communications in computer and information science, (Vol. 637 pp. 1–15). Springer.
Vassiliadis, P., & Sellis, T.K. (1999). A survey of logical models for OLAP databases. SIGMOD Record, 28(4), 64–69.
Witt, C., Bux, M., Gusew, W., & Leser, U. (2019). Predictive performance modeling for distributed batch processing using black box monitoring and machine learning. Information Systems, 82, 33–52.
Wrembel, R., Abelló, A., & Song, I. (2019). DOLAP Data warehouse research over two decades: Trends and challenges. Information Systems, 85, 44–47.
Acknowledgements
The Guest Editors thank all friends and colleagues who contributed to the success of this special section. We appreciate the effort of all the authors who were attracted by the topics of the ADBIS conference and submitted scientific contributions.
Special thanks go to the Editors-In-Chief Prof. Ram Ramesh and Prof. H. Raghav Rao, for offering this special section to the ADBIS conference and to the Springer staff, namely to Kristine Kay Canaleja and Aila O. Asejo-Nuique, for efficient cooperation.
We appreciated the work done by the reviewers who offered their expertise in assessing the quality of the submitted papers by providing constructive comments to the authors. The list of reviewers includes:
–Andras Benczur (Eötvös Loránd University, Hungary)
–Paweł Boiński (Poznan University of Technology, Poland)
–Omar Boussaid (Univeristé Lyon 2, France)
–Theo Härder (Technical University Kaiserslautern, Germany)
–Petar Jovanovic (Universitat Politècnica de Catalunya, Spain)
–Sebastian Link (University of Auckland, New Zealand)
–Angelo Montanari (University of Udine, Italy)
–Kestutis Normantas (Vilnius Gediminas Technical University, Lithuania)
–Carlos Ordonez (University of Houston, USA)
–Szymon Wilk (Poznan University of Technology, Poland)
–Vladimir Zadorozhny (University of Pittsburgh, USA)
Author information
Authors and Affiliations
Corresponding author
Additional information
Publisher’s Note
Springer Nature remains neutral with regard to jurisdictional claims in published maps and institutional affiliations.
Rights and permissions
About this article

Cite this article
Darmont, J., Novikov, B., Wrembel, R. et al. Advances on Data Management and Information Systems. Inf Syst Front 24, 1–10 (2022). https://doi.org/10.1007/s10796-021-10235-4
Accepted:
Published:
Issue Date:
DOI: https://doi.org/10.1007/s10796-021-10235-4