Abstract
The novel coronavirus (COVID-19) has unleashed havoc across different countries and was declared a pandemic by the World Health Organization. Since certain evidences indicate a direct relationship of various viruses with the weather (temperature in particular), the same is being speculated about COVID-19; however, it is still under investigation as the pandemic is advancing the world over. In this study, we tried to analyze the spread of COVID-19 in the Indian subcontinent with respect to the local temperature regimes from March 9, 2020, to May 27, 2020. To establish the relation between COVID-19 and temperature in India, three different ecogeographical regions having significant temperature differences were taken into consideration for the analysis. We observed that except Maharashtra, Rajasthan and Kashmir showed a significantly positive correlation between the number of COVID-19 cases and the temperature during the period of study. The evidences based on the results presented in this research lead us to believe that the increasing temperature is beneficial to the COVID-19 spread, and the cases are going to rise further with the increasing temperature over India. We, therefore, conclude that the existing data, though limited, suggest that the spread of COVID-19 in India is not explained by the variation of temperature alone and is most likely driven by a host of other factors related to epidemiology, socioeconomics and other climatic factors. Based on the results, it is suggested that temperature should not be considered as a yardstick for planning intervention strategies for controlling the COVID-19 pandemic.
1 Introduction
World Health Organization (WHO), on March 11, 2020, declared COVID-19 as a pandemic (WHO 2020). The novel coronavirus (2019-nCoV) disease first appeared in Wuhan city of China and laid down its global footprints since 2019 as a result of its highly contagious nature (Lu et al. 2018; Chen et al. 2020; Bogoch et al. 2020). The virus belongs to a category of viruses called severe acute respiratory syndrome-related coronavirus (SARS-CoV) and is associated with a wide range of human respiratory diseases (Huang et al. 2020; Xu et al. 2020; Van der Hoek et al. 2004). The symptoms of the viruses are flu-like that are least transmissible in hot and humid environments (Lowen et al. 2007; Barreca and Shimshack 2012). Due to the familial relationship of COVID-19 with SARS-CoV and other flu viruses, health officials have repeatedly claimed that higher temperatures in the coming seasons will slow down COVID-19 infections as the breakdown of the lipid layer of the viruses occurs at higher temperatures (Schoeman and Fielding 2019). Some studies have linked the transmission and survival time of the coronavirus on surfaces to temperature (Van Doremalen et al. 2013). However, studies aimed at determining the exact range of temperatures and time of exposure in that range, for the virus to cease functionality and ability to survive, is yet to be established (Lauer et al. 2020).
This paper tries to statistically understand the spread of COVID-19 in selected regions of India, having a significant variation in mean annual temperatures. To establish the relationship between the changing temperature and the contagion of COVID-19, three ecologically and climatically distinct regions were considered: the subtropical Kashmir valley (Romshoo et al. 2020), desertic Rajasthan (Sikka 1997) and coastal Maharashtra (Naik et al. 2007). Since these three different regions have significant variations in temperature, these were considered ideal sites for validating the hypothesis of the temperature-COVID-19 dependency.
Figure 1 shows the location of the study sites. The three regions have distinct climatic regimes. In the case of the Kashmir valley, the climate is mainly governed by its unique location between the two mountain ranges, Pir Panjal and Greater Himalaya. Having an average altitude of 1545 m, the temperature of the valley varies from – 9 °C in winter months to 38 °C in summer months. The mean maximum and minimum temperatures of the Kashmir valley are 19.27 and 7.29 °C, respectively (Meraj et al. 2015; Gujree et al. 2017). Mumbai has a wet and dry, tropical climate which is moderately hot and significantly humid. Bounded by the Arabian Sea from the west, and located at tropics, temperatures in Mumbai do not fluctuate much throughout the year. The mean maximum and minimum temperatures of the Mumbai are 31 °C and 21.5 °C, respectively (Saha et al. 2017), while in the case of Jaipur, Rajasthan, the climate is semiarid that characteristically has scorching summers and short spans of mild-warm winters (Mathew et al. 2017). Figure 2 shows the variation of temperature and the growth curve of the COVID-19 among the selected regions from May 9, 2020, until May 27, 2020.

(Courtesy: Google Earth))
Location of the different ecogeographical regions of India. a Union of India, b Maharashtra, c Rajasthan and d Kashmir.
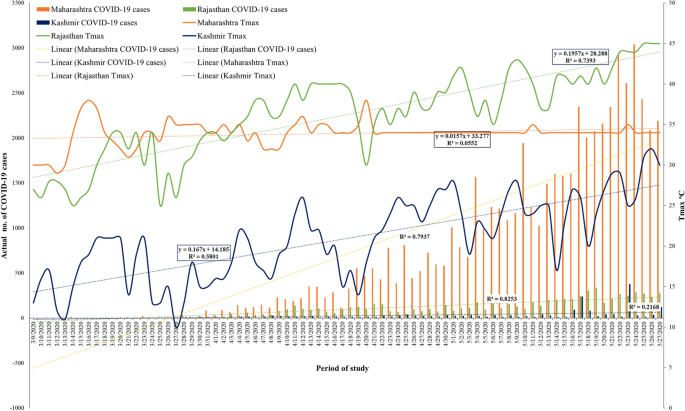
Graph representing the daily increase of the COVID-19 cases and temperature for the three regions from May 9, 2020, until May 27, 2020
All the three studied regions of India have witnessed the highest number of the COVID-19 cases (MOHFW 2020), and the numbers are soaring. In the backdrop of the various studies that have linked the spread of the various viruses to the weather (Sajadi et al. 2020; Tosepu et al. 2020), particularly temperature, it was thought scientifically logical to test whether there is any significant linkage between the temperature and COVID-19 spread in these three regions. It must be emphasized here that this work only analyzes the relationship between temperature and the number of cases of COVID-19 in these three regions. However, this study did not consider the other factors that are reported to influence the spread of virus related to other weather parameters, epidemiology and demography (Tian et al. 2020; Peng et al. 2020; Tang et al. 2020). Hence, any assumption about the factors that determine the spread of COVID-19 would lack any prudency. In light of the differences of opinion about the role of temperature on COVID-19 spread, it is too early to assume that the increasing temperature might check the spread COVID-19 in India and other tropical countries that are in the scorching summers. Only a longer time series of the temperature data at the end of the summer shall provide an insight into the impact of the temperatures on the pandemic spread.
2 Methods and materials
The temperature data were obtained from the Indian Meteorological Department from March 9, 2020, to May 27, 2020, for time series analysis in this study. Mumbai meteorological station data, the capital of Maharashtra, is used as a representative for Maharashtra region, the station data of Jaipur, the capital city of Rajasthan and Srinagar station data, the capital of Kashmir for the Kashmir region. The choice of the meteorological stations is based on the fact that these three regions have marked the maximum no. of COVID cases and COVID hot spots in the country (MOHFW 2020). A significant variability of temperature exists among the regions; however, temperature data that are representative of a whole region have been used in similar other correlation studies by various authors (Pirouz et al. 2020; Ujiie et al. 2020). Data regarding the confirmed COVID-19 cases for each region were taken from the official Web sites, arogya.maharashtra.gov.in (Maharashtra), http://www.rajswasthya.nic.in/(Rajasthan) and www.diprjk.nic.in (Kashmir). We analyzed the weather data (Tmax) only of all the three study regions to find out any pattern and relationship between COVID-19 and the temperature. Tmax was used as an indicator to establish any relation between temperature and COVID-19 contagion.
3 Results and discussion
3.1 Statistical analysis
The lowest, highest and mean value of the Tmax for the three regions during the observation period is provided in Table 1. From the data provided in the table, it is clear that the mean value of Tmax for Maharashtra, Rajasthan and Kashmir valley is 34 °C, 36 °C and 21 °C, respectively. The rate of change of the temperature for Maharashtra is minimum and almost flat (R2 = 0.05), while as for the Rajasthan and Kashmir region, temperature shows a significant increasing trend, and the average rate of change of the temperature is 0.19 °C and 0.16 °C per day, respectively, during the period of study (Fig. 2). Maharashtra is showing an increase in the number of confirmed cases from 2 on March 9, 2020, to 56,948 on May 27, 2020, with observed temperature range of 29 to 38 °C, an increase of 23.68% during the period. Rajasthan shows an increase of 3 cases on March 9, 2020, to 7816 on May 27, 2020, with the observed temperature range 25 to 45 °C, an increase of 44.44% during the period, and Kashmir shows an increase of 0 cases on March 9, 2020, to 1535 cases on May 27, 2020, with the observed temperature range of 10 to 32 °C, an increase of 68.75% during the period (Table 1). Figure 2 shows the graph representing the daily increase of the new COVID-19 cases and temperature for the three regions during the period of study.
For Maharashtra, there is no statistically significant correlation between the increase in maximum temperature and the total no. of daily confirmed cases of COVID-19 (r = 0.09331, Fig. 3a). Table 2 shows the correlation representing the relationship between the temperature and COVID-19 cases in Maharashtra. Since the onset of COVID-19, temperature has not changed much in Maharashtra (R2 = 0.0552, Fig. 3b). Therefore, in the case of Maharashtra, the dependency of COVID-19 on temperature is not established in any significant manner.

a Scatterplot showing the statistical relationship between the COVID-19 cases and Tmax in Maharashtra for the period of analysis, b trend analysis of the variation of Tmax with COVID-19 cases for the period of analysis in Maharashtra
To investigate further, we chose regions where the temperature has changed significantly from the onset of a pandemic, and thus Rajasthan and Kashmir were selected. In both regions, temperatures have increased substantially since the beginning of the pandemic. Figure 4b shows the Tmax variation during the pandemic in Rajasthan. The temperature in Rajasthan has increased significantly during the pandemic, as is depicted by very high R2 = 0.7393. The Tmax variation during the pandemic in Kashmir is illustrated in Fig. 5b (R2 = 0.5801).

Trend analysis of the variation of Tmax with COVID-19 cases for the period of analysis a in Rajasthan, b in Kashmir

Scatterplot showing the correlation and regression between the COVID-19 cases and Tmax for the period of analysis a in Rajasthan, b in Kashmir
For Rajasthan, there is a statistically significant correlation (r = 0.7623) between the increase in the temperature and the total no. of daily confirmed cases of COVID-19, and the relationship is positive also (Table 2, Fig. 4a). Hence, it implies with an increase in temperature in Rajasthan; the number of positive COVID-19 cases has also increased significantly.
In the case of Kashmir, a significantly positive correlation (r = 0.7558) was found between the increase in temperature and total no. of daily confirmed cases of COVID-19, as is shown in Table 2, Fig. 5a. These results indicate that increase in COVID-19 cases has been accompanied by the rise in temperatures of Rajasthan and Kashmir. These results are contrary to what has been witnessed in Maharashtra, which showed no influence of temperature on pandemic spread.
3.2 Major inferences
We observed that with an increase in Tmax during the pandemic period, confirmed COVID-19 cases have increased in the case of Rajasthan and Kashmir. However, the incidence of the pandemic has risen significantly in Maharashtra without a corresponding rise in Tmax observed during the study period. The observed temperatures during the pandemic in the case of Maharashtra and Rajasthan were comparatively similar, as is shown in Fig. 2. The temperatures of the first day of the analysis period in Maharashtra and Rajasthan were 30 °C and 27 °C, respectively. Hence, the assumption that at higher temperatures, the COVID-19 lethality, survival and spread may lessen is not valid. In contrast, the pandemic temperatures of Kashmir are relatively lower, while the temperatures of Maharashtra and Rajasthan are high, soaring and almost in the same range, as is shown in Table 1.
The primary conclusion drawn from this investigation is that the temperature alone cannot be taken as a parameter governing COVID-19 spread and there is a complex set of parameters related to other weather parameters, demography, socioeconomics, immunology and epidemiology that need to be considered as more data become available with the control of the pandemic. The study shows that Maharashtra’s COVID-19 spread is entirely independent of the temperature regime. Though in this state, temperatures have not increased considerably since the inception of the cases of COVID-19; however, the reported cases increased significantly. Moreover, the maximum no. of cases are observed on those days when the Tmax was 34 °C (Table 1, Fig. 3a). It clearly shows that in Maharashtra, COVID-19 cases occurred irrespective of the temperature regime of the state. This finding is in tune with that of Prata et al. (2020) which suggested that the relationship between the average temperature and COVID-19 confirmed cases was approximately linear in the range of less than 25.8 °C, which became flat above 25.8 °C.
Contrary to Maharashtra, Rajasthan and Kashmir have shown that with increasing temperatures, COVID-19 cases have also increased in a statistically significant manner. This observation is again in contravention of the theory predicting the decrease in the spread of the COVID-19 pandemic with the increase in temperature up to a certain limit (Prata et al. 2020). We observed that the increasing temperature within the given range observed during the period for Rajasthan and Kashmir sites might provide a beneficial environment for the coronavirus to grow and spread as evident by the increasing trend of the reported COVID-19 cases with the increasing temperature (Fig. 4a, 5a).
These evidences based on the results from the three ecogeographically distinct regions of India lead us to believe that the assumption that temperature is negatively influencing and harmful to the virus contagion (Livadiotis 2020), is not supported by the observed COVID-19 cases and temperature rise in the given range and pattern. Therefore, we suggest that the COVID-19 cases are not going to see any decline or stability with the expected increasing temperature over India, as evident from the results over the three study sites. Instead, the cases shall continue to rise, as is being witnessed, with or without any changes in the temperatures. However, the availability of the more extended time series of data along with other meteorological parameters would provide a more in-depth insight into the pattern and behavior of the virus under changing weather conditions.
We also know that one of the vital parameters that govern the reporting of the number of confirmed COVID-19 cases in any day is the testing rate (Wang et al. 2020). In India, the frequency of COVID-19 daily testing has also increased between March 9, 2020, and May 27, 2020 (Singhal 2020). Up to 15 May, India carried out COVID-19 tests of around 1540 people per million, which is very high against the 94.5 per million population in late March (Sharma 2020). MOHFW reports it in its 30 April bulletin that India has conducted 758 tests per million people with a total of 33,050 positive COVID-19 cases in India until then. Therefore, testing has increased manifold day by day. Epidemiologists explain the need for increased testing rates in terms of the non-declination of the prevalence of the COVID-19 infection. These COVID-19 testing numbers are very high compared to the early days of the onset of the reporting of COVID-19 infections in the country. Hence, one of the possibilities could be that the cases were very high in the beginning, too.
We conclude that, to precisely determine the relationship of temperature and COVID-19, factors such as testing, structure and dynamics of the social community, policies of the government, demographic profile, epidemiological data and reproduction rate of the virus need to be evaluated in order to determine the one-on-one dependency (Jia et al. 2020a).
One of the limitations of this study is that we have used only three regions. Due to data and time constraints, it was deemed better to analyze three distinct ecogeographical regions to represent India. However, the conclusions would have been more robust if other regions and more extended time series of temperature and other parameters were also analyzed. But because of the widespread reports of the harmful impacts of the rising temperatures on the virus spread, it was expedient to do a quick study using the temperature alone to test the hypothesis and was aimed so that the healthcare strategies do not wait for higher temperatures to control COVID-19 and instead focus on the adoption of robust and holistic COVID pandemic control measures requiring strict social distancing, strengthening of the healthcare infrastructure and robust health care.
It has been proclaimed by the leading health organizations of the world that the pandemic is not going to end sooner. Hence, our aim in this study was to guide the stakeholders that unless many other factors are not known, using temperature alone as a criterion for develo** decisions regarding COVID-19 is ill-advised. We recommend the development of a comprehensive COVID-19 contagion model that takes into consideration maximum possible parameters governing the virus lethality and mobility. Unless that is not imbued, any hope and strategy based on the COVID-19 and temperature relationship is not going to yield anything positive.
References
Barreca, A. I., & Shimshack, J. P. (2012). Absolute humidity, temperature, and influenza mortality: 30 years of county-level evidence from the United States. American Journal of Epidemiology, 176(suppl_7), S114–S122.
Batista, F. M. D. A., Mascarenhas, M. D. M., Marinelli, N. P., Albuquerque, L. P. D. A., Rodrigues, M. T. P., & Sousa, I. D. B. D. (2020). COVID-19 in Piauí: Initial scenario and perspectives for co**. Revista da Sociedade Brasileira de Medicina Tropical, 53.
Bogoch, I. I., Watts, A., Thomas-Bachli, A., Huber, C., Kraemer, M. U., & Khan, K. (2020). Potential for global spread of a novel coronavirus from China. Journal of Travel Medicine, 27(2), taaa011.
Borjas, G. J. (2020). Demographic determinants of testing incidence and COVID-19 infections in New York City neighborhoods (No. w26952). National Bureau of Economic Research.
Chen, N., Zhou, M., Dong, X., Qu, J., Gong, F., Han, Y., et al. (2020). Epidemiological and clinical characteristics of 99 cases of 2019 novel coronavirus pneumonia in Wuhan, China: A descriptive study. The Lancet, 395(10223), 507–513.
Gujree, I., Wani, I., Muslim, M., Farooq, M., & Meraj, G. (2017). Evaluating the variability and trends in extreme climate events in the Kashmir Valley using PRECIS RCM simulations. Modeling Earth Systems and Environment, 3(4), 1647–1662.
Huang, C., Wang, Y., Li, X., Ren, L., Zhao, J., Hu, Y., et al. (2020). Clinical features of patients infected with 2019 novel coronavirus in Wuhan, China. The Lancet, 395(10223), 497–506.
Jia, J., Ding, J., Liu, S., Liao, G., Li, J., Duan, B., Wang, G., & Zhang, R. (2020). Modeling the control of COVID-19: Impact of policy interventions and meteorological factors. ar**v preprint ar**v:2003.02985.
Kanga, S., Meraj, G., Farooq, M., Nathawat, M. S., & Singh, S. K. (2020a). Risk assessment to curb COVID-19 contagion: A preliminary study using remote sensing and GIS. https://doi.org/10.21203/rs.3.rs-37862/v1.
Kanga, S., Sudhanshu, Meraj, G., Farooq, M., Nathawat, M. S., & Singh, S. K. (2020b). Reporting the management of COVID-19 threat in India using remote sensing and GIS-based approach. Geocarto International. https://doi.org/10.1080/10106049.2020.1778106.
Lauer, S. A., Grantz, K. H., Bi, Q., Jones, F. K., Zheng, Q., Meredith, H. R., et al. (2020). The incubation period of coronavirus disease 2019 (COVID-19) from publicly reported confirmed cases: Estimation and application. Annals of Internal Medicine, 172(9), 577–582.
Livadiotis, G. (2020). Statistical analysis of the impact of environmental temperature on the exponential growth rate of cases infected by COVID-19. PLoS ONE, 15(5), e0233875.
Lowen, A. C., Mubareka, S., Steel, J., & Palese, P. (2007). Influenza virus transmission is dependent on relative humidity and temperature. PLoS Pathogens, 3(10), e151.
Lu, H., Stratton, C. W., & Tang, Y. W. (2018). Outbreak of pneumonia of unknown etiology in Wuhan China: The mystery and the miracle. Journal of Medical Virology, 92, 401–402.
Mathew, A., Khandelwal, S., & Kaul, N. (2017). Investigating spatial and seasonal variations of urban heat island effect over Jaipur city and its relationship with vegetation, urbanization and elevation parameters. Sustainable Cities and Society, 35, 157–177.
Meraj, G., Romshoo, S. A., Yousuf, A. R., Altaf, S., & Altaf, F. (2015). Assessing the influence of watershed characteristics on the flood vulnerability of Jhelum basin in Kashmir Himalaya: Reply to comment by Shah 2015. Natural Hazards, 78(1), 1–5.
MOHFW. (2020). Ministry of Health and Family Welfare, Government of India (GOI) 2020. www.mohfw.gov.in. Accessed 31 April, 2020.
Naik, P. K., Dehury, B. N., & Tiwari, A. N. (2007). Groundwater pollution around an industrial area in the coastal stretch of Maharashtra state, India. Environmental Monitoring and Assessment, 132(1–3), 207–233.
Paynter, S. (2015). Humidity and respiratory virus transmission in tropical and temperate settings. Epidemiology and Infection, 143(6), 1110–1118.
Peng, X., Xu, X., Li, Y., Cheng, L., Zhou, X., & Ren, B. (2020). Transmission routes of 2019-nCoV and controls in dental practice. International Journal of Oral Science, 12(1), 1–6.
Pirouz, B., Shaffiee Haghshenas, S., Shaffiee Haghshenas, S., & Piro, P. (2020). Investigating a serious challenge in the sustainable development process: Analysis of confirmed cases of COVID-19 (a new type of coronavirus) through a binary classification using artificial intelligence and regression analysis. Sustainability, 12(6), 2427.
Prata, D. N., Rodrigues, W., & Bermejo, P. H. (2020). Temperature significantly changes COVID-19 transmission in (sub)tropical cities of Brazil. Science of Total Environment. https://doi.org/10.1016/j.scitotenv.2020.138862.
Romshoo S.A., Rashid I., Altaf S., & Dar G. H. (2020). Jammu and Kashmir State: An overview. In: Dar G., Khuroo A. (eds) Biodiversity of the Himalaya: Jammu and Kashmir State. Topics in biodiversity and conservation (Vol. 18). Singapore: Springer. https://doi.org/10.1007/978-981-32-9174-4_6
Saha, U., Chakraborty, R., Maitra, A., & Singh, A. K. (2017). East-west coastal asymmetry in the summertime near-surface wind speed and its projected change in future climate over the Indian region. Global and Planetary Change, 152, 76–87.
Sajadi, M. M., Habibzadeh, P., Vintzileos, A., Shokouhi, S., Miralles-Wilhelm, F., & Amoroso, A. (2020). Temperature and latitude analysis to predict potential spread and seasonality for COVID-19. Available at SSRN 3550308.
Schoeman, D., & Fielding, B. C. (2019). Coronavirus envelope protein: Current knowledge. Virology Journal, 16(1), 69.
Sharma, S. (2020). India tops 2 million Covid-19 tests. https://www.hindustantimes.com/india-news/india-tops-2-million-covid-19-tests/story-0wVEATp5FNvBbrGlLd8WyK.html. Retrieved June 01, 2020.
Sikka, D. R. (1997). Desert climate and its dynamics. Current Science, 72, 35–46.
Singhal, T. (2020). A review of coronavirus disease-2019 (COVID-19). The Indian Journal of Pediatrics 1–6.
Tang, Y. W., Schmitz, J. E., Persing, D. H., & Stratton, C. W. (2020). Laboratory diagnosis of COVID-19: Current issues and challenges. Journal of Clinical Microbiology, 58(6).
Thunström, L., Newbold, S. C., Finnoff, D., Ashworth, M., & Shogren, J. F. (2020). The benefits and costs of using social distancing to flatten the curve for COVID-19. Journal of Benefit-Cost Analysis 1–27.
Tian, S., Hu, N., Lou, J., Chen, K., Kang, X., **ang, Z., et al. (2020). Characteristics of COVID-19 infection in Bei**g. Journal of Infection, 80(4), 401–406.
Tosepu, R., Gunawan, J., Effendy, D. S., Lestari, H., Bahar, H., & Asfian, P. (2020). Correlation between weather and Covid-19 pandemic in Jakarta, Indonesia. Science of the Total Environment, 725, 138436.
Ujiie, M., Tsuzuki, S., & Ohmagari, N. (2020). Effect of temperature on the infectivity of COVID-19. International Journal of Infectious Diseases, 95(June 2020), 301–303.
van der Hoek, L., Pyrc, K., Jebbink, M. F., Vermeulen-Oost, W., Berkhout, R. J., Wolthers, K. C., et al. (2004). Identification of a new human coronavirus. Nature Medicine, 10(4), 368–373.
Van Doremalen, N., Bushmaker, T., & Munster, V. (2013). Stability of Middle East respiratory syndrome coronavirus (MERS-CoV) under different environmental conditions Eurosurveillance, 18, Article 20590
Wang, C. J., Ng, C. Y., & Brook, R. H. (2020). Response to COVID-19 in Taiwan: Big data analytics, new technology, and proactive testing. JAMA, 323(14), 1341–1342.
WHO. (2020). Coronavirus disease (COVID-19) outbreak. https://www.who.int/emergencies/diseases/novel-coronavirus-2019.
Xu, P., Sun, G. D., & Li, Z. Z. (2020). Clinical characteristics of two human to human transmitted coronaviruses: Corona virus disease 2019 versus middle east respiratory syndrome coronavirus. medRxiv.https://doi.org/10.1101/2020.03.08.20032821.
Zhong, B. L., Luo, W., Li, H. M., Zhang, Q. Q., Liu, X. G., Li, W. T., et al. (2020). Knowledge, attitudes, and practices towards COVID-19 among Chinese residents during the rapid rise period of the COVID-19 outbreak: A quick online cross-sectional survey. International Journal of Biological Sciences, 16(10), 1745.
Author information
Authors and Affiliations
Corresponding author
Ethics declarations
Conflict of interest
The authors declare no conflict of interest.
Additional information
Publisher's Note
Springer Nature remains neutral with regard to jurisdictional claims in published maps and institutional affiliations.
Rights and permissions
About this article

Cite this article
Meraj, G., Farooq, M., Singh, S.K. et al. Coronavirus pandemic versus temperature in the context of Indian subcontinent: a preliminary statistical analysis. Environ Dev Sustain 23, 6524–6534 (2021). https://doi.org/10.1007/s10668-020-00854-3
Received:
Accepted:
Published:
Issue Date:
DOI: https://doi.org/10.1007/s10668-020-00854-3