Abstract
Two full-scale building specimens were tested on the shake-table at the EUCENTRE Foundation laboratories in Pavia (Italy), to assess the effectiveness of an innovative timber retrofit solution, within a comprehensive research campaign on the seismic vulnerability of existing Dutch unreinforced masonry structures. The buildings represented the end-unit of a two-storey terraced house typical of the North-Eastern Netherlands, a region affected by induced seismicity over the last few decades. This building typology is particularly vulnerable to earthquake excitation due to lack of seismic details and irregular distribution of large openings in masonry walls. Both specimens were built with the same geometry. Their structural system consisted of cavity walls, with interior load-bearing calcium-silicate leaf and exterior clay veneer, and included a first-floor reinforced concrete slab, a second-floor timber framing, and a roof timber structure supported by masonry gables. A timber retrofit was designed and installed inside the second specimen, providing an innovative sustainable, light-weight, reversible, and cost-effective technique, which could be extensively applied to actual buildings. Timber frames were connected to the interior surface of the masonry walls and completed by oriented strands boards nailed to them. The second-floor timber diaphragm was stiffened and strengthened by a layer of oriented-strand boards, nailed to the existing joists and to additional blocking elements through the existing planks. These interventions resulted also in improved wall-to-diaphragm connections with the inner leaf at both floors, while steel ties were added between the cavity-wall leaves. The application of the retrofit system favored a global response of the building with increased lateral capacities of the masonry walls. This paper describes in detail the bare and retrofitted specimens, compares the experimental results obtained through similar incremental dynamic shake-table test protocols up to near-collapse conditions, and identifies damage states and damage limits associated with displacements and deformations.
1 Introduction
During the last few decades, gas extraction activities have exposed the region of Groningen, in the North-East area of The Netherlands, to induced seismicity. The affected area includes a stock of about 250.000 buildings, mainly consisting of unreinforced masonry (URM) structures not specifically designed for seismic resistance (Arup 2020). Following a series of low-intensity earthquake events which caused minor, yet diffuse damage in the region, a comprehensive research project was conceived to assess and eventually mitigate the local seismic risk (Dost et al. 2012; Dost and Kraaijpoel 2013; Bommer et al. 2016). Within this framework, the seismic hazard (Bourne et al. 2015), the local building stock fragility and fatality models (Crowley et al. 2017, 2019) and the associated seismic risk (van Elk et al. 2019) were to be analyzed and quantified.
Understanding the response of the local building stock to ground motions is essential for a complete regional seismic risk assessment. However, no specific studies or empirical data on Dutch buildings were available until 2014, since the country was not historically prone to natural seismicity. Therefore, an extensive experimental and numerical campaign was launched at the EUCENTRE Foundation laboratories (Pavia, Italy), to investigate the seismic behavior of Dutch URM buildings and to support the development of the regional seismic risk model. The campaign included static or quasi-static tests on materials, masonry assemblies, and structural components, as well as dynamic shake-table tests on full-scale buildings and subsystems (Graziotti et al. 2019a, b), numerical simulations, and analytical formulations (Malomo et al. 2018; Kallioras et al. 2019; Tomassetti et al. 2018). Experimental tests were also conducted in parallel at the Delft University of Technology (Jafari et al. 2017; Rots et al. 2017; Esposito et al. 2019).
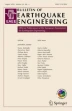
Two-storey terraced houses built in the late ‘70s–early ‘80s (Fig. 1) constitute one of the most common and earthquake-vulnerable building typologies within the Groningen region. This residential typology combines structurally-independent adjacent units, with discontinuous floors and roofs usually supported by single-wythe calcium-silicate (CS) walls. Since party walls consist of two independent CS leaves, each unit is structurally separated from the adjacent ones. A structural unit has typical dimensions of 5-to-6 m in the longitudinal direction, parallel to the front and back façades, and 7-to-9 m in the transverse one. The entire building is commonly enveloped by a continuous single-wythe clay (CL) veneer. The resulting cavity walls then consist of an inner CS leaf with load-bearing function and an outer CL veneer with architectural and insulation purposes, separated by an 80-mm air gap and connected with each other by steel ties. Large openings are irregularly distributed on the front and back façades. The first floor is typically built with precast reinforced concrete (RC) panels, completed by a cast-in-place top** slab. The second floor can be either a RC concrete slab or a timber structure. The roof usually consists of timber joists and planks, supported by CS masonry gables extending up from the transverse walls.
After a series of shake-table tests on a full-scale prototype and on subassemblies of a two-storey terraced-house end-unit with reinforced concrete slabs at both floors (Graziotti et al. 2017; Tomassetti et al. 2019a, b), information was still missing about the effects of highly-irregular opening distributions and second-floor flexible timber diaphragms. Moreover, the development of an innovative sustainable, light-weight, reversible, and cost-effective retrofit technique appeared necessary, to tackle the sources of vulnerability proper of this specific building typology. Therefore, two identical full-scale specimens, representing the end-unit of a typical two-storey terraced house, with unfavorable construction details, were designed, built, and tested on the shake-table of the EUCENTRE Foundation. The first specimen was subjected to an incremental unidirectional ground-motion sequence up to its near-collapse limit state in June 2018, aiming to define its dynamic response and damage evolution without any retrofit intervention (Miglietta et al. 2019). The second building was retrofitted with an innovative timber system while in pristine conditions, then tested starting with the same protocol and up to twice the input acceleration amplitude during December 2018 (Damiani et al. 2019).
This paper describes in detail the bare and retrofitted specimens, compares the two experimental dynamic responses up to near-collapse conditions, and identifies damage states and damage limits associated with displacements and deformations. All test results are available for free and can be downloaded upon request from http://www.eucentre.it/nam-project. Further details on the shared data can be found in Miglietta et al. (2019).

Typical terraced house of the Groningen area: a front façade, b lateral façade
2 Characteristics of the specimens
2.1 General overview
Both building specimens represented the end-unit of a Dutch two-storey URM cavity-wall terraced house of the late ‘70s–early ‘80s (Fig. 1). The transverse walls of terraced houses generally do not present openings, except for some end-unit gables (Fig. 1b), and can resist significant in-plane lateral forces. Given the high amount of openings in the front and back façades, these buildings are therefore more flexible and vulnerable in the longitudinal direction. The horizontal structures of adjacent units are discontinuous and rest only on CS party walls, consisting of two independent CS leaves, making each unit structurally separated from the other ones. For these reasons, an individual end-unit prototype (Fig. 2) could be easily isolated from the terraced house and tested uniaxially in the North-South direction, with the East and West longitudinal walls excited in their planes and the North and South transverse walls out-of-plane.
The plan dimensions were adapted to fit within the shake-table (Figs. 3, 4): in particular, the transverse length was reduced to 5.58 m, while the longitudinal one was set at 5.94 m. A total height of 7.83 m to the roof ridge was chosen. The first-floor RC slab and the second-floor timber joists spanned in the North-South direction, supported by the two transverse CS walls. Staircase openings were obtained in both floor diaphragms next to the North wall (Fig. 4b, c). Two gables extending above the transverse walls supported a 39°-pitch timber roof, with joists spanning in the North-South direction. The roof was finished by battens, counter-battens, and clay tiles. Some timber frames and shutters were also installed in window openings, to study the damage to non-structural elements. The specimens were built directly on a composite steel-concrete foundation, fastened to the shake-table.
The experimental seismic behaviour of the bare specimen formed the basis of the retrofit concept and design. In particular, lack of connections between masonry walls and floors did not allow the development of a global seismic response, and a local mechanism resulted in the second-floor timber diaphragm sliding above the second-storey piers (see Sect. 4.2). The main objective of the proposed solution was to promote a box-type global response, by improving connections throughout the structure (Magenes et al. 2014; Guerrini et al. 2019; Senaldi et al. 2020), enhancing in-plane and out-of-plane wall capacities, and stiffening the second-floor and roof flexible timber diaphragms (Senaldi et al. 2014). Moreover, desired features of the retrofit system were: (1) its sustainability, which led to the choice of timber as the main retrofit material; (2) its limited weight, promoted by using timber frames and oriented-strand board (OSB) panels rather than solid hardwood or glulam panels; (3) its reversibility, pursued by adopting dry connections between timber elements and existing masonry; and (4) its cost-effectiveness, associated with its ease of construction.

Overall photos of the specimens: a North and West façades, b South and East façades, c North façade, d South façade. Shaking direction indicated by yellow arrows

Elevations of the load-bearing CS inner leaves from the outside: a West façade, b East façade, c North façade, d South façade. Units of cm

Plan views of the bare structure: a ground floor, b first-floor RC slab, c second-floor timber diaphragm. Units of cm
2.2 Details of the bare structure
The structural details replicated common features of the Dutch two-storey URM cavity-wall terraced houses of the late ‘70s–early ‘80s. The masonry consisted of a single-wythe, 102-mm-thick CS inner leaf and a single-wythe, 100-mm-thick CL outer leaf, separated by a gap of approximately 80 mm (Figs. 3, 4). The CS bricks had dimensions of 212 × 102 × 71 mm while the CL bricks of 210 × 100 × 50 mm; mortar joints had thickness of 10 mm in both leaves. Only the inner CS leaf was continuous along the entire perimeter of the house; the outer CL leaf was not present on the South side, as in reality the adjacent residential unit would border with it (Figs. 2, 4). Steel ties granted connection between inner and outer leaves, distributed as shown in Fig. 3 with a density of approximately 1 tie/m2. This tie density was deemed representative of lower-bound conditions for the Groningen area, excluding cases of extreme and total corrosion. These ties had a diameter of 3.4 mm and a length of 200 mm. They were embedded in the horizontal mortar bed-joints during construction of the walls. The hooked end extended within the inner leaf for 60 mm, while the bent end was embedded in the CL veneers for 60 mm (Fig. 5a).
Four pairs of precast reinforced concrete lintels were placed above the first-storey openings, supported for 100 mm on the masonry walls at each end (Figs. 3a, b, 5b). The lintels for the CS leaf had cross-section dimensions of 100 × 150 mm, corresponding to the height of two brick courses and one mortar joint, while those for the CL leaf had dimensions of 100 × 170 mm, as the height of three brick courses and two mortar joints.
The first floor consisted of a 160-mm-thick RC slab, reproducing the mass contributed by a hollow-core RC floor structure and by superimposed dead and live loads. The thickness was locally reduced to 150 mm over a 140-mm-wide strip along the perimeter, to match the height of two CS bricks and a horizontal mortar joint. The slab was monolithically precast aside and subsequently placed on a mortar layer above the CS masonry leaves. It rested on the North and South walls only, while a gap was left atop the East and West walls: this operation was intended to load the transverse walls, without applying any direct overburden to the longitudinal ones in static conditions (Fig. 5c). The gap was then filled with mortar, after exhaustion of concrete creep deformations. Four 0.45 × 0.55-m holes were created in the RC slab, to fit a steel frame with collapse-safety and displacement-reference functions (Fig. 4b).
The second floor was made of 185 × 18-mm tongue-and-groove planks supported by eight 100 × 240-mm timber joists, spanning continuously between the North and South CS walls with an average center-to-center spacing of 600 mm (Fig. 4c). Two pairs of 100 × 240-mm timber spreader beams were placed above the inner and outer leaves of the East and West façades, serving also as lintels for the second-storey openings (Figs. 2, 3, 4). The planks were fastened to the joists by two 2-mm-diameter, 60-mm-long nails at each intersection. Four 0.45 × 0.75-m holes were provided to accommodate the safety and reference steel frame. 235 × 245-mm L-shape steel anchors, with a diameter of 14 mm, were fastened to each joist end by three 5-mm-diameter timber screws, passed through the CS wall, and bore against the exterior surface of the CS leaf, enhancing the wall-to-diaphragm connection (Figs. 3c, d, 5d).
A 1.35 × 0.91-m staircase opening was provided on the North side of the RC slab (Fig. 4b). Similarly, a 1.67 × 0.94-m hole was provided in the timber floor, with a transverse 100 × 240-mm timber beam supporting the joists interrupted by the opening (Figs. 4c, 5e); timber-to-timber connections were obtained with steel hangers fastened to the joists. The staircase holes left that region of the North CS wall locally unrestrained against out-of-plane actions and free from direct vertical loads except for those applied by the roof. The dimensions of these openings were chosen to allow continuity of the steel reinforcement or of the timber joists, while accommodating four additional holes in the diaphragms.
Two gables extended above the transverse North and South façades, supporting a 39° pitched timber roof. Openings can be frequently observed in the end-unit gables of typical terraced house of the Groningen region (Fig. 1b). For this reason, the building prototype presented a trapezoidal window at the top of the North side (Figs. 2c, 3c). A timber lintel, inclined as the roof pitches, provided support for the roof joist landing above the opening and was connected to them by the same steel hangers used for the staircase hole framing at the second floor (Fig. 3c).
The timber roof structure consisted of a ridge-beam, two spreader beams above the longitudinal outer leaves (already mentioned in the second-floor description), and three intermediate joists on each side, with the same cross-section as the second-floor joists and spaced at approximately 0.9 m center-to-center (Fig. 3c, d). Tongue-and-groove 185 × 20-mm planks were fastened with two 2-mm-diameter, 60-mm-long nails at each intersection with the roof joists. The connection between CS leaves and roof joists was further improved by the same L-shape steel anchors used for the second-floor joists (Figs. 3c, d, 5d). The ridge beam and roof joists extended through the North façade CL outer leaf; two 20 × 240-mm timber cover plates hid their ends and were fastened to them by two 2-mm-diameter, 60-mm-long nails each (Fig. 2c). However, two 6.5-mm-diameter, 240-mm-long screws, connected the cover plates to the spreader beams through the masonry leaf. Battens and counter-battens were nailed above the planks, while clay tiles completed the roof (Fig. 5f).
Two window timber frames were installed in both building specimens: one in the large 3.23 × 2.11-m first-storey opening of the West façade, the other one in the North gable trapezoidal opening, as shown in Fig. 2a, c. A 6-mm-thick anti-burst glass was provided to the southern shutter of the first-storey window. In the retrofitted specimen, a window frame was mounted also in one of the second-storey openings of the East-façade, because severe interstorey displacement demands were recorded at this location while testing the bare prototype.
A very stiff steel frame was firmly bolted to the shake-table, inside the building prototypes, with two main goals: providing a safety restraint in the event of partial or global collapse during the dynamic tests, and serving as a nearly rigid reference system to measure displacements with respect to the shake-table. The steel frame columns passed through four holes provided in both floor diaphragms (Figs. 4, 5g). Displacements allowances of ± 125 mm and ± 270 mm were left in the shaking direction at the first and second floor, respectively, and of ± 125 mm in the perpendicular one at both floors. Timber stoppers were provided to eventually absorb impacts.

Bare structure construction photos: a top view of the cavity-wall section, b first-storey inner-leaf lintel, c first-floor RC slab connection detail above longitudinal CS leaves, d L-shape steel anchors between second-floor joists and transverse CS wall, e second-floor framing at staircase hole, f roof finishes, g internal steel rigid frame
Loose steel cables connected the ridge-beam to the steel frame, preventing possible collapse of the roof which could severely damage the testing equipment. The cables allowed a maximum 200-mm displacement of the ridge-beam with respect to the steel frame in the North-South direction without interfering with the prototype response.
2.3 Details of the retrofit system
To match the objectives mentioned earlier, a timber retrofit solution was devised stemming from the out-of-plane strengthening of masonry piers investigated by Giaretton et al. (2016), Dizhur et al. (2017) and Cassol et al. (2021), which relies on vertical timber posts working as “strong-backs” connected to the internal surface of the walls. The system was then extended to improve also the piers in-plane strength and displacement capacities, by adding horizontal nogging (or blocking) members between posts, and by nailing OSB panels to the resulting frame as done for timber shear-walls (AWC 2008). A preliminary study on the proposed system was carried out on two CS single-leaf piers, subjected to quasi-static in-plane shear-compression tests (Guerrini et al. 2020).
Figure 6 shows the main details of the retrofit system installed on the second specimen. Top and bottom timber sill plates were provided along the entire wall lengths. Post-and-nogging frames were then built along the longitudinal East and West walls. Only vertical posts, without horizontal nogging, were used along the transverse North and South walls, where OSB panels were not applied. All timber elements had cross-sections of 80 × 60 mm, with the 60-mm side oriented perpendicular to the masonry walls. Timber posts were installed on the transverse and longitudinal sides at approximately 600-mm spacing, except for shorter slender piers, to achieve an in-plane strength increment of about 35% on the longest first-storey pier according to Guerrini et al. (2020).
Posts and nogging members were connected to each other by 70 × 70-mm steel angles with cross-section of 55 × 2-mm, fastened to each timber element by five 5-mm-diameter, 70-mm-long screws (Figs. 6a, 7a). The frames were connected to the masonry through 90 × 50-mm steel angles, with cross-section of 50 × 3-mm, at 600-mm spacing for out-of-plane strengthening purposes (Giaretton et al. 2016; Dizhur et al. 2017). The angles were fastened to timber by four 5-mm-diameter, 70-mm-long screws and to the masonry by M10 steel threaded bars of class 8.8 (Figs. 6a, b, 7a). These bars were anchored 50 mm inside the bricks with an epoxy adhesive.

Retrofit system details: a vertical section of the typical longitudinal wall retrofit, b timber frame applied to the longitudinal East wall, c OSB panels nailed to the longitudinal East wall frame, d completed retrofit of the transverse South wall

Retrofit system construction photos: a longitudinal-wall timber frame, b nailing of a OSB for in-plane strengthening of longitudinal walls, c completed transverse walls retrofit not including OSB panels
Along the longitudinal East and West walls, 18-mm-thick OSB panels were applied to the timber frames with 4-mm-diameter, 75-mm-long anker nails, spaced at 100 mm along all edge and intermediate overlap** (Figs. 6c, 7b). These panels were intended to increase the in-plane shear resistance of piers. Nogging elements and OSB panels were not mounted on the transverse North and South masonry walls, which offered a significant in-plane resistance to lateral loads and were strengthened only for out-of-plane action (Figs. 6d, 7c). Moreover, coupling between inner and outer leaves was improved by building the second specimen with a tie density of approximately 5 ties/m2 (Fig. 6a); in real applications, ties can be added by drilling through the masonry leaves and fastening new connectors to them before installation of the timber elements. This operation aimed at a better exploitation of the outer CL leaf structural resistance.
In addition to the masonry wall retrofit, the second-floor timber diaphragm was stiffened and strengthened to transfer 50% of the seismic storey shear while preventing first cracking of the second-storey East-wall piers. 18-mm-thick OSB panels were nailed to the existing planks using the same anker nails spaced at 50 mm along all board edges (Fig. 8a, c) following the American requirements for timber diaphragms (AWC 2008). 100 × 240-mm timber blocking beams were inserted between existing joists, to allow fastening along board edges perpendicular to the timber joists (Fig. 8b). Connection between blocking elements and joists was ensured by 70 × 70-mm steel angles with cross-section of 55 × 2-mm, fastened to each timber element by five 5-mm-diameter, 70-mm-long screws. Inner- and outer-leaf spreader beams were also connected to each other by pairs of diagonally crossing, 8-mm-diameter, 360-mm-long timber screws at 500-mm spacing (Fig. 8d). This intervention promoted engagement of the outer CL leaf in the lateral resistance of the building.
The roof diaphragm was not retrofitted from the beginning on purpose. A detailed study on the gable-roof subsystem dynamic behaviour (Tomassetti et al. 2019b) revealed that the displacement capacity of the timber roof is generally higher than the one associated with gable collapse. Therefore, only the masonry gables were initially retrofitted with timber posts for out-of-plane capacity, to investigate the response of the gable-roof system without the influence of a stiffened diaphragm. Loose diagonal steel cables, connecting the ridge beam to the second-floor joists, limited relative displacements to ± 200 mm. They were eventually tied during the latest test runs, when roof displacements became dangerously large, thus stiffening the inclined roof diaphragms in order to continue with the tests. Studying the response of the gable-roof system in two different retrofit conditions allowed the identification of a floor acceleration threshold that required roof stiffening.

Second-floor diaphragm retrofit details: a OSB panels layout, b joists and blocking beams layout, c installation of OSB panels, d view from below of the connection between inner- and outer-leaf spreader beams
The longitudinal wall posts were anchored to the concrete foundation and to the first-floor diaphragm by steel tie-downs, to enhance the pier flexural resistance by providing tensile strength. One 340 × 182-mm, with cross-section of 40 × 2-mm-thick angle was fastened to each post by twelve 5-mm-diameter, 70-mm-long screws and to the concrete elements by class 8.8 M12 threaded bars bearing against the top or bottom sill plates (Figs. 6a, b, 9a, b). These bars developed into the foundation for 70 mm, bonded by an epoxy adhesive, while passed through the RC slab and connected together the first- and second-storey frames. In real applications, these connections can be installed independently above and below a given floor, as with the foundation. However, the dense reinforcement of the slab hampered the insertion of epoxy-bonded threaded bars. For this reason, holes were core-drilled through the slab, and passing bars were prestressed against the first-storey top and second-storey bottom sill plates. The applied prestressing force was capacity-designed to prevent decompression at the interface between the sill plates and the slab, avoiding direct bending moment transfer between piers of different storeys.
The transverse North and South wall posts, instead, were fastened only to the top and bottom sill plates by pairs 70 × 70-mm steel angles with cross-section of 55 × 2-mm, fastened to each timber element by five 5-mm-diameter, 70-mm-long screws per element. The sill plates along the transverse walls were in turn anchored to the concrete foundation and RC slab by class 8.8, M12 threaded bars, with similar details as specified for the tie-down connections (Figs. 6d, 9c, d).

Retrofit system-to-floor connection details: a, b first-storey longitudinal-wall posts to RC slab, c, d transverse-wall sill plates to first-floor RC slab, e, f second-storey longitudinal-wall frame to inner-leaf spreader beam, g, h second-storey transverse-wall sill plate to blocking beams of timber diaphragm
At the second-storey, top steel tie-downs could not be properly anchored to the timber diaphragm. For this reason, the second-storey longitudinal piers were assumed to behave as cantilevers, fixed at their bottom but not at their top. The longitudinal East and West posts were connected to the top sill plates by pairs of steel brackets, with similar details as used for the transverse wall posts; the sill plates were in turn fastened to the second-floor spreader beams with 6-mm-diameter, 110-mm-long screws at 100-mm spacing (Fig. 9e, f). Along the transverse walls, the second-storey top sill plate and the gable bottom sill plate were connected to the timber diaphragm by 8-mm-diameter, 360-mm-long timber screws at 300-mm spacing; timber blocking beams were added between joists to accommodate these fasteners (Fig. 9g, h). Gable posts were instead connected directly to the roof timber joists by 86 × 86-mm, 135°-bent steel angles, with cross-section of 40 × 3 mm, with six 5-mm-diameter, 70-mm-long screws per member.
Member sizes were chosen to reach a good compromise between structural efficiency and internal space saving. Connecting the timber frames to the masonry walls and to the floor diaphragms resulted also in improved wall-to-diaphragm connections, promoting a global box-type response. A detailed discussion on the design principles and analytical equations will be provided in a following paper focusing on the retrofit system mechanics.
The installation time and material cost of the masonry retrofit were estimated as 2.5 man-hours and €78, respectively, per square meter of wall surface, considering the net CS masonry area and market prices for Northern Italy. These values do not include the connection improvement between inner and outer leaves, which was obtained by building the specimen with an increased amount of steel ties. Similarly, the required time and material cost for the timber diaphragm retrofit were estimated as 0.6 man-hours and €17, respectively, per square meter of floor surface, excluding hole areas.
2.4 Masses
The average densities of CS and CL masonries were 1836 kg/m3 and 1967 kg/m3, respectively, for the bare specimen and 1862 kg/m3 and 2072 kg/m3 for the retrofitted one. Timber frame elements and OSB panels had densities of 517 kg/m3 and 572 kg/m3 respectively. The total mass of the bare building was 47.6 t, while the mass of the bare structure of the retrofitted specimen was 48.6 t. These values include a 1.2-t additional mass on the second-floor timber diaphragm, consisting of forty-eight 25-kg mortar bags to simulate the contributions of non-structural components and live loads. The retrofit system total mass was approximately 1.6 t, corresponding to 3% of the bare structure mass. This resulted in a 50.2-t mass for the strengthened specimen. Table 1 summarizes all mass contributions of the bare and retrofitted specimens.
2.5 Material mechanical properties
Characterization tests were performed at the Department of Civil Engineering and Architecture (DICAr) laboratory of the University of Pavia, Italy, to determine the mechanical properties of bricks, mortar and masonry (Miglietta et al. 2019).
Bending and compression tests were conducted on bricks and mortar samples according to EN 772-1 (CEN 2015) and EN 1015-11 (CEN 1999), to determine brick compressive (fb) and tensile (fbt) strengths, as well as mortar compressive (fc) and tensile (ft) strengths. Six masonry wallettes made of CS bricks and six made of CL bricks were tested in compression perpendicularly to the horizontal bed-joints, according to EN 1052-1 (CEN 1998); these tests allowed the determination of the masonry compressive strength (fm) and the masonry secant elastic modulus at 33% of its compressive strength (Em). Bond wrench tests on CS and CL masonry samples were performed in order to determine the bond strength of masonry (fw), according to EN 1052-5 (CEN 2005). Specimens of both types of masonry were subjected to direct shear tests for the determination of cohesion or initial shear strength (fv0) and friction coefficient (µ), according to the guidelines given by EN 1052-3 (CEN 2002).
All characterization tests for masonry materials were performed at, or after, 28 days of maturation. Table 2 compares these values with the results obtained from in-situ testing on buildings in the Groningen, The Netherlands (Tondelli et al. 2015). It is worth noting that in-situ tests were conducted on different buildings; therefore, reported values of coefficient of variation (C.o.V.) are affected by both intra- and inter-building variability. Instead, the C.o.V. for the bare and retrofitted specimens include only intra-building variability.
The tensile ultimate capacity of the steel ties was determined as approximately 4.1 kN by TU Delft researchers (Esposito et al. 2016; Messali et al. 2016). Their pull-out and push-in behaviour has been extensively analyzed by Arslan et al. (2020).
Concrete belonging to class C28/35 according to EN 206 (CEN 2016a) and reinforcing steel with characteristic yield stress of 450 MPa formed the reinforced concrete first-floor slab and lintels. Glulam timber beams of class GL24h (CEN 2013) and solid red fir planks were used to build the second-floor and roof structures.
The timber frames used for the retrofit consisted of red solid fir (Picea-abies), belonging to class S10/C24 according to EN 14081-1 (CEN 2016b). They had characteristic compressive strength parallel to the fibers fc,0 = 21 MPa, characteristic tensile strength parallel to the fibers ft,0 = 14 MPa, and characteristic Young modulus E0.05 = 7400 MPa. Oriented-strand boards belonged to class OSB/3 according to EN 300 (CEN 2006). Only densities were determined at the DICAr laboratory.
Tie-down connections between timber posts and RC foundation or slab had characteristic tensile strength of 11.6 kN (Rothoblaas 2015). The epoxy adhesive characteristic tensile and shear strengths were respectively 41 kN and 20 kN when applied to 10-mm-diameter rods, 59 kN and 30 kN when applied to 12-mm-diameter rods. These values refer to embedment in uncracked concrete (Hilti 2019).
3 Testing protocols and instrumentation
3.1 Instrumentation
Several accelerometers and displacement transducers, installed inside and outside the buildings, monitored their responses. 46 accelerometers, with ranges of ± 2 g or ± 6 g, allowed measuring the total acceleration of the shake-table, masonry walls, first- and second-floor diaphragms, roof ridges, and rigid steel frame.
A set of 15 wire potentiometers recorded out-of-plane displacements of the North and South façades (CS and CL leaves) with respect to the rigid frame while 5 wire potentiometers monitored in-plane deformations of the first-storey CS squat wall of the East façade. 4 wire potentiometers were added to monitor in-plane deformations of the second-storey CS squat wall of the West façade of the retrofitted building.
44 linear potentiometers were installed on both specimens to monitor floor displacements with respect to the rigid frame, and to record relative motion between structural elements. 30 linear potentiometers were added in the retrofitted building to record relative displacements of the strengthening system.
Moreover, a 3D optical motion acquisition system was employed: passive reflective markers were attached to the external surface of the North, South and West clay walls, while 16 high-definition cameras recorded their trajectories.
All recorded data are available for free and can be downloaded upon request at http://www.eucentre.it/nam-project. A detailed description of the sensor layout and of the data organization can be found in Miglietta et al. (2019).
3.2 Testing protocols
The specimens were subjected to incremental dynamic test sequences, by applying to their bases an input acceleration history that was increasingly scaled in amplitude up to near-collapse conditions of the buildings. In fact, the aim of the tests was to assess damage evolution, failure mode development, and ultimate capacity of the bare and retrofitted buildings.
A single-component earthquake signal, termed EQ-NPR, was used for both specimens to facilitate comparing their experimental performances. This ground-motion record was selected upon compatibility with the uniform hazard spectrum (UHS) with 2475-years return period, for the area of Ten Boer, The Netherlands (Brunesi et al. 2019). The selected record was characterized by a short significant duration Ds,5−75 = 1.37 s (Bommer and Martinez-Pereira 1999; Kempton and Stewart 2006) and a peak ground acceleration PGA = 0.30 g (Fig. 10).
Tables 3 and 4 show the sequences of main earthquake simulations applied to the bare and retrofitted buildings, respectively, with nominal amplitude scale factors and some significant intensity measures: recorded peak ground acceleration, PGA; recorded peak ground velocity, PGV; pseudo-spectral accelerations, PSA, and spectral displacements, SD, for 5% viscous dam** ratio at the fundamental period in undamaged (T1,und) and damaged (T1,i) state. The fundamental period T1,i was evaluated through dynamic identification procedures immediately before the ith main test. The PGA recorded for the bare building at 33% and 50% scale factors appear to be the same due to a shake-table overshoot for periods shorter than 0.3 s (Miglietta et al. 2019).

Input record EQ-NPR scaled at 100%: a acceleration time-series, b, c elastic pseudo-acceleration and displacement response spectra for 5% viscous dam** ratio
Moreover, these tables list additional intensity measures correlated to the structural response in several seismic risk studies: geometric mean of the pseudo-acceleration spectral ordinates, PSA,avg (Bianchini et al. 2009), in the period window from T1,und (undamaged structure) to T1,dam (at the end of the test run); the cumulative absolute velocity, CAV (EPRI 1988); the Arias intensity, IA (Arias 1970); and the Housner intensity in its classical form, HI (Housner 1952), and modified definition for short-period URM structures, mHI (Magenes et al. 2014).
Between the main test runs listed in Tables 3 and 4, low-amplitude random excitations covering a wide frequency band (0.1–40 Hz) with consistent energy content were performed for dynamic identification purposes. Moreover, low-intensity applications of the EQ-NPR signal were necessary between the main jolts, to calibrate the shake-table controller with the updated dynamic properties of the specimens.
4 Test results
4.1 General overview
At the end of each increment of the shake-table test sequence, the buildings were surveyed in detail and the crack patterns were accurately mapped to monitor the structural damage evolution. As emerged from these surveys, the two prototypes responded differently to the same base excitation, develo** two distinct failure modes.
The bare building suffered a concentration of displacement demand and consequent damage at the second storey. In fact, the response of this prototype was mainly governed by a local mechanism: the second-floor timber diaphragm slid above the second-storey masonry piers, pushing the transverse walls out of their planes. Only minor structural damage was observed at the first storey at the end of the testing sequence.
On the other hand, the retrofitted building exhibited a global box-type behaviour during the entire testing sequence, with improved in-plane and out-of-plane capacities of the masonry piers. Enhanced connections between masonry piers and timber floor granted a top-to-bottom continuous flow of inertia forces and inhibited the onset of local sliding mechanisms. The final damage was mainly concentrated at the first storey, involving also the transverse walls because asymmetric stiffness distribution induced torsional response.
The following paragraphs discuss the observed damage pattern evolutions and the identification of the specimens damage states (DS) and damage limits (DL) throughout the incremental dynamic tests. A qualitative description of five damage states was chosen in accordance with the EMS-98 macro-seismic intensity scale (Grünthal 1998): DS1, no structural damage or slight non-structural damage; DS2, minor structural damage or moderate non-structural damage; DS3, moderate structural damage or heavy non-structural damage; DS4, heavy structural damage or very heavy non-structural damage; and DS5, very heavy structural damage with partial or total collapse.
Four damage limits were consequently defined as thresholds between damage states: DL1, the limit condition at which no structural damage was visible; DL2, the limit condition when only minor structural damage was detected; DL3, the limit condition when only moderate structural damage was reported; DL4, the limit condition when heavy structural damage was detected, before entering the near-collapse field. In other words, DL(i) constitutes the threshold between DS(i) and DS(i + 1). For the identification of DL4, a statically unstable recorded dynamic response was considered equivalent to near-collapse damage conditions.
Each DL was then associated with a run of the testing sequence: specifically, DL(i) was associated with the last test that caused an overall building damage state of DS(i). Finally, an engineering demand parameter value was assigned to each DL. To this end, the maximum global drift-ratio (\(\tilde{\theta }\)) recorded during the corresponding test increment was selected, defined as the maximum average second-floor displacement divided by the second-floor height above the foundation (5.4 m).
All processed data and videos of the tests are freely available and can be downloaded upon request at http://www.eucentre.it/nam-project.
4.2 Bare specimen damage evolution
Figure 11 illustrates the unretrofitted building damage evolution, relative to the CS inner leaf viewed from inside. Red marks identify cracks formed during the considered test run, while the black ones correspond to cracks that were already present. The figure shows only the runs when damage limits DL1 through DL4 were achieved.

Bare masonry building damage pattern evolution on the load-bearing CS inner leaves, viewed from inside. New cracks in red, existing cracks in black. Dots indicate cracks perpendicular to the wall surfaces
The first hairline cracks were observed after test runs EQ-NPR-20% (PGA = 0.06 g) and EQ-NPR-33% (PGA = 0.16 g). They were located at the interfaces between timber joists or spreader beams and masonry walls. The ones visible on the East and West façades anticipated sliding between the timber diaphragm and the second-storey piers. However, these sliding cracks had not fully developed above all longitudinal piers, and the local mechanism was deemed not yet activated. For these reasons, the building was considered in DS1 up to run EQ-NPR-33% (PGA = 0.16 g), when damage limit DL1 was reached and associated with global drift ratio \({\tilde{\theta }}_{DL1}\) = 0.037%. During the following run EQ-NPR-50% (PGA = 0.16 g) existing cracks extended moderately and a few new ones developed at the top and base of slender piers, denoting the onset of in-plane flexural-rocking responses. From this stage on, structural damage was considered of DS2 type.
During test run EQ-NPR-66% (PGA = 0.25 g), interface cracks extended completely between the second-storey longitudinal piers and the timber diaphragm, the local sliding mechanism of the second-floor diaphragm activated, and damage started concentrating at the upper storey. A full-length horizontal crack formed on the transverse South wall at the second-floor, due to relative displacement and pounding between the masonry wall and the timber diaphragm. This interaction accentuated the out-of-plane response of the transverse walls, which involved the corner piers of the longitudinal walls at the second storey: on the East side, both corner slender piers behaved as a return walls for the North and South ones (flange effect); similarly, on the West side, the South slender pier was interested by this flange effect, with a stair-stepped crack at its base, while the stiffer and stronger North squat pier started detaching from the North wall at the top. The central slender pier of the East wall showed signs of flexural-rocking behaviour. Only a few localized cracks could be observed on the first-storey longitudinal walls, while no damage was detected on the transverse ones. In all cases, residual crack widths were less than 1 mm, and no structural element had been compromised yet. Therefore, the specimen was still classified in DS2 state, and damage limit DL2 was associated with this testing stage. The corresponding maximum global drift ratio was \({\tilde{\theta }}_{DL2}\) = 0.14%.
The subsequent test EQ-NPR-85% (PGA = 0.26 g) brought the specimen to a condition of widespread damage of DS3 type. The second-storey crack pattern of the longitudinal East and West walls evolved slightly, with all central and corner slender piers cracked at their top and bottom due to rocking and flange effect, respectively. Similar patterns were now visible also on the first-storey longitudinal walls. Focusing on the longitudinal squat piers, the second-storey one of the West side tended to rock and slide while detaching from the North transverse wall; instead, the first-storey squat pier of the East side showed evidences of rocking but no damage at the interface with the South transverse wall. Several new cracks formed on the transverse walls at the second storey, due to out-of-plane flexural response amplified by pounding of the second-floor timber diaphragm. Each transverse wall developed a horizontal crack at about one third of the second-storey height, which extended diagonally towards the corners. Instead, no damage accumulated at the first-storey on the North and South walls. Residual crack widths after the test were still less than 1 mm, but they spread throughout the building. Only this run was assigned to DS3, thus damage limit DL3 was associated with it and with the corresponding maximum global drift ratio \({\tilde{\theta }}_{DL3}\) = 0.47%.
The application of EQ-NPR-100% (PGA = 0.31 g) caused the formation of several new cracks and the accumulation of significant residual displacements of the order of centimeters, classified as DS4. As damage became extensive, the following test runs were performed reversing the ground motion polarity (Table 3), with the hope to allow conducting more tests before reaching a near-collapse state. Moreover, some accelerometers were removed from the clay outer-leaf as a safety measure (Miglietta et al. 2019).
The last two runs, EQ-NPR-100%-rev (PGA = 0.30 g) and EQ-NPR-133%-rev (PGA = 0.39 g), caused severe damage up to near-collapse conditions. Processed experimental data revealed that static stability of the building was lost during the final run: in fact, as the displacement was increasing in the negative direction, the base shear became positive. For this reason, the incremental dynamic test was terminated and the specimen was considered in DS5 state during EQ-NPR-133%-rev. Indeed, collapse was likely prevented by acceleration sign inversions of the table dynamic input. Accordingly, damage limit DL4 was associated with the maximum global drift ratio recorded during EQ-NPR-100%-rev, \({\tilde{\theta }}_{DL4}\) = 1.4%, before losing static stability.
The final conditions of the specimen are depicted in Fig. 12, where extensive damage can be observed: several masonry elements were cracked at multiple locations, in particular at the second storey. The survey detected significant extension of existing cracks, loss of some portions of masonry, and large residual crack widths or out-of-plane dislocations up to 50 mm. The damage pattern of the clay outer leaf followed very closely the one described for the CS inner leaf, demonstrating that even the adopted low density of steel ties was sufficient to couple the response of both leaves under the sustained level of acceleration demand. At the end of the incremental dynamic test, less damage was detected at the first storey compared to the second one, because the local mechanism of the second-floor timber structure sliding above the masonry piers dominated the response. The window timber frames installed on the North gable and on the West façade at the first storey did not show any significant damage: all shutters were properly opening at the end of the test sequence.

Bare masonry building final conditions: a, b second-storey North-West corner of the CS leaf, c, d second-storey North-East corner of the CS leaf, e brick dislocation on the North CS wall, f second-storey South-East corner of the CS leaf
4.3 Retrofitted specimen damage evolution
Figure 13 illustrates the crack pattern evolution on the CS inner leaves of the retrofitted building detected from inside, limited to the runs when damage limits DL1 through DL4 were reached.
The surveys after test runs EQ-NPR-20% (PGA = 0.06 g) and EQ-NPR-33% (PGA = 0.10 g) did not reveal any damage to the building. A few localized hairline cracks at the interfaces between timber joists and load-bearing transverse walls formed during run EQ-NPR-50% (PGA = 0.17 g). The following test EQ-NPR-66% (PGA = 0.19 g) caused only a moderate extension of the same interface cracks and no residual displacements were detected. Up to this run, the building was assigned to DS1 and damage limit DL1 was associated with it, resulting in maximum global drift ratio \({\tilde{\theta }}_{DL1}\) = 0.05%.

Retrofitted building damage pattern evolution on the load-bearing CS inner leaves, viewed from inside. New cracks in red, existing cracks in black. Dots indicate cracks perpendicular to the wall surfaces
The following runs EQ-NPR-85% (PGA = 0.25 g) and EQ-NPR-100% (PGA = 0.30 g) resulted in visible damage spreading only within the gable-roof subsystem, with DS2 classification of the overall specimen conditions. The building responded globally to the ground motion, but the higher flexibility of the gable-roof subsystem, characteristic of this building typology, became evident (Graziotti et al. 2017; Tomassetti et al. 2019b). At this stage of the test, residual crack widths were less than 1 mm in the gables, while the first- and second-storey walls were still undamaged. During run EQ-NPR-100% (PGA = 0.30 g) the building was deemed to have reached damage limit DL2, with corresponding maximum global drift ratio \({\tilde{\theta }}_{DL2}\) = 0.13%. Up to this level of shaking the roof diaphragm did not require any stiffening interventions.
After test EQ-NPR-133% (PGA = 0.41 g), propagation of existing cracks in the gable-roof subsystem and formation of new ones in other structural elements were observed, leading to a DS3 damage condition. Minor cracks appeared at the edges of longitudinal CS piers, covered by the timber retrofit, probably due to in-plane flexural response: they were not localized only at the pier top and bottom, but spread away from the ends due to the reinforcing effect of the timber posts. Two similar, long cracks were detected on both transverse walls at the first storey. They started as horizontal cracks at one edge of the wall, then continued following a stair-stepped path. These cracks were associated with the in-plane shear response of the transverse walls, triggered by the overall building torsional response: in fact, the two longitudinal walls offered very different stiffness and strength. This run was also associated with the attainment of damage limit DL3, with maximum global drift ratio \({\tilde{\theta }}_{DL3}\) = 0.3%.
At this stage of the incremental dynamic tests, due to extensive damage accumulated by the gables and large relative displacements between roof and second floor, the roof was stiffened by tightening the diagonal steel cables connecting the ridge-beam to the second-floor joists. A second-floor peak acceleration of 0.53 g was reached before retrofitting the roof diaphragm.
The test with the signal scaled at 133% of its amplitude was then repeated with the restrained roof (EQ-NPR-133%-roof, PGA = 0.43 g). The response of the building emphasized the first-storey damage due to torsional effects. The cracks propagated throughout the whole first-storey transverse walls, from edge to edge. The building could not be classified as moderately damaged anymore and, starting from this run, was associated with DS4 damage state. At this stage, the building had activated all its resisting mechanisms. Under further scaling of the ground motion for test runs EQ-NPR-166%-roof (PGA = 0.51 g) and EQ-NPR-200%-roof (PGA = 0.66 g) the first-storey damage due to torsional effects worsened, while only a few additional hairline cracks appeared at the second storey. The last run, EQ-NPR-266%-roof (PGA = 0.78 g) caused such severe damage that the specimen was deemed near partial collapse. Consequently, damage limit DL4 was associated with this run and its maximum global drift ratio \({\tilde{\theta }}_{DL4}\) = 1.6%.
At the end of the incremental dynamic test the building prototype was heavily damaged, especially at the first storey (Fig. 14). Many cracks were detected at the edges of the first-storey piers, covered by the timber retrofit, of the East and West inner leaves. The North and South transverse walls were severely damaged at the first storey and accumulated residual crack widths up to 35 mm (Fig. 14a–d), due to in-plane shear caused by the overall building torsional response. In particular, loss of masonry portions and significant residual dislocation of masonry units (up to 65 mm) were observed close to the East edge of the CS South wall, where it detached from the intersecting squat pier of the East wall (Fig. 14e–i): uplift due to rocking of the longitudinal squat pier likely caused incompatible vertical displacements along the intersection with the transverse wall. Moreover, the overall building rotation about the vertical axis may have caused dislocations along this crack. The second-storey transverse walls presented lower levels of damage: a few horizontal cracks developed on the North wall at several heights, while two diagonal cracks formed on the South one, close to its top West corner.
Similarly to the case of the bare building, damage on the clay veneer generally followed the one observed on the CS inner leaf, revealing that the increased amount of steel ties ensured a coupled response of the two leaves throughout the test. The outer leaf was found undamaged up to EQ-NPR-66% (PGA = 0.19 g), when the building was still in DS1 conditions. Cracks, due to in-plane rocking and flange effect, started develo** on the longitudinal East and West façades during EQ-NPR-85% (PGA = 0.25 g) and EQ-NPR-100% (PGA = 0.30 g), compatibly with DS2 damage state. At the end of the incremental dynamic test, all clay veneers presented widespread damage throughout their surfaces. Also the windows were affected by the large first-storey drift: the shutter of the West-side window fell during the last run, pushed off its pins by the shear deformation imposed to the timber frame, which however remained undamaged.
4.4 Hysteretic responses
This section discusses and compares the recorded experimental performances in terms of hysteretic responses, backbone curves, and cumulative energy dissipation. As already mentioned, the global drift-ratios (\(\tilde{\theta }\)) were obtained dividing the average second-floor displacements by the second-floor height above the foundation (5.40 m).

Retrofitted building final conditions: a first-storey North CS wall close to West corner, b brick dislocation on the North CS wall, c first-storey North CS wall close to East corner, d first-storey South CS wall close to the centre, e, f, g South-East corner of the building from outside, h, i South-East corner of the building from inside
The base shears of the hysteretic loops (Fig. 15) were computed multiplying the mass associated with each accelerometer times the recorded acceleration. The mass of the bottom half of the first storey was considered fixed to the shake-table: consequently, its contribution was neglected. The base-shear coefficients (BSC) were computed normalizing these base shears by the sum of the contributing masses of the corresponding building (40.6 t and 42.6 t for the bare and the retrofitted buildings, respectively). It is worth noting that the base-shear coefficient on Fig. 15 (left vertical axis) is exact for both specimens, while the base shear in units of force (right vertical axis) is exact only for the bare building. However, since both specimens had very similar masses, it is a good approximation also for the retrofitted one.
Figure 15a compares the two hysteretic responses during test EQ-NPR-133%-rev (PGA = 0.39 g, last run for the bare building) and EQ-NPR-133% (PGA = 0.41 g, retrofitted building). After these runs with nearly the same PGA, the specimens presented clearly different crack patterns (Figs. 11, 13): while the bare building was severely damaged, the retrofitted one showed the first evidences of the activation of a global torsional mechanism. Moreover, Fig. 15a shows evident strength degradation for the bare specimen, as its base shear became positive while the second-floor displacement was increasing in the negative direction: this proves that the building had lost static stability during this run, and collapse was likely prevented only by acceleration sign inversions of the table dynamic input. For this reason, damage state DS5 was associated with this test run for the bare specimen. Instead, the retrofitted building hysteretic loops evidence a response initially almost elastic, with minor excursions in the nonlinear range, slight stiffness degradation, and no strength degradation, compatible with a DS3 damage state. The retrofitted specimen developed a base-shear coefficient BSC = 0.41, significantly higher than BSC = 0.25 offered by the bare building, while it underwent a global drift ratio \(\tilde{\theta }\) = 0.3% in both directions, which is 15 of \(\tilde{\theta }\) = 2.0% reached by the bare building in the negative direction.
Figure 15b compares the experimental responses of the two specimens during the last test runs, EQ-NPR-133-rev (PGA = 0.39 g) for the bare building and EQ-NPR-266%-roof (PGA = 0.78 g) for the retrofitted one. The latter, as opposed to the former, maintained static stability throughout the testing sequence, with limited strength degradation and significant hysteretic energy dissipation, likely due to yielding of some steel connections. The retrofitted building sustained BSC = 0.55, more than twice the value of BSC = 0.25 resisted by the bare one, while it accommodated \(\tilde{\theta }\) = 1.6% in both directions, without reaching the value of \(\tilde{\theta }\) = 2.0% recorded on the bare building in the negative direction.

Hysteretic responses: a EQ-NPR signal scaled at 133% of its amplitude, b final test runs
Figure 16a shows the experimental backbone curves of the two buildings, highlighting the maximum global drift ratios associated with the damage limits mentioned in the previous sections. Since the specimens underwent higher displacements in the negative direction up to near-collapse conditions, the backbone curves were obtained by selecting for each run the point of maximum force with the corresponding displacement in that direction, from the hysteretic loops (hollow dots). The last point of the backbone curve is the one associated with maximum negative displacement from the hysteretic response during the last run (solid dots). The retrofit system did not influence the initial stiffness because of its high in-plane flexibility compared to the masonry walls. In light of this, it can be inferred that the retrofit system acts similarly to steel reinforcement in concrete or masonry elements: it becomes effective only after masonry first cracking. This fact, combined with the small additional mass of the intervention, allows maintaining the initial dynamic properties of the bare masonry building nearly unchanged.
One can observe from Fig. 16a that the bare building could sustain its maximum BSC = 0.25 only up to \(\tilde{\theta }\) = 0.57%; then it exhibited a fast strength degradation and finally lost static stability, as shown by the BSC sign inversion. The BSC of the bare specimen became zero around \(\tilde{\theta }\) = 1.5%, which is very close to \({\tilde{\theta }}_{DL4}\) = 1.4% (i.e., associated with damage limit DL4) recorded during the second-last test run. Moreover, between \(\tilde{\theta }\) = 0.28% and \(\tilde{\theta }\) = 0.57%, the curve shows a local strength drop which is subsequently recovered (dashed black curve on Fig. 16a). This apparent strength recovery was caused by reversing the input signal polarity after run EQ-NPR-100% (lowest point of the dashed line), to proceed with further testing in spite of extensive damage and residual displacements, as discussed earlier. Consequently, the solid black line represents the envelope of maximum recorded base shear for the bare building. Instead, the retrofit system allowed reaching a BSC ≈ 0.5 and maintaining it almost constant up to \(\tilde{\theta }\) = 1.43% with negligible strength degradation, which became more evident only for larger global drift ratios during the last run.
Finally, the cumulative energy dissipated by the two specimens is associated with the maximum negative drift ratio (solid dots) experienced during each run in Fig. 16b. The retrofitted building exhibited a higher energy dissipation capacity for given global drift ratio, and dissipated twice as much the energy of the bare building at the end of the entire sequence. The different amount of hysteretic dissipation is partially associated with the higher strength of the retrofitted building, combined with the substantially different damage mechanisms. It is interesting to notice that both specimens dissipated nearly the same amount of energy when reaching the same damage limits up to DL3.

Experimental responses: a backbone curves, b cumulative energy dissipation
5 Summary and discussion of the test results
Figures 17 and 18 summarize the experimental response evolution throughout the incremental dynamic tests in terms of peak displacements (δi,j,X) of both floors or roof i along both longitudinal walls j, peak interstorey drift ratios (θi,j,X) of both storeys i along both longitudinal walls j, peak average shear deformation (γR,X) of the roof pitches, peak interstorey drift ratios (θi,j,Y) of both storeys i along both transverse walls j, longitudinal acceleration amplification factors (AMPi) of both floors or roof ridge i, and fundamental period of the damaged structure (T1) at the end of each run.
Peak longitudinal displacements of the bare building (Fig. 17) became significantly larger at the second floor than at the first floor, from test EQ-NPR-85% through the end of the testing protocol, as damage conditions of DS3 and DS4 type developed; at the same time, the roof displacement relative to the second floor slightly reduced. During the last test run, the second floor and roof moved by more than 100 mm, while the first one did not exceed 20 mm. Moreover, focusing on the displacement of the second-floor East and West sides, one can note some differences up to test EQ-NPR-66%: due to plan irregularity, the flexible timber diaphragm was initially deforming in shear as the building responded in DS1 and DS2 states. However, onset of the local second-floor mechanism during run EQ-NPR-85% prevented this distortion, as the diaphragm slid as a rigid body above the masonry piers in damage states DS3 and DS4.
These observations can be confirmed by the peak longitudinal interstorey drift ratio evolution, which concentrated at the second storey in DS3 and DS4 states: during the last test run, the second storey sustained interstorey drift ratios higher than 4%, as opposed to the values of the order of 0.7% recorded at the first storey and 0.3% at the attic one. The development of the local second-floor sliding mechanism affected also the peak transverse interstorey drift ratios: in fact, despite remaining always below 0.3%, they increased on both transverse walls when the building responded in DS3 and especially DS4 damage states, most likely due to some rigid-body rotation of the whole timber diaphragm.
A substantially different behavior was observed for the retrofitted building, as confirmed by the recorded data (Fig. 18). The high flexibility of the gable-roof subsystem compared to the first and second storeys became evident, as the local second-floor mechanism was inhibited: its longitudinal displacement and shear deformation were almost one order of magnitude larger than those of the storey below when DL3 was achieved (test run EQ-NPR-133%), after which the diagonal steel cables were tied. The first- and second-storey longitudinal displacements remained very close to each other also under high-intensity input motions. This resulted in interstorey drift concentration at the first storey starting from run EQ-NPR-133%, corresponding to DS3 and DS4 conditions: at the end of the test, the first-storey had experienced a maximum interstorey drift ratio of the order of 2.8% against the one of 0.6% recorded at the second storey. The peak transverse interstorey drift ratios confirmed a relevant torsional response of the building: the transverse North wall sustained a maximum in-plane interstorey drift ratio of about 1.4%, which is comparable with the one sustained on the longitudinal direction.
The roof and second-floor acceleration amplification of the bare building (Fig. 17) progressively decreased to about 30% and 45% of the initial values, respectively: reaching the strength of the second-floor sliding interface limited the acceleration transmitted to the timber floor and roof. Instead, the first-floor amplification decreased only to 75% of the initial one, as the first-storey walls were far from reaching their strength. The retrofitted building (Fig. 18) displayed a different response also in terms of floor acceleration amplifications, which remained nearly constant up to DL2 (test run EQ-NPR-100%). The roof presented a sudden increment to 27% of the initial amplification when DL3 was reached (test run EQ-NPR-133%), requiring the activation of steel cables during subsequent runs. The amplifications of the first and second floors, instead, progressively reduced in DS3 and DS4 conditions, to 60% and 80% of the initial values at the first and second floors, respectively. These decrements, not very pronounced, indicate that the structure maintained some reserve of lateral resistance and ability to transfer accelerations to upper floors.

Evolution of the bare specimen response

Evolution of the retrofitted specimen response
Figures 17 and 18 also compare the fundamental period evolution for both buildings. Both specimens were characterized by an initial fundamental period of 0.17 s in pristine conditions, because the retrofit system has negligible incidence on the overall mass and initial stiffness. Incidentally, they presented the same fundamental period of 0.62 s also at the end of the test sequences. Both specimens suffered the highest period elongation once entered in DS4 damage state, but the retrofitted building sustained a higher number of test runs and twice the ground acceleration amplitude to reach the same elongation. This finding can be extended considering the different number of runs sustained by the two buildings and the PGA associated with each DL (Fig. 19): on average, the application of the retrofit system allowed increasing the PGA thresholds of each DL by factors of the order of 120–260%, with larger factors for higher DLs.

Relationship between experimental damage states and input PGA
Table 5 shows the maximum interstorey drift-ratios (IDRs) recorded during the runs corresponding to each DL and compares them with those proposed by Tomassetti et al. (2019a) for typical Dutch URM terraced houses. A good agreement was obtained in terms of IDRs associated to DL1. Focusing on DL2, the bare building IDR is significantly higher, specifically 180% of the proposed value, while the retrofitted building IDR is still consistent with the value proposed by Tomassetti et al. (2019a). The same trend is evidenced by the IDRs associated with DL3: the bare and retrofitted building values are respectively 260% and 130% of the proposed value. However, it is fundamental to consider that the values proposed by Tomassetti et al. (2019a) were derived from tests on bare masonry buildings responding globally, without the activation of any local mechanism. Instead, the high values recorded for the bare building are the result of the local sliding mechanism of the second floor, which governed the overall seismic response of the building starting from DS2 (see Sect. 4.2); as such, in this case the second-storey drift ratio is not the most appropriate engineering demand parameter to be correlated with damage states of masonry walls.
Focusing on the interstorey drift ratios corresponding to DL4, both specimens sustained significantly larger values compared to the one proposed by Tomassetti et al. (2019a). While the one associated with the bare building cannot be compared, due to the local sliding mechanism of the second-floor diaphragm, the one recorded for the strengthened building proved that the proposed retrofit solution is effective at increasing the ultimate strength and displacement capacity. Moreover, one can notice that the retrofit system did not affect significantly the interstorey drift ratios associated with the first three DLs: in fact, the masonry walls are characterized by higher stiffness than the timber structure, which becomes effective only after masonry cracking.
The in-plane response of the first-storey transverse walls of the retrofitted building, engaged by global torsional response, can be compared to that of a squat CS pier subjected to a quasi-static cyclic shear-compression test by Graziotti et al. (2016). Similar double-fix boundary conditions and overburden normal stresses of about 0.3 MPa were applied to both the transverse walls and the squat pier.
Table 6 shows good agreement on the first-cracking interstorey drift ratio, θcr, recorded on both transverse walls during run EQ-NPR-133%, when overall DL3 was achieved. Graziotti et al. (2016) attained an ultimate drift ratio, θu, of 0.30%, which was reached by the South transverse wall during test run EQ-NPR-200%-roof. However, the North wall sustained 460% of this value during run EQ-NPR-266%-roof, when DL4 was attained. This larger displacement capacity was likely due to the lower number of cycles imposed on the building specimen, compared to the isolated pier, as well as some effect of the out-of-plane retrofit system, despite the absence of nogging elements and OSB panels on the transverse walls.
6 Conclusions
This paper discussed and compared the experimental seismic performance of two full-scale unreinforced masonry buildings with identical geometrical features, demonstrating the effectiveness of an innovative timber-based retrofit system applied to one of them.
The building prototypes reproduced some relevant features of an end unit of common Dutch terraced houses of the late ‘70s–early ‘80s, with perimeter cavity walls consisting of inner load-bearing calcium-silicate leaf and exterior clay veneer, connected by steel ties. The first floor consisted of a solid reinforced concrete slab, while the second floor and the roof were built as timber joist-and-plank structures. Both specimens were subjected to a unidirectional, incremental dynamic shake-table test with similar input protocols. A ground-motion record, representative of induced seismicity in the Groningen region of The Netherlands, was imposed progressively scaling its acceleration amplitude and bringing the specimens to near-collapse conditions.
A sustainable, light-weight, reversible and cost-effective timber retrofit system was applied to the internal surface of the inner load-bearing masonry leaf of the second specimen to enhance out-of-plane and in-plane capacities of piers as well as wall-to-diaphragm connections. The proposed strengthening solution consists of timber frames mechanically connected to the masonry and floor systems, with oriented-strand boards nailed to them. The cavity-wall retrofit was completed by increasing the density of steel ties between the two masonry leaves. Moreover, the timber diaphragm was stiffened and strengthened by nailing an additional layer of oriented-strand boards above the existing planks.
The bare building behaviour was governed by a local mechanism, with the second-floor timber diaphragm sliding upon the supporting masonry piers, facilitated by lack of wall-to-diaphragm connections. Displacement demand and structural damage concentrated at the second storey, preventing the development of a global building response. Despite the highly asymmetrical in-plan distribution of resisting piers, a global torsional response did not develop due to the activation of the local sliding mechanism. The incremental dynamic test was stopped after reaching a peak ground acceleration of 0.39 g, with the building in near-collapse conditions. Loss of static equilibrium was observed on the hysteretic response during the last test run, but collapse was inhibited by the dynamic nature of the base excitation.
The retrofit was effective at enhancing the walls in-plane and out-of-plane capacities, improving also the connections between structural elements, and thus inducing a global box-type behaviour on the second building, with full exploitation of the in-plane capacities of all masonry piers. Damage recorded on the perpendicular walls proved the triggering of a torsional response, which resulted in full utilization of the in-plane resistances of the transverse walls as well. The building reached its near-collapse state after sustaining a peak ground acceleration of 0.78 g. At the end of the incremental dynamic test, damage was fairly distributed throughout the building, even though it was more pronounced at the first storey. The roof diaphragm needed to be stiffened only after reaching a peak attic floor acceleration of 0.53 g when applying the input motion with a 133% scale factor.
Despite changing the failure mechanism and the overall lateral resistance of the building, the retrofit application did not affect the initial fundamental period of 0.17 s, thanks to its small mass and stiffness compared to those of the masonry structure. Both damaged specimens exhibited also the same period of 0.62 s at the end of the testing sequence, even though the retrofitted building sustained a larger number of test runs and twice the input intensity.
Damage states and damage limits were defined for both specimens based on the observed damage patterns, and were associated with global and interstorey drift ratios. These values were then compared with the ones found in literature for similar unreinforced masonry structures. The near-collapse thresholds were found to be greater than expected for both specimens. In fact, both bare and retrofitted buildings were able to sustain similar lateral displacements, but the latter resisted twice the input intensity when undergoing the same displacement demand, developed a global response rather than a local sliding mechanism, and retained static stability throughout the test.
In light of these observations, the proposed retrofit solution effectively addresses and mitigates the main seismic deficiencies of unreinforced cavity-wall masonry buildings, typical of the Groningen region. Given the limited cost of the proposed interventions, they appear promising for a large-scale territorial application.
The results of this experimental campaign will form the basis for future numerical studies, to generate large-scale vulnerability models, to extend the proposed retrofit technique to other unreinforced masonry building typologies, and to perform cost/benefit and sustainability analyses of possible applications. An upcoming article will address the design concept and assumptions of the proposed retrofit system, as well as simplified equations for the analytical prediction of its structural effects.
All processed data and videos are freely available upon request at http://www.eucentre.it/nam-project.
References
American Wood Council (AWC) (2008) ANSI/AF&PA SDPWS-2008: special design provisions for wind and seismic. Washington, DC, USA
Arias A (1970) A measure of earthquake intensity. In: Hansen RJ (ed) Seismic design of nuclear power plants, 1st edn. MIT Press, Cambridge, pp 438–483
Arslan O, Messali F, Smyrou E, Bal İE, Rots JG (2020) Experimental characterization of the axial behavior of traditional masonry wall metal tie connections in cavity walls. Constr Build Mater. https://doi.org/10.1016/j.conbuildmat.2020.121141
Arup (2020) Exposure Database V7 Data Documentation, Arup report 229746_031.0_REP2015, ARUP, Amsterdam, The Netherlands. https://nam-onderzoeksrapporten.data-app.nl/reports/download/groningen/en/b0b54c89-45d5-4765-8843-6c79903a0ef8
Bianchini M, Diotallevi P, Baker JW (2009) Prediction of inelastic structural response using an average of spectral accelerations. In: Proceedings of the 10th international conference on structural safety and reliability (ICOSSAR09), Osaka, Japan
Bommer JJ, Martinez-Pereira A (1999) The effective duration of earthquake strong motion. J Earthq Eng 3(2):127–172. https://doi.org/10.1080/13632469909350343
Bommer JJ, Dost B, Edwards B, Stafford PJ, van Elk J, Doornhof D, Ntinalexis M (2016) Develo** an application-specific ground‐motion model for induced seismicity. Bull Seismol Soc Am 106(1):158–173. https://doi.org/10.1785/0120150184
Bourne SJ, Oates SJ, Bommer JJ, Dost B, Van Elk J, Doornhof D (2015) A Monte Carlo method for probabilistic hazard assessment of induced seismicity due to conventional natural gas production. Bull Seismol Soc Am 105(3):1721–1738. https://doi.org/10.1785/0120140302
Brunesi E, Peloso S, Pinho R, Nascimbene R (2019) Shake-table testing of a full-scale two-story precast wall-slab-wall structure. Earthq spectra 35(4):1583–1609. https://doi.org/10.1193/072518EQS184M
Cassol D, Giongo I, Ingham J, Dizhur D (2021) Seismic out-of-plane retrofit of URM walls using timber strong-backs. Constr Build Mater 269:121237. https://doi.org/10.1016/j.conbuildmat.2020.121237
Crowley H, Polidoro B, Pinho R, van Elk J (2017) Framework for develo** fragility and consequence models for local personal risk. Earthq Spectra 33(4):1325–1345. https://doi.org/10.1193/083116EQS140M
Crowley H, Pinho R, van Elk J, Uilenreef J (2019) Probabilistic damage assessment of buildings due to induced seismicity. Bull Earthq Eng 17(8):4495–4516. https://doi.org/10.1007/s10518-018-0462-1
Damiani N, Miglietta M, Mazzella L, Grottoli L, Guerrini G, Graziotti F (2019) Full-scale shaking table test on a Dutch URM cavity-wall terraced-house end unit—a retrofit solution with strong-backs and OSB boards—EUC-BUILD-7. EUCENTRE foundation, Pavia, ITA, Research report EUC052/2019U. www.eucentre.it/nam-project. Accessed 24 July 2020
Dizhur D, Giaretton M, Giongo I, Ingham JM (2017) Seismic retrofit of masonry walls using timber strong-backs. SESOC J 30(2):30–44
Dost B, Goutbeek T, Van Elk T, Kraaijpoel D (2012) Monitoring induced seismicity in the North of the Netherlands: status report 2010. KNMI Scientific Report WR 2012–2013, Royal Netherlands Meteorological Institute, De Bilt, The Netherlands. http://bibliotheek.knmi.nl
Dost B, Kraaijpoel D (2013) The August 16, 2012 earthquake near Huizinge (Groningen). KNMI Technical Report, Royal Netherlands Meteorological Institute, De Bilt, The Netherlands. http://bibliotheek.knmi.nl
Electrical Power Research Institute (EPRI) (1988) A criterion for determining exceedance of the operating basis earthquake. EPRI Report NP-5930, Electrical Power Research Institute, Palo Alto, California, United States
Esposito R, Messali F, Rots JG (2016) Material characterization of replicated masonry and wall ties. In: Final report 18 April 2016. Delft University of Technology, Delft
Esposito R, Messali F, Ravenshorst GJP, Schipper HR, Rots JG (2019) Seismic assessment of a lab-tested two-storey unreinforced masonry Dutch terraced house. Bull Earthq Eng 17(8):4601–4623. https://doi.org/10.1007/s10518-019-00572-w
European Committee for Standardization (CEN) (1998) EN 1052-1: methods of test for masonry—part 1: determination of compressive strength. European Committee for Standardization, Brussels
European Committee for Standardization (CEN) (1999) EN 1015-11: methods of test for mortar for masonry—part 11: determination of flexural and compressive strength of hardened mortar. European Committee for Standardization, Brussels
European Committee for Standardization (CEN) (2002) EN 1052-3: methods of test for masonry—part 3: determination of initial shear strength. European Committee for Standardization, Brussels
European Committee for Standardization (CEN) (2005) EN 1052-5: methods of test for masonry—part 5: determination of bond strength by the bond wrench method. European Committee for Standardization, Brussels
European Committee for Standardization (CEN) (2006) EN 300: Oriented Strand Boards (OSB)—definitions, classification and specifications. Ankara, Turkey
European Committee for Standardization (CEN) (2013) EN 14080: timber structures—glued laminated timber and glued solid timber—requirements. European Committee for Standardization, Brussels
European Committee for Standardization (CEN) (2015) EN 772-1: methods of test for masonry units—part 1: determination of compressive strength. European Committee for Standardization, Brussels
European Committee for Standardization (CEN) (2016a) EN 206: calcestruzzo—specificazione, prestazione, produzione e conformità. European Committee for Standardization, Brussels
European Committee for Standardization (CEN) (2016b) EN 14081-1: timber structures. Strength graded structural timber with rectangular cross section. Part I: general requirements. Brussels, Belgium
Giaretton M, Dizhur D, Ingham JM (2016) Shaking table testing of as-built and retrofitted clay brick URM cavity-walls. Eng Struct 125:70–79. https://doi.org/10.1016/j.engstruct.2016.06.032
Graziotti F, Rossi A, Mandirola M, Penna A, Magenes G (2016) Experimental characterization of calcium-silicate brick masonry for seismic assessment. In: Brick and block masonry: trends, innovations and challenges—proceedings of the 16th international brick and block masonry conference, IBMAC, pp 1619–1628. https://doi.org/10.1201/b21889
Graziotti F, Tomassetti U, Kallioras S, Penna A, Magenes G (2017) Shaking table test on a full scale URM cavity wall building. Bull Earthq Eng 15:5329–5364. https://doi.org/10.1007/s10518-017-0185-8
Graziotti F, Penna A, Magenes G (2019a) A comprehensive in situ and laboratory testing programme supporting seismic risk analysis of URM buildings subjected to induced earthquakes. Bull Earthq Eng 17(8):4575–4599. https://doi.org/10.1007/s10518-018-0478-6
Graziotti F, Tomassetti U, Sharma S, Grottoli L, Magenes G (2019b) Experimental response of URM single leaf and cavity walls in out-of-plane two-way bending generated by seismic excitation. Constr Build Mater 195:650–670. https://doi.org/10.1016/j.conbuildmat.2018.10.076
Grünthal G, Levret A (1998) Cahiers du Centre Européen de Géodynamique et de Séismologie 15, Centre Européen de Géodynamique et de Séismologie, Luxembourg
Guerrini G, Senaldi I, Graziotti F, Magenes G, Beyer K, Penna A (2019) Shake-table test of a strengthened stone masonry building aggregate with flexible diaphragms. Int J Archit Herit 13(7):1078–1097. https://doi.org/10.1080/15583058.2019.1635661
Guerrini G, Damiani N, Miglietta M, Graziotti F (2020) Cyclic response of masonry piers retrofitted with timber frames and boards. Struct Build. https://doi.org/10.1680/jstbu.19.00134
Hilti (2020) Hilti technical datasheet: HIT-RE 500 V3 injection mortar. https://catalogo.hilti.it/sistemi-ancoraggio/138/index.html. Accessed 26 Feb 2021
Housner GW (1952) Intensity of ground motion during strong earthquakes. Caltech Technical Report, California Institute of Technology, Pasadena, California. http://authors.library.caltech.edu
Jafari S, Rots JG, Esposito R, Messali F (2017) Characterizing the material properties of Dutch unreinforced masonry. Procedia Eng 193:250–257. https://doi.org/10.1016/j.proeng.2017.06.211
Kallioras S, Graziotti F, Penna A (2019) Numerical assessment of the dynamic response of a URM terraced house exposed to induced seismicity. Bull Earthq Eng 17(3):1521–1552. https://doi.org/10.1007/s10518-018-0495-5
Kempton JJ, Stewart JP (2006) Prediction equations for significant duration of earthquake ground motions considering site and near-source effects. Earthq Spectra 22(4):985–1013. https://doi.org/10.1193/1.2358175
Magenes G, Penna A, Senaldi I, Rota M, Galasco A (2014) Shaking table test of a strengthened full-scale stone masonry building with flexible diaphragms. Int J Archit Herit 8(3):349–375. https://doi.org/10.1080/15583058.2013.826299
Malomo D, Pinho R, Penna A (2018) Using the applied element method for modelling calcium silicate brick masonry subjected to in-plane cyclic loading. Earthq Eng Struct Dyn 47(7):1610–1630. https://doi.org/10.1002/eqe.3032
Messali F, Esposito R, Maragna M (2016) Pull-out strength of wall ties. Technical Report, TU Delft, NL
Miglietta M, Mazzella L, Grottoli L, Guerrini G, Graziotti F (2019) Full-scale shaking table test on a Dutch URM cavity-wall terraced-house end unit—EUC-BUILD-6. EUCENTRE foundation, Pavia, ITA, Research report EUC160/2018U. www.eucentre.it/nam-project. Accessed 24 July 2020
Rothoblaas (2019) Wood connectors and timber plates. https://www.rothoblaas.com/catalogues-rothoblaas. Accessed 26 Feb 2021
Rots JG, Messali F, Esposito R, Mariani V, Jafari S (2017) Multi-scale approach towards Groningen masonry and induced seismicity. Key Eng Mater 747:653–661. https://doi.org/10.4028/www.scientific.net/KEM.747.653
Senaldi I, Magenes G, Penna A, Galasco A, Rota M (2014) The effect of stiffened floor and roof diaphragms on the experimental seismic response of a full-scale unreinforced stone masonry building. J Earthq Eng 18(3):407–443. https://doi.org/10.1080/13632469.2013.876946
Senaldi I, Guerrini G, Comini P, Graziotti F, Penna A, Beyer K, Magenes G (2020) Experimental seismic performance of a half-scale stone masonry building aggregate. Bull Earthq Eng 18(2):609–643. https://doi.org/10.1007/s10518-019-00631-2
Tomassetti U, Graziotti F, Penna A, Magenes G (2018) Modelling one-way out-of-plane response of single-leaf and cavity walls. Eng Struct 167:241–255. https://doi.org/10.1016/j.engstruct.2018.04.007
Tomassetti U, Correia AA, Candeias PX, Graziotti F, Costa AC (2019a) Two-way bending out-of-plane collapse of a full-scale URM building tested on a shake table. Bull Earthq Eng 17(4):2165–2198. https://doi.org/10.1007/s10518-018-0507-5
Tomassetti U, Correia AA, Graziotti F, Penna A (2019b) Seismic vulnerability of roof systems combining URM gable walls and timber diaphragms. Earthq Eng Struct Dyn 48(11):1297–1318. https://doi.org/10.1002/eqe.3187
Tondelli M, Graziotti F, Rossi A, Magenes G (2015) Characterization of masonry materials in the Groningen area by means of in situ and laboratory testing. Technical Report, EUCENTRE Foundation, Pavia, Italy. Available online at www.eucentre.it/nam-project
van Elk J, Bourne SJ, Oates SJ, Bommer JJ, Pinho R, Crowley H (2019) A probabilistic model to evaluate options for mitigating induced seismic risk. Earthq Spectra 35(2):537–564. https://doi.org/10.1193/050918EQS118M
Acknowledgements
This work is part of the EUCENTRE project “Study of the vulnerability of masonry buildings in Groningen”, within the research programme framework on hazard and risk of induced seismicity in the Groningen province, sponsored by the Nederlandse Aardolie Maatschappij BV (NAM). The data post-processing was also partially funded by the DPC-ReLUIS within the framework of the Work-Package-5 2019–2021: “Interventi di rapida esecuzione a basso impatto ed integrati”. The authors would like to thank the DICAr Laboratory of the University of Pavia and the EUCENTRE Laboratory, which performed the tests. The valuable advice of R. Pinho, G. Magenes and A. Penna was essential to the project and is gratefully acknowledged. Thanks also go to L. Grottoli for his essential contribution in data post-processing, J. Uilenreef, H. Crowley, F. Dacarro, A. Boneschi, L. Gandini, S. Girello, S. Kallioras, L. Mazzella, S. Peloso, and U. Tomassetti for the practical support.
Funding
Open access funding provided by Università degli Studi di Pavia within the CRUI-CARE Agreement.
Author information
Authors and Affiliations
Corresponding author
Additional information
Publisher’s note
Springer Nature remains neutral with regard to jurisdictional claims in published maps and institutional affiliations.
Rights and permissions
Open Access This article is licensed under a Creative Commons Attribution 4.0 International License, which permits use, sharing, adaptation, distribution and reproduction in any medium or format, as long as you give appropriate credit to the original author(s) and the source, provide a link to the Creative Commons licence, and indicate if changes were made. The images or other third party material in this article are included in the article's Creative Commons licence, unless indicated otherwise in a credit line to the material. If material is not included in the article's Creative Commons licence and your intended use is not permitted by statutory regulation or exceeds the permitted use, you will need to obtain permission directly from the copyright holder. To view a copy of this licence, visit http://creativecommons.org/licenses/by/4.0/.
About this article

Cite this article
Miglietta, M., Damiani, N., Guerrini, G. et al. Full‐scale shake‐table tests on two unreinforced masonry cavity‐wall buildings: effect of an innovative timber retrofit. Bull Earthquake Eng 19, 2561–2596 (2021). https://doi.org/10.1007/s10518-021-01057-5
Received:
Accepted:
Published:
Issue Date:
DOI: https://doi.org/10.1007/s10518-021-01057-5