
Abstract
Alternative polyadenylation (APA) plays a crucial role in cancer biology. Here, we used data from the 3′aQTL-atlas, GTEx, and the China Nan**g Lung Cancer GWAS database to explore the association between apaQTL/eQTL-SNPs and the risk of lung adenocarcinoma (LUAD). The variant T allele of rs277646 in NIT2 is associated with an increased risk of LUAD (OR = 1.12, P = 0.015), lower PDUI values, and higher NIT2 expression. The 3′RACE experiment showed multiple poly (A) sites in NIT2, with the rs277646-T allele causing preferential use of the proximal poly (A) site, resulting in a shorter 3′UTR transcript. This leads to the loss of the hsa-miR-650 binding site, thereby affecting LUAD malignant phenotypes by regulating the expression level of NIT2. Our findings may provide new insights into understanding and exploring APA events in LUAD carcinogenesis.
Introduction
Lung adenocarcinoma (LUAD) and lung squamous cell carcinoma (LUSC) have shown distinct incidence trends in recent decades1,2. In China, the incidence of LUSC showed a decreasing trend over time, while the incidence of LUAD showed a significantly increasing trend3. The correlation between LUAD and smoking is weaker than that of LUSC4, and it is more closely related to other non-smoking (cooking fumes, PM2.5, et al.) and genetic factors5,6. The evidence from the GWAS Catalog (https://www.ebi.ac.uk/gwas/) showed that the currently reported LUAD susceptibility regions are far more than that of LUSC, indicating that genetic factors may affect the susceptibility of LUAD in a large extent. Therefore, screening of genetically susceptible high-risk individuals and taking targeted preventive measures may be one of the strategies to reduce the morbidity and mortality of LUAD.
Genome-wide association studies (GWAS) have identified plenty of single nucleotide polymorphisms (SNPs) associated with LUAD7,8,9. However, most of the loci discovered by GWAS are located in noncoding regions, and elucidating the molecular mechanisms of which are difficult. Quantitative trait locus (QTL) map**, such as eQTL analysis, is one of the most common research strategies to assess the biological function of SNPs, and has been demonstrated as a powerful tool to clarify the relationship between SNPs and gene expression10. Although a few noncoding SNPs function as eQTLs, the function of most disease-related non-coding SNPs are not yet clear. Altogether, eQTL analysis can only provide clues to the correlation between SNPs and gene expression, and is not yet effective in revealing the mediating mechanisms on how different genotypes of SNPs regulate abnormal gene expression.
Polyadenylation is an important post-transcriptional regulatory mechanism, and with the rapid development of transcriptomic, it has been found that alternative polyadenylation (APA) is widespread in more than 70% of human genes11, which may produce mRNA isoforms with different lengths of 3′untranslated regions (3′UTR)12, hence enable mRNA isoforms to have different stability, cellular localization, and translational efficiency13. Recently, ** LUAD and the extent of their association through large-sample case-control studies.
In this study, to explore the association between apaQTL/eQTL-SNPs and the risk of LUAD, firstly, we obtained APA-related genes in LUAD that with significant correlation between APA events and corresponding gene expression. On this basis, we further screened APA-related LUAD genes that with consistently differential expression at both the mRNA level and its′ coding protein level by integrating transcriptomics and proteomics data. Then, the 3′aQTL-atlas database was used to screen candidate apaQTL-SNPs that were located on the above APA-related LUAD genes. Subsequently, we combined eQTL analysis and obtained SNPs with both eQTL and apaQTL functions. Then, we used genome-wide genetic analysis of large samples (China Nan**g Lung Cancer GWAS database: 8762 LUAD cases and 13,328 healthy controls) to explore the association between candidate apaQTL/eQTL-SNPs and LUAD risk. Finally, functional experiments were performed to illustrate the effects of the identified apaQTL/eQTL-SNP on the malignant phenotype of LUAD in vitro and in vivo, while the occurrence of APA events under different alleles of the identified apaQTL/eQTL-SNP was evaluated through 3′RACE technology.
Results
Identification of APA-related LUAD genes
A total of 518 APA-related genes in LUAD ( | Rs | > 0.3, PFDR < 0.05) were obtained. Among these, the PDUI values of 285 genes were positively correlated with the corresponding gene expression (Rs > 0.3, PFDR < 0.05), and the PDUI values of the other 233 genes were negatively correlated with the corresponding gene expression (Rs < -0.3, PFDR < 0.05).
We further analyzed the expression differences of the above 518 genes at mRNA level between 57 paired LUAD tumor tissues and adjacent non-tumor tissues using the TCGA database. The result showed that a total of 143 genes (mRNA level) were differentially expressed ( | FC | > 1.5, P < 0.05). Then, we validated those 143 genes between 49 paired LUAD tumor tissues and adjacent non-tumor tissues from the Chinese population, and 65 genes were validated as significantly differential expressed ( | FC | > 1.5, P < 0.05).
Based on these validated 65 genes at the mRNA level, we further evaluated whether they were differentially expressed at the level of their corresponding coding proteins.
The results showed that there were 32 proteins differentially expressed between the tumor tissues and adjacent non-tumor tissues from the same Chinese population and the expression directions of 32 proteins were consistent with the corresponding mRNAs.
Thus, the overlapped 32 APA-related LUAD genes with consistent differential expression both at the mRNA and its′ coding protein levels were used for further study.
Identification of apaQTL/eQTL-SNPs in APA-related LUAD genes
A total of 423 apaQTL-SNPs located in the above 32 gene regions (PFDR < 0.05) were obtained through a public 3′aQTL-atlas website, while 338 apaQTL-SNPs also showed eQTL functions and may influence expression levels of 9 APA-related LUAD genes (P < 0.05). Subsequently, 256 apaQTL/eQTL-SNPs were survived with MAF > 0.05 in CHB. Finally, 28 apaQTL/eQTL-SNPs were selected after LD filter (r2 < 0.8) (Fig. 1) and their detailed information was shown in Table 1.

apaQTL alternative polyadenylation quantitative trait loci, SNPs single nucleotide polymorphisms, LUAD lung adenocarcinoma, MAF minor allele frequency, CHB Chinese Han population in Bei**g, LD linkage disequilibrium.
The association between candidate apaQTL/eQTL-SNPs and LUAD risk
We further examined the association between 28 apaQTL/eQTL-SNPs and LUAD risk in the Chinese population using the China Nan**g Lung Cancer GWAS database. As shown in Table 2, the variant T allele of rs10452178 located in CISD2 was significantly associated with a decreased risk of LUAD (OR = 0.92, 95% CI = 0.87–0.98, P = 0.009). The variant T allele of rs277646 located in NIT2 was significantly associated with an increased risk of LUAD (OR = 1.12, 95% CI = 1.02–1.22, P = 0.015). Besides, the variant T allele of rs11714045 located in NIT2 showed a borderline significant association with an increased risk of LUAD (OR = 1.05, 95% CI = 1.00–1.10, P = 0.076).
The correlation between PDUI value and corresponding gene expression
To analyze the APA usage of CISD2 and NIT2 in LUAD, we combined PDUI data and gene expression data from TCGA. As shown in Fig. 2a–c, in adjacent non-tumor tissues (Rs = -0.540, P = 1.23 × 10⁻⁵), LUAD tumor tissues (Rs = -0.407, P = 9.50 × 10⁻²¹), and total tissues (Rs = -0.500, P = 1.28 × 10⁻³⁵), we all observed a negative correlation between the PDUI value and gene expression level of CISD2. As the PDUI value increased, the expression of CISD2 decreased. In addition, the PDUI value of NIT2 was also negatively correlated with NIT2 gene expression level in both adjacent non-tumor tissues (Rs = −0.371, P = 4.12 × 10⁻³), LUAD tumor tissues (Rs = −0.320, P = 5.60 × 10⁻¹³), and total tissues (Rs = -0.361, P = 3.82 × 10⁻¹⁸) (Fig. 2d–f).
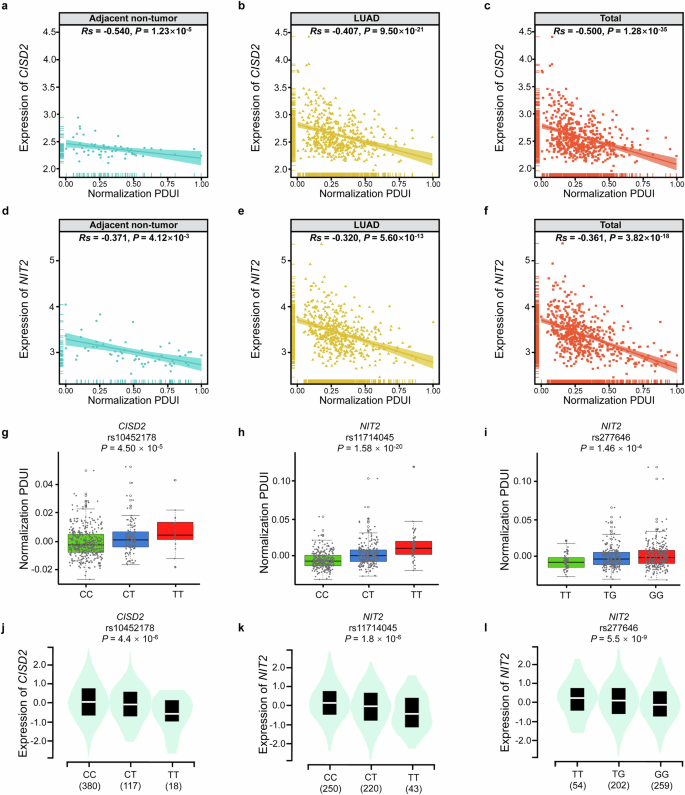
a–c The correlation between PDUI value and CISD2 expression in adjacent non-tumor tissues (a), LUAD tumor tissues (b) and total tissues (c). d–f The correlation between PDUI value and NIT2 expression in adjacent non-tumor tissues (d), LUAD tumor tissues (e) and total tissues (f). g–i The relationship between different genotypes of rs10452178 and CISD2 PDUI values (g), rs11714045 and NIT2 PDUI values (h), rs277646 and NIT2 PDUI values(i). j–l The relationship between different genotypes of rs10452178 and CISD2 expression (j), rs11714045 and NIT2 expression (k), rs277646 and NIT2 expression (l).
APA analysis of 3 identified apaQTL/eQTL-SNPs
As shown in the Fig. 2g–i, two apaQTL/eQTL-SNPs (rs10452178 and rs11714045) had significantly higher PDUI values under the variant alleles (P = 4.50 × 10⁻⁵, P = 1.58 × 10⁻²⁰), while the other apaQTL/eQTL-SNP (rs277646) had significantly lower PDUI values under the variant T allele (P = 1.46 × 10⁻⁴).
eQTL analysis of 3 apaQTL/eQTL-SNPs
The eQTL analysis indicated significantly lower expression levels of CISD2 under the variant T alleles of rs10452178 (P = 4.4 × 10⁻⁶), and similarly, significantly lower expression levels of NIT2 was observed under the variant T alleles of rs11714045 (P = 1.8 × 10⁻⁶). Besides, significantly higher expression levels of NIT2 was observed under the variant T alleles of rs277646 (P = 5.5 × 10⁻⁹) (Fig. 2j–l).
Expression analysis of CISD2 and NIT2
The mRNA expression level of CISD2 (P = 2.07 × 10⁻¹²) (Fig. 3a) and NIT2 (P = 1.23 × 10⁻⁷) (Fig. 3b) were both significantly higher in the LUAD tumor tissues (n = 57) from TCGA database. We further validated the mRNA expression level of CISD2 and NIT2 in the Chinese population. The result showed that the mRNA expression level of CISD2 and NIT2 were also higher in LUAD tumor tissues (n = 49) compared with paired adjacent non-tumor tissues (P = 4.31 × 10⁻³, P = 7.38 × 10⁻⁶) (Fig. 3c, d). In addition, their corresponding coding proteins also showed the same trend (P = 4.80 × 10⁻²¹, P = 3.31 × 10⁻²³), which were up-regulated in LUAD tumor tissues (Fig. 3e, f).
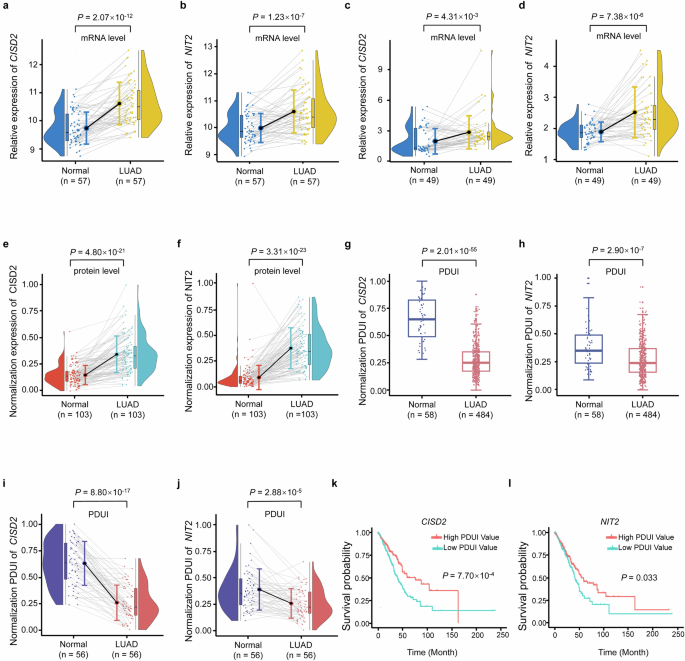
a, b CISD2 mRNA expression (a) and NIT2 mRNA expression (b) in the LUAD tumor tissues and paired adjacent non-tumor tissues in the TCGA dataset. c, d CISD2 mRNA expression (c) and NIT2 mRNA expression (d) in the LUAD tumor tissues and paired adjacent non-tumor tissues in the Chinese population. e, f CISD2 protein expression (e) and NIT2 protein expression (f) in the LUAD tumor tissues and paired adjacent non-tumor tissues in the Chinese population. g, h The PDUI value of CISD2 (g) and NIT2 (h) between LUAD tumor tissues and adjacent non-tumor tissues. i, j The PDUI value of CISD2 (i) and NIT2 (j) between LUAD tumor tissues and paired adjacent non-tumor tissues. k, l Survival analysis of PDUI value of CISD2 (k) and NIT2 (l).
PDUI analysis of CISD2 and NIT2
Using TCGA database, the PDUI value of CISD2 and NIT2 were significantly lower in total LUAD tumor tissues compared with adjacent non-tumor tissues (P = 2.01 × 10−55, P = 2.90 × 10⁻⁷) (Fig. 3g, h). We further performed PDUI analysis of CISD2 and NIT2 in 56 paired samples, and the results also showed that the PDUI value of CISD2 and NIT2 were also significantly lower in LUAD tumor tissues (P = 8.80 × 10⁻¹⁷, P = 2.88 × 10⁻⁵) (Fig. 3i, j). This implies that the 3′UTR length of CISD2 and NIT2 were significantly shorter in LUAD tumor tissues compared with adjacent non-tumor tissues.
Survival analysis of CISD2 and NIT2
To determine whether the occurrence of APA events in this study was related to the survival of LUAD patients, we performed survival analyses for patients from the TCGA dataset. The results showed that the overall LUAD survival is significantly longer in patients with high PDUI values of CISD2 and NIT2 than that with low PDUI values (P = 7.70 × 10⁻⁴, P = 0.033) (Fig. 3k, l).
The expression of CISD2 and NIT2 in cell lines
To determine the expression of CISD2 and NIT2 in LUAD cell lines, we performed protein blotting on LUAD cell lines and normal HBE cell line. The results indicate that NIT2 expression in LUAD cell lines (PC9 and SPCA1) is significantly higher than in HBE cells. Additionally, there is a trend of higher expression of NIT2 in the LUAD cell line A549 compared to HBE cells. However, the expression trend of CISD2 in LUAD cell lines (A549, PC9, and SPCA1) is not consistent (Fig. 4a).
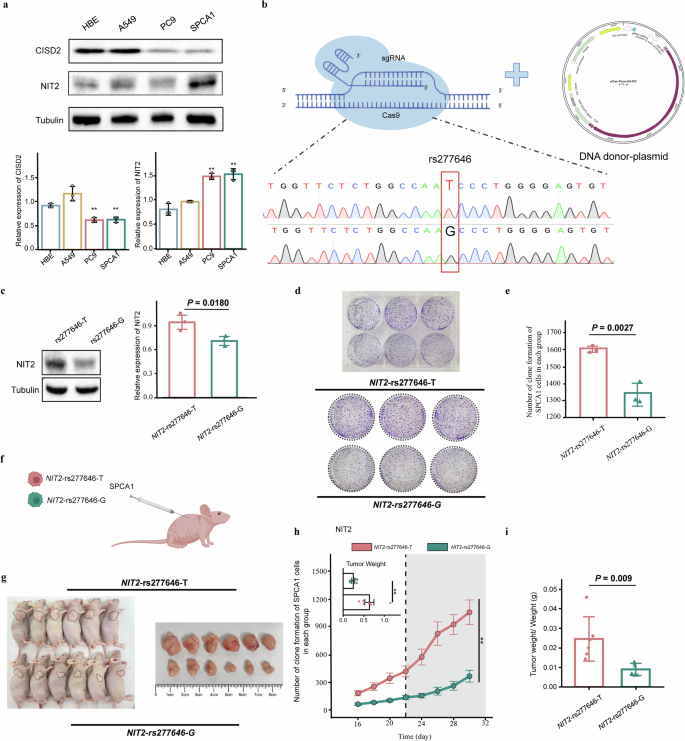
a The expression of CISD2 and NIT2 in cell lines. b NIT2-rs277646-G was obtained through genome editing mediated by CRISPR/Cas9. c The expression of NIT2 in NIT2-rs277646-T and NIT2-rs277646-G. d SPCA1 cell proliferation experiment after transfection. e The rs277646-T can promote the proliferation of SPCA1 cells. f Xenotransplantation animal model. g Macroscopic observation of tumor nudity. h Comparison of tumor volume changes and weight between NIT2-rs277646-T group (n = 6 mice) and NIT2-rs277646-G group (n = 6 mice) in mice. i The ratio of tumor weight to body weight in mice between the NIT2-rs277646-T group and the NIT2-rs277646-G group *P < 0.05, * * P < 0.01, * * * P < 0.001.
Effects of NIT2-rs277646 on the malignant phenotype of LUAD in vitro and vivo
Through CRISPR/Cas9 mediated genome editing, we successfully obtained NIT2-rs277646-G and performed DNA sequencing for validation (Fig. 4b). Meanwhile, Western blot analysis revealed that the expression of NIT2 in the NIT2-rs277646-T was higher than that in the NIT2-rs277646-G (P = 0.0180) (Fig. 4c). Compared with the NIT2-rs277646-G group, there was a significantly higher cell proliferation ability in the NIT2-rs277646-T group (P = 0.0027) (Fig. 4d–e).
To determine the effect of different alleles of rs277646 on tumor growth in vivo, SPCA1 cells transfected with NIT2-rs277646-T and NIT2-rs277646-G were injected into BALB/c-nu mice to construct an animal xenograft model (Fig. 4f). The results showed that the tumor volume growth rate in the NIT2-rs277646-G group was slower, while the tumor volume growth rate in the NIT2-rs277646-T group was faster and suddenly increased from the 22nd day (Fig. 4g, h). In addition, after killing the mice on the 30th day, the tumor weight of the NIT2-rs277646-T group significantly increased compared to the NIT2-rs277646-G group (Fig. 4i). Flow cytometry was performed on tumor tissue samples from a mouse model to detect and evaluate the apoptosis rate of the SPCA1 cell line under T and G alleles of rs277646 (Fig. 5a). The results showed that the apoptosis rate of the NIT2-rs277646-T group was significantly lower than that of the NIT2-rs277646-G group (Fig. 5b, c).
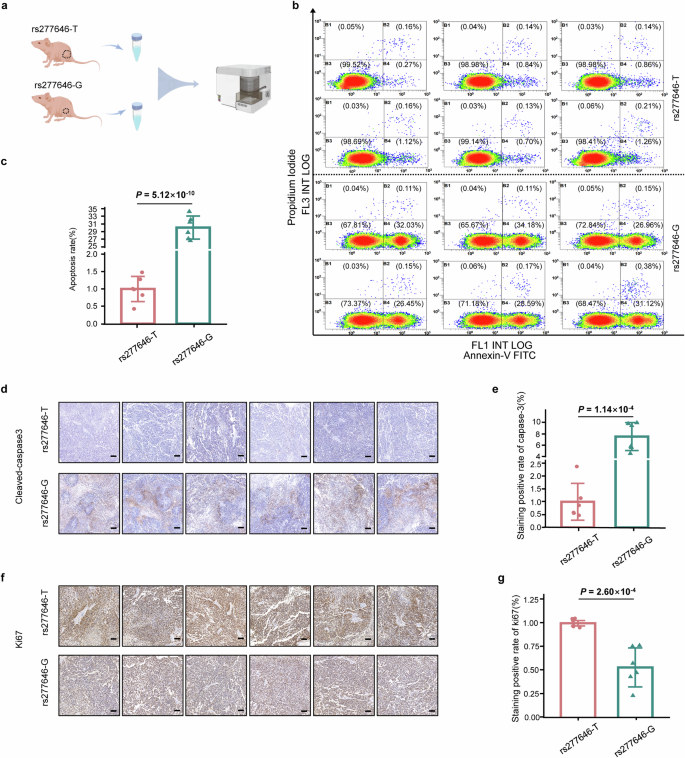
a Flow cytometry pattern diagram of primary tumor cells extracted from mice. b, c Flow cytometry was used to detect apoptosis of annexin V/PI. Harvest cells and use annexin V and 1 μ PI staining. Flow cytometry showed that the cells were in the stages of living cells, early cell apoptosis, and late cell apoptosis. Compared with the rs277646-G group, the apoptosis rate of tumor cells under rs277646-T was reduced. d Image of tumor slices from xenograft animals stained with Cleared Caspase-3 (100x objective). e The positive rate of Cleared Caspase-3 in the rs277646-T group was significantly lower than that in the rs277646-G group. f Image of tumor slices from xenograft animals stained with ki67 (100x objective). g The positive rate of ki67 staining in the rs277646-T group was significantly higher than that in the rs277646-G group.
Further analysis of mouse tumor tissue sections using immunohistochemistry staining with cleaved-caspase 3 and ki67 showed that the positive rate of caspase-3 staining in the rs277646-T group was significantly lower than that in the rs277646-G group, while the positive rate of ki67 staining in the rs277646-T group was significantly higher than that in the rs277646-G group (Fig. 5d–g), indicating the T allele of rs277646 may promote the malignant phenotype of LUAD.
Analysis of poly(A) sites of NIT2 based on the 3′RACE experiment
According to the UCSC website (https://genome.ucsc.edu/), rs277646 is located at the 194 bp upstream of the 3′UTR of NIT2 (Fig. 6a). Subsequently, through the NCBI website (https://www.ncbi.nlm.nih.gov/), it can be observed that the length of NIT2 3′UTR is 6367 bp. At the same time, there are 5 predicted poly (A) sites (PAS1-5) located at 949 bp, 961 bp, 1203 bp, 2472 bp, and 7233 bp, respectively. Subsequently, the 3′RACE experiment showed that the NIT2 in SPCA1 cell line mainly selectively recognizes the PAS1 and PAS3 sites (Fig. 6b, c).
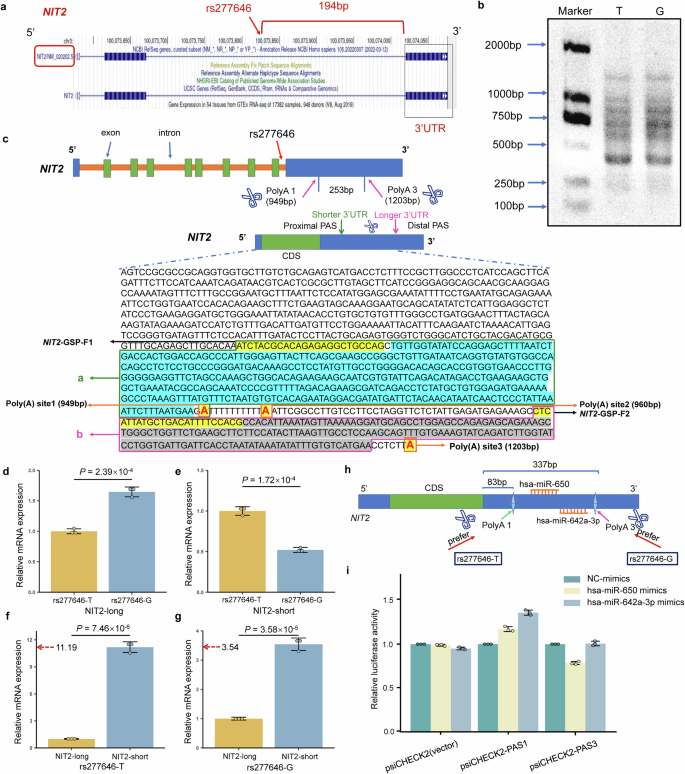
a The relationship between rs277646 on the NCBI website and the 3′UTR of the target gene NIT2. b Agarose gel map of PCR products of 3′RACE under different alleles of rs277646. c Different alleles of rs277646 may mediate differences in poly (A) selection, resulting in different 3′UTR transcript schematics and PCR product sequences. d The expression of the longer 3′UTR transcript of NIT2 in the rs277646-G allele is significantly higher than that in the T allele. e The expression of the shorter 3′UTR transcript of NIT2 in the rs277646-T allele is significantly higher than that in the G allele. f In the sample of rs277646-T allele, the expression of the shorter 3′UTR transcript of NIT2 was significantly higher than that of the longer 3′UTR transcript. g In the sample of rs277646-G allele, the expression of the shorter 3′UTR transcript of NIT2 was significantly higher than that of the longer 3′UTR transcript. h Pattern Diagram of miRNA Binding to the NIT2 3′UTR Region. i Dual luciferase reporter gene assay for 3′UTR of NIT2 and miR-650, miR-642a-3p; n = 3. 3′RACE, 3′ rapid amplification of cDNA ends; 3′UTR, 3′untranslated region; CDS, coding sequence; PAS, polyadenylation signal; GSP, gene-specific primer. *P < 0.05, * * P < 0.01, * * * P < 0.001.
The expression of NIT2 isoforms under different alleles of apaQTL/eQTL-SNP rs277646
The expression of the longer 3′UTR transcript of NIT2 was significantly lower in the rs277646-T allele than that in the G allele (P = 2.39 × 10⁻⁴) (Fig. 6d), while the expression of the shorter 3′UTR transcript of NIT2 was significantly higher in the rs277646-T allele than that in the G allele (P = 1.72 × 10⁻⁴) (Fig. 6e). Meanwhile, whether under the G allele or T allele of rs277646, the expression of the shorter 3′UTR transcript of NIT2 was significantly higher than that of the longer 3′UTR transcript (P = 7.46 × 10⁻⁶, P = 3.58 × 10⁻⁵) (Fig. 6f, g). At the same time, the ratio of the shorter 3′UTR transcript to the longer 3′UTR transcript under the T allele of rs277646 (ratio=11.19) was higher than that under the G allele of rs277646 (ratio=3.54). This indicates that the NIT2 inclined to produce shorter 3′UTR transcripts under the T allele of rs277646.
The impact of hsa-miR-650 binding to the long 3′UTR of NIT2
Due to the different genotypes of rs277646 affecting the expression of different subtypes of NIT2, we further investigated its influence on gene-miRNA interactions. Firstly, we selected microRNAs using the ENCORI database (http://starbase.sysu.edu.cn/) and miRDB (https://mirdb.org/ontology.html), ultimately identifying hsa-miR-650 and hsa-miR-642a-3p as two microRNAs. According to the prediction results from the TargetScan website (https://www.targetscan.org/vert_80/), both microRNAs are predicted to bind between Poly(A)1 and Poly(A)3. Specifically, Poly(A)1 is located 83 bp downstream from the start site of the NIT2 3′UTR, while Poly(A)3 is situated 337 bp downstream from the start site of the NIT2 3′UTR. hsa-miR-650 binds to the region spanning 248-255 bp of the NIT2 3′UTR, whereas hsa-miR-642a-3p binds to the region spanning 320-326 bp of the NIT2 3′UTR (Fig. 6h). To validate the involvement of microRNAs in this interaction, we constructed short sequences (~ PAS1) and long sequences (~ PAS3) for the luciferase reporter gene assay.
Results from the luciferase reporter gene assay showed that the hsa-miR-650 mimics or hsa-miR-642a-3p mimics did not bind to the short 3'UTR of the NIT2 (~ PAS1). However, in the long 3'UTR of NIT2 (~ PAS3), the has-miR-650 mimics significantly reduced luciferase activity, indicating that the has-miR-650 mimics binds to the long 3’UTR of NIT2 (~ PAS3); The luciferase activity of hsa-miR-642a-3p mimics did not decrease, indicating that hsa-miR-642a-3p mimics does not bind to the long 3'UTR of NIT2 (~ PAS3) (Fig. 6i). Therefore, the rs277646-T genotype leads to NIT2 preferentially utilizing the proximal poly(A) site, resulting in shorter 3'UTR transcripts, which leads to the loss of hsa-miR-650 binding sites on NIT2, thereby affecting the expression levels of NIT2.
Discussion
By integrating APA-related LUAD genes, 3′aQTL-atlas and eQTL analysis, we identified 28 candidate LUAD-related apaQTL/eQTL-SNPs, while rs277646, rs11714045, and rs10452178 were associated with the altered risk of develo** LUAD based on the China Nan**g Lung Cancer GWAS database. Additionally, the rs277646 in NIT2 may act as a causal variant associated with LUAD. The rs277646-T genotype causes NIT2 to preferentially use the proximal poly (A) site, resulting in a shorter 3'UTR transcript and the loss of the hsa-miR-650 binding site, thereby affecting LUAD malignant phenotypes by regulating NIT2 expression levels. Our findings may provide new insights into understanding and exploring APA events in LUAD carcinogenesis.
NIT2, identified as ω-amidase, plays an important metabolic role by catalyzing hydrolysis of α-ketoglutaramate and α-ketosuccinamate, yielding α-ketoglutarate and oxaloacetate, respectively18,19. Some studies have shown that the overexpression of NIT2 is related to the occurrence and development of colon cancer20,21 and tongue squamous cell carcinoma22. In colon cancer, the downregulation of NIT2 inhibits the proliferation of colon cancer cells and induces cell cycle arrest through the caspase-3 and PARP pathways. Meanwhile, low expression of NIT2 may not only inhibit the growth of colon cancer cells, but also promote apoptosis of cancer cells, indicating that NIT2 may play a role in promoting cancer20.
The rs277646 is located 194 bp upstream of the 3′UTR end of NIT2. In the APA analysis, the PDUI value of rs277646 decreased after mutation. According to the definition of PDUI value23, which means that if the PDUI value decreases, NIT2 may tend to use the proximal poly (A) site, resulting in producing transcripts with shorter 3′UTR. At present, eQTL analysis can provide clues for the correlation between SNPs and gene expression, while apaQTL analysis, as a bridge connecting functional SNPs and gene expression, effectively explains the intermediate molecular mediated mechanism of abnormal gene expression regulated by different SNPs genotypes. The eQTL analysis indicated rs277646 G > T increases the expression of NIT2 in lung tissue, which was consistent with the results of APA analysis. At the same time, in the population of China Nan**g Lung Cancer GWAS database, we found that rs277646 G > T increased the risk of develo** LUAD. It is biological plausible that rs277646 G > T affects the occurrence of APA events, making NIT2 tend to use the proximal poly (a) site, resulting in producing transcripts with shorter 3′UTR. This may make it easier to evade the negative regulation of microRNAs (miRNAs) or RNA binding proteins (RBPs), thereby enhancing its mRNA expression and protein translation. Resulting in an increase in the expression of NIT2 in LUAD tumor tissues, this in turn may affect protein expression levels, population susceptibility, and disease outcomes (Fig. 7).

The potential regulation mechanism of rs277646 mediating malignant phenotypic changes in LUAD by regulating the 3′UTR length of NIT2.
Combined with the ENCORI database (http://starbase.sysu.edu.cn/) of the bioinformatics prediction website, we explored the interaction between rs277646 mediated changes in the 3′UTR length in NIT2 and miRNA and RBPs. The results indicate that there is a significant correlation between the expression of RBPs and NIT2, such as ALYREF, RBMX, EIF4A3, U2AF1, PCBP2, DHX36, IGF2BP3, etc. And the expression of these RBPs is positively correlated with the expression of NIT2. So, with the mutation of rs277646 G > T, the 3′UTR of NIT2 is shortened, and the binding RBP sites are reduced, making RBP unable to bind, resulting in freer RBP and more expression of NIT2. Therefore, mutations in rs277646 G > T can lead to APA events, which may alter the length of 3′UTR by regulating the binding of RBPs to the target gene, thereby affecting the stability, expression level, and translation ability of the target gene24.
This study has the following highlights. Firstly, we accurately mapped apaQTL/eQTL-SNPs from 3′aQTL-atlas to APA-related LUAD genes. Secondly, APA-related LUAD genes were identified not only through correlation analysis between PDUI value and gene expression, but also according to the consistently differential expressed genes both at the mRNA and protein levels. Thirdly, the screening of SNPs with both apaQTL and eQTL functions (apaQTL/eQTL-SNPs) may help well explain the intermediate mediation mechanism of eQTLs and complement the shortcomings of eQTL analysis. Finally, a large sample population (8762 LUAD cases and 13,328 cancer-free healthy controls) of the susceptibility study may make our conclusions more reliable and persuasive.
Although our research indicates a potential significant association between candidate SNPs and LUAD in the Chinese population, some limitations remain. Firstly, features evaluated in European or American populations may be irrelevant or insensitive to the effects of these SNPs. Typically, larger sample sizes are required to achieve sufficient statistical power, especially when exploring genetic variations that may have moderate effects on phenotypes. Secondly, despite in vitro and in vivo experiments indicated the causal potential of rs277646 mediating malignant phenotypic changes in LUAD, however, we could not ignore the fact that the rs277646 in China Nan**g Lung Cancer GWAS have not reached genome-wide significance level, which needs further validation in larger sample of Chinese LUAD cases and controls.Thirdly, it’s important to acknowledge the influence of genetic heterogeneity within and between populations. Despite the China Nan**g Lung Cancer GWAS database appearing to be predominantly composed of the Chinese Han population, the public 3′aQTL-atlas and eQTL summary is based on European population data from the GTEx consortium. Due to these population differences, MAF and LD may vary between the two ancestries, potentially affecting the results of GWAS studies. In subsequent research, consideration of the impact of racial differences may also be necessary. Fourthly, although we rigorously filtered based on consistent expression patterns between proteins and mRNA, when selecting APA-related genes, using |Rs | > 0.3 and PFDR < 0.05 as criteria for defining genes related to APA events might be too loose, thus potentially compromising the accuracy and interpretation of the results. Finally, the correlation between PDUI and NIT2 expression in LUAD tumor tissues is moderate, with a |Rs| value of 0.320, slightly exceeding 0.3, suggesting a potential risk of insufficient correlation significance, which may warrant further consideration and validation. Therefore, this factor should be carefully considered when interpreting and inferring these results.
Methods
Selection of APA-related LUAD genes
In the global APA events of different cancer types from TCGA database characterized by ** LUAD based on the odds ratios (ORs) and 95% confidence intervals (CIs), adjusting for age, gender, smoking pack-years (smoking status if pack-years information was not available in specific studies) and the top 10 Principal components. To avoid potential batch effects from gene expression quantification, gene expression was recalculated as reads per kilobase per million mapped reads (RPKM) for all TCGA samples when calculating the correlation between gene expression and PDUI value. Spearman correlation analysis was used to analyze and evaluate the correlation between PDUI values and corresponding gene expression. Violin plots of CISD2 and NIT2 expression for different genotypes in lung tissue (Fig. 2j–i) were obtained from the GTEx Portal (https://gtexportal.org/home/testyourown). Kaplan Meier survival analysis was used to evaluate the effect of PDUI values of target genes on the overall survival of LUAD patients. Due to the different expression ranges of genes in various databases, normalization of the data was necessary for reliable and meaningful comparisons. We balanced these values through a min-max normalization process, which transformed them into a range of (0,1). Log-rank test was used to compare the difference of survival rate between different groups. All bar graphs are representative of three or more independent experiments as indicated in the figure legends. All statistical tests were two-sided, and P-values < 0.05 were considered statistically significant. All statistical analyses were performed by R version 4.1.1 software.
Reporting summary
Further information on research design is available in the Nature Portfolio Reporting Summary linked to this article.
Data availability
The gene expression data of 57 paired LUAD tumor tissues and adjacent non-tumor tissues were sourced from the publicly available TCGA database (TCGA-LUAD) (https://portal.gdc.cancer.gov/projects/TCGA-LUAD). The comprehensive transcriptomics database of LUAD (49 paired LUAD tumor tissue and adjacent non-tumor tissues) from the Chinese population are available at the Gene Expression Omnibus (GEO) repository under Study Accession GSE140343, and the proteomic database of the above same Chinese population are available at iProx Consortium with the subproject ID IPX0001804000. The data on PDUI values in APA events are available in the Synapse database https://www.synapse.org, login number is syn7888354. The China Nan**g Lung Cancer GWAS data is not publicly accessible, but any organization can apply to this team (M.Z. and H.S.) for this GWAS data. All other data are available from the corresponding author (or other sources, as applicable) on reasonable request. The numerical source data behind the graphs in the manuscript can be found in supplementary data. The uncropped gels are shown in supplementary Figs. 2–3.
Code availability
The code used in this study can be found in the supplementary documents.
References
Siegel, R. L., Miller, K. D. & Jemal, A. Cancer statistics, 2020. CA Cancer J. Clin. 70, 7–30 (2020).
Sung, H. et al. Global Cancer Statistics 2020: GLOBOCAN Estimates of Incidence and Mortality Worldwide for 36 Cancers in 185 Countries. CA Cancer J. Clin. 71, 209–249 (2021).
Ji, X., Fang, Y. & Liu, J. Analysis of the clinicopathological characteristics and their trends among patients with lung cancer undergoing surgery in a tertiary cancer hospital of north China during 2000-2013. J. Thorac. Dis. 10, 3973–3982 (2018).
Hammouz, R. Y. et al. Differential expression of lung adenocarcinoma transcriptome with signature of tobacco exposure. J. Appl Genet 61, 421–437 (2020).
Qin, N. et al. Comprehensive functional annotation of susceptibility variants identifies genetic heterogeneity between lung adenocarcinoma and squamous cell carcinoma. Front Med 15, 275–291 (2021).
Chen, K. C., Tsai, S. W., Shie, R. H., Zeng, C. & Yang, H. Y. Indoor Air Pollution Increases the Risk of Lung Cancer. Int J Environ Res Public Health 19, https://doi.org/10.3390/ijerph19031164 (2022).
Bosse, Y. & Amos, C. I. A Decade of GWAS Results in Lung Cancer. Cancer Epidemiol. Biomark. Prev. 27, 363–379 (2018).
Wang, Y. et al. SNP rs17079281 decreases lung cancer risk through creating an YY1-binding site to suppress DCBLD1 expression. Oncogene 39, 4092–4102 (2020).
Yang, W. et al. Deciphering associations between three RNA splicing-related genetic variants and lung cancer risk. NPJ Precis Oncol. 6, 48 (2022).
Consortium, G. T. The GTEx Consortium atlas of genetic regulatory effects across human tissues. Science 369, 1318–1330 (2020).
Tian, B. & Manley, J. L. Alternative polyadenylation of mRNA precursors. Nat. Rev. Mol. Cell Biol. 18, 18–30 (2017).
Mittleman, B. E. et al. Alternative polyadenylation mediates genetic regulation of gene expression. Elife 9, https://doi.org/10.7554/eLife.57492 (2020).
Mayr, C. What Are 3’ UTRs Doing? Cold Spring Harb Perspect Biol 11, https://doi.org/10.1101/cshperspect.a034728 (2019).
**ang, Y. et al. Comprehensive Characterization of Alternative Polyadenylation in Human Cancer. J. Natl Cancer Inst. 110, 379–389 (2018).
Shulman, E. D. & Elkon, R. Systematic identification of functional SNPs interrupting 3’UTR polyadenylation signals. PLoS Genet 16, e1008977 (2020).
Feng, X., Li, L., Wagner, E. J. & Li, W. TC3A: The Cancer 3’ UTR Atlas. Nucleic Acids Res 46, D1027–D1030 (2018).
Cui, Y. et al. 3’aQTL-atlas: an atlas of 3’UTR alternative polyadenylation quantitative trait loci across human normal tissues. Nucleic Acids Res 50, D39–D45 (2022).
Meister, A., Levintow, L., Greenfield, R. E. & Abendschein, P. A. Hydrolysis and transfer reactions catalyzed by omega-amidase preparations. J. Biol. Chem. 215, 441–460 (1955).
Meister, A. Preparation of enzymatic reactions of the keto analogues of asparagine and glutamine. J. Biol. Chem. 200, 571–589 (1953).
Zheng, B., Chai, R. & Yu, X. Downregulation of NIT2 inhibits colon cancer cell proliferation and induces cell cycle arrest through the caspase-3 and PARP pathways. Int J. Mol. Med 35, 1317–1322 (2015).
Chen, Y. et al. Identification of macrophage related gene in colorectal cancer patients and their functional roles. BMC Med Genom. 14, 159 (2021).
Chen, S., Wang, Z. & Feng, C. NIT2 overexpression predicts poor prognosis in tongue squamous cell carcinoma patients. Mol. Biol. Rep. 47, 1553–1561 (2020).
Venkat, S. et al. Alternative polyadenylation drives oncogenic gene expression in pancreatic ductal adenocarcinoma. Genome Res 30, 347–360 (2020).
Navarro, E., Mallen, A. & Hueso, M. Dynamic Variations of 3’UTR Length Reprogram the mRNA Regulatory Landscape. Biomedicines 9, https://doi.org/10.3390/biomedicines9111560 (2021).
Xu, J. Y. et al. Integrative Proteomic Characterization of Human Lung Adenocarcinoma. Cell 182, 245–261.e217 (2020).
Liu, Y. et al. Identification of the consistently differential expressed hub mRNAs and proteins in lung adenocarcinoma and contraction of the prognostic signature: a multidimensional analysis. Int. J. Surg. https://doi.org/10.1097/JS9.0000000000000943 (2023).
Dai, J. et al. Identification of risk loci and a polygenic risk score for lung cancer: a large-scale prospective cohort study in Chinese populations. Lancet Respir. Med 7, 881–891 (2019).
Acknowledgements
The authors wish to thank all the study participants, research staff and students who participated in this work. This work was supported by the National Natural Science Foundation of China (82273715, 82203771), the National Key Research and Development Program of China (2022YFC2503202), the Science and Technology Program of Nantong City (MS22022062, JC22022002, JC22022004), and the Postgraduate Research and Practice Innovation Program of Jiangsu Province (KYCX23-3436).
Author information
Authors and Affiliations
Contributions
Conceptualization, Huiwen Xu, Yutong Wu, Qiong Chen and Yuhui Yu; Data curation, Na Qin and Wendi Zhang; Formal analysis, Huiwen Xu; Funding acquisition, Minjie Chu; Methodology, Tian Tian, Jiahua Cui and Lei Zhang; Software, Qianyao Meng, **aobo Tao and Qiong Chen; Supervision, Minjie Chu, Jiahua Cui and Tian Tian; Validation, Na Qin, Hongxia Ma and Minjie Chu; Visualization, Huiwen Xu, Yutong Wu and Siqi Li; Writing – original draft, Huiwen Xu, Yutong Wu, and Minjie Chu; Writing – review & editing, Huiwen Xu, Yutong Wu, Qiong Chen, Yuhui Yu, Qianyao Meng, Na Qin, Wendi Zhang, **aobo Tao, Siqi Li, Tian Tian, Lei Zhang, Hongxia Ma, Jiahua Cui, Minjie Chu. All authors have read and agreed to the published version of the manuscript.
Corresponding authors
Ethics declarations
Competing interests
The authors declare no competing interests.
Informed Consent Statement
Informed consent was obtained from all subjects involved in the study.
Peer review
Peer review information
Communications Biology thanks the anonymous reviewers for their contribution to the peer review of this work. Primary Handling Editors: Aylin Bircan and Mengtan **ng. A peer review file is available.
Additional information
Publisher’s note Springer Nature remains neutral with regard to jurisdictional claims in published maps and institutional affiliations.
Rights and permissions
Open Access This article is licensed under a Creative Commons Attribution 4.0 International License, which permits use, sharing, adaptation, distribution and reproduction in any medium or format, as long as you give appropriate credit to the original author(s) and the source, provide a link to the Creative Commons licence, and indicate if changes were made. The images or other third party material in this article are included in the article’s Creative Commons licence, unless indicated otherwise in a credit line to the material. If material is not included in the article’s Creative Commons licence and your intended use is not permitted by statutory regulation or exceeds the permitted use, you will need to obtain permission directly from the copyright holder. To view a copy of this licence, visit http://creativecommons.org/licenses/by/4.0/.
About this article

Cite this article
Xu, H., Wu, Y., Chen, Q. et al. Integrating apaQTL and eQTL analysis identifies a potential causal variant associated with lung adenocarcinoma risk in the Chinese population. Commun Biol 7, 860 (2024). https://doi.org/10.1038/s42003-024-06502-0
Received:
Accepted:
Published:
DOI: https://doi.org/10.1038/s42003-024-06502-0
- Springer Nature Limited