
Abstract
The urban development of China is changing from incremental expansion to stock renewal mode. The study of urban functional areas has become one of the important fundamental works in current urban renewal and high-quality urban development. In recent years, big spatiotemporal data has been well applied in the urban function field. However, the study of spatial–temporal evolution characteristics and forecasting optimization for mixed-use urban functional areas has not been examined well. Thus, in this study, we proposed a new approach that applies a revised information entropy method to analyze the degrees of mixing for urban functional areas. We applied our approach in **an City, Shandong Province as the study area. We used Point-of-Interest, OpenStreetMap and other datasets to identify the mixed-use urban functional areas in **an. Then, the CA–Markov model simulated the urban layout in 2025. The results showed that: (1) the combination of road network and kernel density method has the highest accuracy of identifying urban functional areas. (2)The mixing degree model is constructed by using the improved information entropy, which makes up for the shortcoming of identifying the mixed functional areas simply by the frequency ratio of POI data. (3) The “residence and business” functional area has the highest proportion in the central area of **an from 2015 to 2020, and the total area of mixed-use unban functional areas continuously increased during this period. (4) The total area of the central area in **an has significantly increased in 2025. The optimization of urban functions should expand mixed-use functional areas and increase the proportion of infrastructure. Also, **an should improve the efficiency of space development.
Introduction
A city is a complex organism composed of its structure and functions. The urban spatial structure is the skeleton of a city, and urban functional layout is the concrete expression of the urban spatial structure. The urban development of China is gradually shifting from incremental mode to stock-based mode1, and the optimization and improvement of urban internal spatial structure and functions are one of the important topics in the field of urban renewal in the future2. In order to propose suitable governance strategies, it is necessary to identify current urban functions, and simulate and analyze different spatial structures of urban functions3,4.
The study of urban function is the basis of recognizing the complex urban system, exploring the change of urban land use, and realizing the sustainable development of the city. The research on identifying urban functional areas is conducive to a deeper understanding of urban spatial development. Also, the research on identifying urban functional areas plays an essential role in urban spatial planning and sustainable development decision-making5. Some scholars have examined well some parts of the urban functions, such as the identification of urban functional areas and evaluation of the current layout of urban functions. Some notable works are Chen et al.6 used Nan**g City as a study area to explore the similarity and differences between functional areas and administrative areas. They also analyzed the development history of urban functional areas and the trend of urban reorganization. Huang et al.7 provided an idea of sustainable development and five principles of urban zoning based on analyzing urban functional areas. **ng et al.8 examined the rationality of urban functional areas from the perspective of landscape patterns. Besides those works, some scholars also discussed the identification and prediction of mixed-use functional areas in western countries. For example, Song et al.9 reviewed a wide range of measures of urban land use mix and conducted a Monte Carlo simulation model to compare results from Hillsboro, Oregon, USA. They found that each measure provides a distinct perspective on mixed-use. Thus, the appropriate mixed-use measure should be determined by the number of land use dimensions of interest and the approximate scales at which land use mix influences the outcome of interest. Wandl and Hausleitner10 identified mixed-use functional areas in eight areas across Europe. In their work, they involved a number of different economic activities and the ratio of the working population to residential population within one area to describe mixed-use functions.
However, due to historical reasons and the formation characteristics of urban functional areas, a single functional area per each land use category (e.g., residence only in the residence category) is not suitable for the demand of current urban development. The reason is that single functional areas could cause extensive land use and low utilization of land use. From the urban renewal process in western countries, the construction of mixed-use functional areas has become the focus of urban renewal and development11. However, the urban planning in China has been focusing on single-use functions for a long time and not paying enough attention to mixed-use functions. In fact, during the development and evolution of cities, a variety of mixed-use functions areas have been formed, such as high-rise buildings, which may contain residential, office, and commercial services. In the high-quality development of Chinese cities, the emphasis on mixed-use functions is the national demand in the future. Facing the urgent purpose of urban renewal in modern society, identifying mixed-use functional areas, excavating the modes of mixed-use urban functions, and evaluating the rationality of mixed-use functions have become vital scientific problems12. Those issues should be solved first, then decision-makers can make a better decision and then improves the sense of gain, security, and happiness of residents.
With the development and maturity of new technologies, identifying urban functional areas involving big spatiotemporal data has been a hotspot topic in recent years. Big spatiotemporal data contains traditional geospatial data (with the advantages of high precision, wide coverage, and timely update). It also contains new types of geospatial data, such as cellular signaling data, social media data (e.g., Weibo Check-in), and GPS track records, which can provide more insights into urban management and territorial space planning13. In existing studies of urban functions, the commonly used big data includes POI data, mobile phone signaling data, social media data, and GPS data etc. Because of the features of POI data, close to land use data, crowdsourcing data characteristics, easy to obtain, each record includes name, category, coordinates, classification code and so on, more than 70% of those studies use POI data14,15,16,17,18. POI data has become the core data for location-based services17.
However, existing studies focused on using big spatiotemporal data to identify the boundaries of urban or main functional areas. Although some pioneers have already investigated the identification of mixed-use functional areas, these studies have not comprehensively examined identifying mixed-used functional areas19. For example, Zhao et al.20 compared ten measurement models of mixing degrees. They found that models are suitable for measuring the overall mixing degree at mesoscale, such as district and block. Li et al.21 explored the residential planning mode of mixed-use land use. Hu et al.22 examined the recognition of urban functional areas and their mixing degree in Chongqing using POI data. Li et al.23 combined POI and taxi-OD data to evaluate the mixed urban functions quantitatively. Moreover, they revised the information entropy model to develop spatial entropy and temporal entropy. Li et al.24 typically applied random forest to determine the weights of POI, then they used the urban function calculation model to identify single dominant functional areas and information entropy to calculate the mixing degree of urban functions. Although some scholars investigated the identification of mixed-use functional areas and their mixing degree, the identification and analysis of mixed-use urban functions are not in-depth. The major reasons are different classification standards, unclear definitions of mixed-use function units, and different spatial scales.
Furthermore, some scholars suggested that the study of the identification of urban functional areas should use multi-source data. Different levels and functional areas should use different datasets and identification units. These suggestions showed that the identification of urban function areas can improve accuracy and efficiency through new technologies and multi-source data and also need to create different identification processes and approaches for different levels and different functional areas. But, there is still no breakthrough in selecting appropriate functional identification units and approaches25. Because it is difficult to quantify the correct mix or the spatial relations among different POI types indicative of specific urban functions26.
We summarizde existing issues in the current urban functions field as follows: (1) there is a lack of comparative study on the approaches and identification units of different functional areas. (2) A personalized model for identifying urban mixed-use functions is lacking. (3) there is a lack of multi-level spatial analysis and optimization simulation analysis of urban function. Therefore, in this study, we adopted spatial grid and road network division units to identify **an functional areas using frequency density, category ratio and kernel density estimation method. Then, we evaluated the accuracy of our approach and found the most suitable identification approach for **an City. Also, we analyzed the spatial structure of **an's functional areas from 2015 to 2025 based on the CA–Markov model, and gave appropriate suggestions to optimize the layout of urban spatial structure. The approaches used in this study could provide a reference for the high-quality development of the city.
Materials and methods
Study area
**an City is the capital of Shandong Province and is famous for its spring city. It is also the political, economic, cultural, technological, educational and financial center of Shandong Province. **an City is located between 36°01′N-37°32′N and 116°11′E-117°44′E. Until 2020, **an has 12 county-level administrative regions, including ten municipal districts and two counties. They are Shizhong district, Lixia district, Huaiyin district, Tianqiao district, Licheng district, Changqing district, Zhangqiu district, Jiyang district, Laiwu district, Gangcheng district, **yin county, and Shanghe county. The total area of the city is 10,244km2, the total area of the built-up region is 760.6km2, and the urbanization rate is 71.21%. According to the latest census data, the registered population of **an reached 8.16 million, which ranked 27th in the country.
**an connects Bei**g-Tian**-Hebei region in the north, and Yangtze River Delta in the south. It is one of the important transportation hubs in East China. Because of springs, **an is a famous historical and cultural city and one of the first batch of excellent tourist cities in China. **an is also a national pilot city for the transformation of new and old kinetic energy27. Thus, in the first three quarters of 2022, the GDP of **an (864.201 billion Chinese yuan) ranked 20th in entire China. In this study, we choose the downtown area and central area of **an as the study area, the map of this study is shown in Fig. 1.
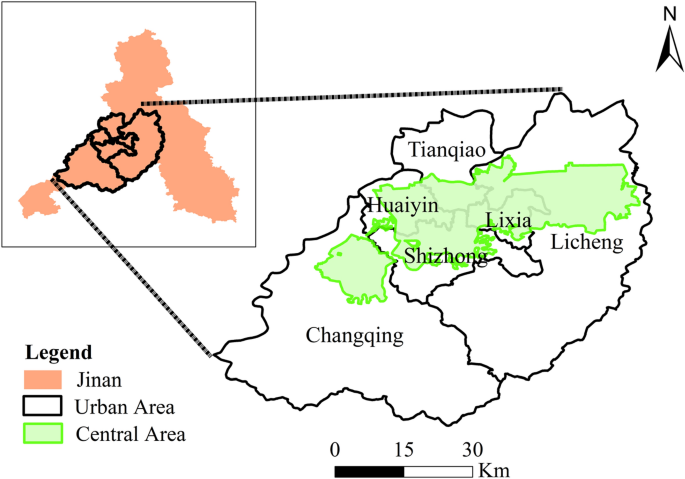
The map of **an City. The figure was created using ArcGIS 10.2 (https://support.esri.com/en/Products/Desktop/arcgis-desktop/arcmap).
Data sources
OpenStreetMap (OSM) Data. OSM is one of road network data. It is easy to access and free for the public. OSM has high positioning accuracy and accurate topological relationship, the data includes longitude and latitude, road type, road name, maximum driving speed, and other attribute information. We downloaded the data from OSM website (https://www.openstreetmap.org/), and processed the data using ArcGIS software.
Point-of-Interest (POI) Data. POI data is the point data of real geographical entities with spatial attribute information. Meanwhile, it has a number of advantages, such as large data size, wide coverage, easy to obtain, detailed information (e.g., names of buildings, categories of buildings, and coordinates) and timely updates. Because of those advantages, POI data is a widely used dataset in urban studies. Currently, there are a set of available POI resources, such as Baidu, Gaode and Tencent in China, as well as Google and OSM in western countries. In order to provide an accurate and convincing result, we used Gaode POI data because it has better data integrity in our study area. In this study, we collected 2020 POI data from Gaode (https://maps.gaode.com/). Each POI record contains a series basic contents, for example, name, longitude and latitude, administrative region, and address.
The original POI data has three levels of categories (23 big categories, 267 mid categories, and 869 subcategories; https://lbs.amap.com/api/webservice/download). We removed duplicate and missing records. Finally, 72,323 records in 2015 and 332,329 records in 2020 were obtained. Based on “Standards of Urban Land classification and Planning Construction Land” (GB50137-2011) and land use classification of **an City, we further reclassified the data into six new categories, including residential area, business area, industrial area, public service facilities, traffic facilities, green space and square (Table 1)28.
Other Datasets Besides OSM and POI, we involved other datasets in verifying our results. The datasets include (1) boundary map of administrative zones. The boundary map of administrative zones of **an City was obtained from the Geographical Information Monitoring Cloud Platform (http://www.dsac.cn/). (2) Remote sensing images. We collected the remote sensing images from Google Earth and Gaode in August 2015 and May 2020, the spatial resolution of those images is 30 m × 30 m. (3) Statistical yearbook data. We acquired those datasets from the **an Bureau of Statistics (http://jntj.**an.gov.cn/col/col27523/index.html). (4) Map of urban planning in **an.These maps mainly come from the related data of **an city government's official website (http://gh.nrp.**an.gov.cn/).
Research methods
Frequency Density and Ratio Index. Frequency density (FD) is the most commonly used index in the study of the identification of urban functions. This index gives the frequency per unit for the data in this class, where the unit is the unit of measurement of the data. In this study, FD is used to calculate the total records of POI data in each identification unit and then get the frequency density and ratio index per unit. For each functional area unit, we identify the functional areas based on frequency density and ratio index. The formulas are29,30:
where i indicates the type of POI, k is the total number of types of POI. ni represents the number of type i POI in a unit, whereas Ni is the total number of type i POIs. Fi is the frequency density of type i POIs in a unit, and Ci is the proportion of the frequency density of type i POIs in a unit. Wi represents the weight for each frequency density (the general value is 1).
Kernel density estimation (KDE) Method. Kernel density estimation is the most important and intuitive method to measure the aggregation degree of POI data30. It can not only clearly display the number of POI records in each unit, it also can compare the aggregation degree of POI records in different areas, and further visualize the results32,33. The calculation of kernel density estimation is shown in Eq. (3):
where f(x) is the estimated kernel density at x. ci is the ith spatial location of POIs within the bandwidth. h is the threshold of distance decay, i.e., bandwidth. n is the number of POIs that the distance between x is less than or equal to h. Φ is a spatial weight function. In this study, we use the quartic weight equation (Eq. 4).
CA–Markov Model. A CA–Markov model is a robust approach to spatial and temporal dynamic modeling of land use changes. Because the CA–Markov model absorbs the benefits from time series and spatial predictions of the Markov and CA theory, it can be used to carry out the spatial–temporal pattern stimulation34,35. There are a series of studies that used CA–Markov model, please see35,36,37 for more detail about this model. In this study, we use Markov model to get land transfer area matrix in IDRISI software, use LOGISTICREG module to generate suitability maps, and use CA–Markov model to simulate land use patterns in the future38.
Information Entropy. Shannon proposed information entropy in 1984. It is mainly a measurement of uncertainty, which describes the order degree of urban spatial structure. The value reflects the number of types of functional areas and the evenness of the distribution of different types of function areas. The more types of functional areas, the greater value of information entropy, and the lower the order degree of the functional area system. The equation is shown in Eq. (5)39,40:
where H is information entropy (unit: Nat), n is the total types of urban functional area. Ai is the total area of each type, and A is the total land area.
Based on the equation of information entropy, we can define the equilibrium degree of spatial structure:
where J is the equilibrium degree, H is the actual information entropy, and Hmax is the maximum information entropy. When J = 0, the spatial structure is in the most unbalanced state; When J = 1, the spatial structure reaches the ideal equilibrium state. In the meantime, dominance degree (J) reflects the degree to which one or multiple types of functional areas dominate the region. It is opposite to the equilibrium degree. The equation is shown in Eq. (7).
Mixing Degree Model. The mixed-use urban functions typically represent different functions (two or more functions) within a unit. A typical example is commercial (lower stories are used for commercial functions) and residential (higher stories are used for residential functions) buildings. In order to address the shortcomings of FD, we apply revised information entropy to measure the degree of mixing for urban functions. We adopt ratio index into the conventional information entropy, which overcomes the shortcoming that determines the mixed-use urban functions only depending on FD and ratio index. The high value of revised information entropy stands high degree of mixing (more functions for one unit)41, the equation of revised information entropy is:
where M is the degree of mixing. n is the number of POI types in one unit, Ci is the ratio index of POI types in one unit.
Results and discussions
The selection of identification of urban functional areas approach
The approaches of identification of urban functional areas
In this study, we compared the performance among three identification approaches: (1) spatial grid and FD, (2) OSM, KDE and FD, and (3) OSM and FD. We also did mutual verification experiments among those three approaches.
The spatial grid and FD approach first divides the research area into grid units with fixed unit size. Based on our previous work, we empirically use 50 m × 50 m grid cells. Then POI data is involved in calculating FD and ratio index per grid. When two-category functional areas have larger Ci values (20% ≤ Ci ≤ 50%) in one grid unit, this grid unit is assigned to a mixed-use functional area. When only one functional area has larger Ci values (Ci ≥ 50%), this grid unit is assigned to a single functional area. When Ci equals 0, this grid unit is no data area. The rest situations are integrated areas.
The OSM, KDE and FD approach divides the whole study area into units based on road network, and then KDE calculates the density based on POIs. We also involve FD and ratio index to group the identification units. According to the classifications of functional areas in **an, we use 200 m as the bandwidth of KDE. The standard of classification of FD and ratio index is the same as the spatial and FD approach.
The OSM and FD approach can be seen as a combination of previous two approaches. That is, the identification unit is divided based on the road system, and the identification results are calculated by FD. For detailed information, please refer to spatial grid and FD approach and OSM, KDE and FD approach.
Results of identification of urban functional areas
We use confusion matrix and kappa coefficient to evaluate the performance of each approach. Typically, the range of kappa coefficient is between 0 and 1. The higher value of kappa coefficient, the result is more accurate. The kappa coefficient value is between 0 and 0.2, the results have the lowest accuracy. When the value of kappa coefficient is between 0.41 and 0.6, the results are acceptable. The value between 0.61 and 0.8 stands for higher accuracy, whereas the value is greater than 0.81, the results have the highest accuracy.
The confusion matrix result depends on remote sensing images of **an in 2020 from Google Earth and Gaode. We randomly selected 40 identification units to calculate the confusion matrix and kappa coefficient. Table 2 shows the overall accuracy and kappa coefficient for each approach.
Comparing overall accuracy and kappa coefficient, the OSM, KDE and FD approach has the higher accuracy, which overall accuracy is around 80% and kappa coefficient is around 0.77. Thus, we choose this approach to identify the urban functional areas in this study. The confusion matrix is shown in Table 3.
Characteristics of **an functional areas
“Residential/Business” is the highest proportion of mixed-use functional areas
In 2020, the downtown area of **an City has 13,113 units based on the road system division, and the total area is 3254.72 km2 (Table 4). There are 2700 units in the central area with a total area of 651.02km2. For single functional areas, residential areas are the largest functional areas in the downtown area and central area of **an. The total residential areas in downtown and central areas are 324.16km2 (10.28%) and 225.35km2 (34.62%). For mixed-use functional areas, residential/industrial (538.36km2) and residential/business (105.40km2) areas have the largest area in downtown and central area, respectively. Those results are consistent with the actual situation.
The spatial distribution of urban functional areas in **an City can be found in Fig. 2. Residential and business areas are mainly distributed in the central area. Industrial areas are far from the central area. Public service facilities and green spaces distribute sporadically. As discussed in Fan et al. and DouSuggestions for urban functional areas in **an City According to our results, we have a number of suggestions for urban renewal in **an City. The suggestions are: **an has a smaller area of green space and square, larger area of business areas, lower per capita traffic facilities area, and lower per capita green space and square area. Therefore, It is necessary to increase the proportion of mixed-function land, improve the level of land intensive use, and ensure the sustainable development of land resources. The layout of business areas is dispersed, and there is still room for improvement in the degree of aggregation of business areas in **an City. Under the current urban structure, it is not only increasing costs of urban construction but also not conducive to intensive land use and sustainable development in the future. Therefore, gradually adjusting the spatial structure of urban functional areas is necessary. In particular, residential/industrial functional areas need to be adjusted because it affects the living environment. According to our findings, we suggest that residential and business areas will continue to expand in the future. At the same time, the number of public service facilities, road traffic facilities, green space and square, and other infrastructure facilities may be reduced correspondingly. **an City should replan urban development strategies in order to satisfy the needs of residents. Decision-makers should consider the relationship between the intensity of spatial development and regional planning, use different planning policies in different areas, promote intensive land use development, and promote simultaneous development of urban and rural areas. **an City should increase the proportion of mixed-use functional areas and infrastructure facilities, improve the efficiency of urban space development, and achieve the maximum value of land use with the less occupied area47.
Conclusion
This study compared three identification approaches to identify urban functional areas in **an City based on POI data. Meanwhile, confusion matrix and kappa coefficient to verify the accuracy of each approach. This study also analyzed the urban spatial structure of **an City, summarized existing issues in the structure of urban functions in **an, and provided a number of suggestions to adjust the spatial structure of **an in the future. The primary conclusions of this study are as follows:
-
1)
This study compared three identification approaches: (1) spatial grid and FD, (2) OSM, KDE and FD, and (3) OSM and FD. They all perform well, but the OSM, KDE and FD approach perform better than others.
-
2)
From 2015 to 2020, the total area of mixed-use functional areas was continuously increasing. Therefore, the distribution of functional areas in downtown and central areas is rationality.
-
3)
In 2025, residential and business areas will continually expand, but their related ancillary facilities, such as road traffic facilities and green space, cannot satisfy residents’ needs.
-
4)
In order to optimize the spatial layout of urban functions in the future, **an should reasonably expand the proportion of mixed-use functional areas and infrastructure land and improve the efficiency of urban space development and utilization.
Our future work will focus on a set of trends. First, we only involved POI data in this study. We will use more datasets in the future to compare their performance. Second, although the OSM, KDE and FD approach achieved the highest accuracy in this study. The limitations of OSM and POIs (e.g., uneven distribution of data) may cause bias. Thus, we will apply multiple road network datasets to examine the results. Third, our simulation model only had two historical datasets. We will use more historical datasets and different simulation models to do a contrastive analysis. In addition, a gold standard/benchmark to validate functional areas and associated uses should be examined in the future.
Data availability
The datasets used and/or analyzed during the current study are not publicly available due to General Data Protection Regulations; however, they are available from the corresponding author upon reasonable request.
References
Shi, Y., Zhai, G., Chen, W., Zhou, S. & Liu, H. Study on urban parcel renewal from the perspective of functional reconstruction—Nan**g Longtan Bonded logistics center as an example. Planner 34, 57–62 (2018).
Chen, X. & Duan, J. What they talk about when they talk about urban regeneration: Understanding the concept ‘urban regeneration’ in PRD China. Cities 130, 103880 (2022).
Duan, Z. Research on the temporal and spatial evolution of cultural industry agglomeration and diffusion in **'an Doctoral thesis, Shaanxi Normal University, (2013).
Shen, H. & **g, C. Spatial governance in urban stock space renewal under the background of functional transformation: An analytical framework based on spatial production theory. Public Manag. Policy Rev. 10, 128–138 (2021).
Liu, Y. On the characteristics of the new era of the evolution of China’s man land relationship preface to the album “study of China’s man land relationship”. Geogr. Res. 37, 5–12 (2018).
Chen, H. & Zhang, J. The “dual track system” of functional area and Administrative Region: Spatial management and innovation of urban government: a case study of Nan**g City. Econ. Geogr. 37, 59–67 (2017).
Huang, N., Zhang, L. & Liu, Q. Research on the theory of urban functional Zoning based on the concept of sustainable development. Urban Dev. Res. 34, 62–65 (2009).
**ng, H. & Meng, Y. Measuring urban landscapes for urban function classification using spatial metrics. Ecol. Indic. 108, 105722 (2020).
Song, Y., Merlin, L. & Rodriguez, D. Comparing measures of urban land use mix. Comput. Environ. Urban Syst. 42, 1–13 (2013).
Wandl, A. & Hausleitner, B. Investigating functional mix in Europe’s dispersed urban areas. Environ. Plan. B-Urban Anal. City Sci. 48(9), 2862–2879 (2021).
Santos, F. YDd., Aparecida, P. M. & Aparecida, D. G. Urban regeneration in the light of social innovation: A systematic integrative literature review. Land Use Policy 113, 105873 (2022).
Motieyan, H. & Azmoodeh, M. Mixed-use distribution index: A novel bilevel measure to address urban land-use mix pattern (A case study in Tehran, Iran). Land Use Policy 109, 105724 (2021).
Li, J. et al. Research on land reserve intelligent decision system and application supported by spatiotemporal big data. China Land Sci. 33, 10 (2019).
Yao, Y. et al. Sensing spatial distribution of urban land use by integrating points-of-interest and google Word2Vec model. Int. J. Geogr. Inf. Sci. 31, 825–848 (2017).
Wang, C. & Ding, Y. YanhaoUrban functional area identification based on OSM road network and POI data. Geogr. Geogr. Inf. Sci. 4, 57–63 (2020).
Long, Y. & Shen, Z. Geospatial analysis to support Urban planning in Bei**g (Springer, London, 2015).
Zhai, W. et al. Beyond Word2vec: An approach for urban functional region extraction and identification by combining Place2vec and POIs. Comput. Environ. Urban Syst. 74, 1–12 (2019).
Jiang, S., Alves, A., Rodrigues, F., Ferreira, J. Jr. & Pereira, F. C. Mining point-of-interest data from social networks for urban land use classification and disaggregation. Comput. Environ. Urban Syst. 53, 36–46 (2015).
Hu, S. et al. A framework for extracting urban functional regions based on multiprototype word embeddings using points-of-interest data. Comput. Environ. Urban Syst. 80, 101442 (2020).
Zhao, G. & Song, J. Method improvement of mixed measurement of urban land use function. J. Urban Plan. 01, 51–58 (2022).
Li, J., Fu, Y., Li, J. & Guo, L. Some thinking on sustainability of residential district planning. Urban Plan. Forum 1, 90–95 (2008).
Hu, X., Li, X. & Wei, F. Study on the identification of urban functional areas and their mixing degree based on POI: A case study of Chongqing core city. J. Southwest Univ. 43(01), 164–173 (2021).
Li, M., Ma, Y., Sun, X., Wang, J. & Dang, A. Identification and evaluation of urban function mixing degree based on spatiotemporal entropy of multi-source data. Urban Plan. 42, 97–103 (2018).
Li, Y., Liu, C. & Li, Y. Identification of Urban functional areas and their mixing degree using point of interest analyses. Land 11, 996 (2022).
Sui, H., Yang, X., Xu, S. & Zhou, D. Urban functional space renewal research progress and key directions in the new era. Trop. Geogr. 40, 11 (2020).
Gao, S., Janowicz, K. & Couclelis, H. Extracting urban functional regions from points of interest and human activities on location-based social networks. Trans. GIS 21(3), 446–467 (2017).
Chen, X. & Duan, J. What they talk about when they talk about urban regeneration: Understanding the concept `urban regeneration’ in PRD China. Cities 130, 103880 (2022).
Wang, H. Research on the evolution and optimization of urban functional spatial structure based on multi-source data Master thesis, China University of Geosciences, (2021).
Chi, J., Jiao, L., Dong, T., Gu, Y. & Ma, Y. Quantitative identification and visualization of urban functional areas based on POI data. Geogr. Inf. Surv. Mapp. 41, 68–73 (2016).
Ran, Z., Zhou, G., Wu, J., Tang, C. & Yuan, Z. Spatial pattern of life service industry in Changsha based on POI data. World Geogr. Res. 28, 163–172 (2019).
Chen, W., Liu, L. & Liang, Y. Hot spot identification and business agglomeration characteristics analysis of Guangzhou retail business center based on POI data. Geogr. Res. 35, 703–716 (2016).
Lu, C. et al. Map** urban spatial structure based on poi (point of interest) data: A case study of the central city of Lanzhou China. ISPRS Int. J. Geo-Inf. 9, 92 (2020).
Gao, Y., **ng, H. & Zhang, H. Analysis of urban spatial structure in the coupling relationship between noctilucent remote sensing and POI data: a case study of Shenzhen. J. Guilin Univ. Technol. 11, 122–130 (2022).
Zhao, D. et al. Simulation and prediction of land use evolution based on Ca Markov model. J. Agric. Mach. 47, 278–285 (2016).
Rahman, M. T. U. & Ferdous, J. Spatio-temporal variation and prediction of land use based on CA-Markov of southwestern coastal district of Bangladesh. Remote Sens. Appl.: Soc. Environ. 24, 100609 (2021).
Firozjaei, M. K., Sedighi, A., Argany, M., Jelokhani-Niaraki, M. & Arsanjani, J. J. A geographical direction-based approach for capturing the local variation of urban expansion in the application of CA-Markov model. Cities 93, 120–135 (2019).
Fu, F., Deng, S., Wu, D., Liu, W. & Bai, Z. Research on the spatiotemporal evolution of land use landscape pattern in a county area based on CA-Markov model. Sustain. Cities Soc. 80, 103760 (2022).
**ng, R., Ma, A., Zhang, X., Yu, X. & Ma, B. Dynamic simulation of land use change in Qingdao based on logistic CA Markov model. Soil Water Conserv. Res. 21, 111–114 (2014).
Tan, Y. & Wu, C. Study on information entropy differentiation of regional land use structure. J. Nat. Res. 18, 112–117 (2003).
Huang, H., Zou, C. & Chen, X. Information entropy analysis of land use structure in Liwan District of Guangzhou city. J. Jiangxi Agric. Univ. 027, 139–142 (2005).
Qiu, L., Yu, P. & Ma, H. Urban vitality area identification and driving factors evaluation based on multi-source data: A case study of Shanghai. Sci., Technol. Eng. 22(3), 1173–1182 (2022).
Fan, W., **e, J., Wang, H., Liu, X. & Liu, H. Research on urban functional zoning structure of **an Based on big data. J. Shandong Jianzhu Univ., 36–43 (2019).
Dou, W. Research on the evolution and optimization of urban functional spatial structure based on multi-source data Master thesis, Shandong Normal University, (2021).
Yu, M., Li, J., Lv, Y., **ng, H. & Wang, H. Functional area recognition and use-intensity analysis based on multi-source data: A case study of **an China. ISPRS Int. J. Geo-Inf. 10(10), 640 (2021).
Hao, F. Research on the urban functional spatial structure of Changchun from the perspective of polycentric Doctoral thesis, Northeast Normal University, (2017).
Yang, X., Zheng, X.-Q. & Chen, R. A land use change model: Integrating landscape pattern indexes and Markov-CA. Ecol. Model. 283, 1–7 (2014).
Gao, Y. Research on the spatial structure of urban functions in **an based on POI data (Shandong Normal University, 2022).
Acknowledgements
This research was funded by the National Natural Science Foundation of China (Grant No. 42201471), Bei**g Municipal Social Science Foundation (Grant No. 2022YJC264), the Fundamental Research Funds for the Central Universities, and the Research Funds of Renmin University of China (Grant No.22XNF010) and Key Program of National Natural Science Foundation of China (Grant No.72033005).
Author information
Authors and Affiliations
Contributions
Initial idea and research plan were provided by M.Z. and X.Z.. Material preparation, data collection and analysis were per formed by H.W., M.Z. and Y.S. The first draft of the manuscript was written by M.Z. and all authors commented on previous versions of the manuscript. The figures in this article were edited and painted by Y.S. M.Z. contributed more to the revision of the manuscript. M.Z. and X.Z. provided project support.
Corresponding author
Ethics declarations
Competing interests
The authors declare no competing interests.
Additional information
Publisher's note
Springer Nature remains neutral with regard to jurisdictional claims in published maps and institutional affiliations.
Rights and permissions
Open Access This article is licensed under a Creative Commons Attribution 4.0 International License, which permits use, sharing, adaptation, distribution and reproduction in any medium or format, as long as you give appropriate credit to the original author(s) and the source, provide a link to the Creative Commons licence, and indicate if changes were made. The images or other third party material in this article are included in the article's Creative Commons licence, unless indicated otherwise in a credit line to the material. If material is not included in the article's Creative Commons licence and your intended use is not permitted by statutory regulation or exceeds the permitted use, you will need to obtain permission directly from the copyright holder. To view a copy of this licence, visit http://creativecommons.org/licenses/by/4.0/.
About this article

Cite this article
Zheng, M., Wang, H., Shang, Y. et al. Identification and prediction of mixed-use functional areas supported by POI data in **an City of China. Sci Rep 13, 2913 (2023). https://doi.org/10.1038/s41598-023-30140-x
Received:
Accepted:
Published:
DOI: https://doi.org/10.1038/s41598-023-30140-x
- Springer Nature Limited
This article is cited by
-
Spatial distribution characteristics and causes of public sports venues in China
Scientific Reports (2023)