

Abstract
Guanine-rich DNA sequences occur throughout the human genome and can transiently form G-quadruplex (G4) structures that may obstruct DNA replication, leading to genomic instability. Here, we apply multi-color single-molecule localization microscopy (SMLM) coupled with robust data-mining algorithms to quantitatively visualize replication fork (RF)-coupled formation and spatial-association of endogenous G4s. Using this data, we investigate the effects of G4s on replisome dynamics and organization. We show that a small fraction of active replication forks spontaneously form G4s at newly unwound DNA immediately behind the MCM helicase and before nascent DNA synthesis. These G4s locally perturb replisome dynamics and organization by reducing DNA synthesis and limiting the binding of the single-strand DNA-binding protein RPA. We find that the resolution of RF-coupled G4s is mediated by an interplay between RPA and the FANCJ helicase. FANCJ deficiency leads to G4 accumulation, DNA damage at G4-associated replication forks, and silencing of the RPA-mediated replication stress response. Our study provides first-hand evidence of the intrinsic, RF-coupled formation of G4 structures, offering unique mechanistic insights into the interference and regulation of stable G4s at replication forks and their effect on RPA-associated fork signaling and genomic instability.
Introduction
The human genome contains 370,000–700,000 repetitive guanine-rich sequences that have the potential to spontaneously fold into stable G-quadruplex (G4) structures under physiological conditions1,2. These non-canonical DNA secondary structures are formed by the stacking of several G-quartets, which are square planar structures formed by four guanine bases stabilized through Hoogsteen hydrogen-bonding. Several G-quartets stack on top of one another to form a four-stranded helical G4 structure that is further stabilized by monovalent cations such as K+ and Na+ 3,4,5,6. G4 structures have been proposed to serve as regulatory elements for DNA replication, transcription, and telomere regulation7,8,9,10, yet their existence has also been linked to mutagenesis11,12,13,14. In particular, many of the identified G4-motifs were mapped within oncogenes, as well as point mutations, translocation breakpoints, indels, and copy number variations that are frequently found in cancers15,16, leading to the hypothesis that deregulated G4 formation may act as physical obstacles for DNA metabolisms such as replication. However, our knowledge of and mechanistic insights into the occurrence and regulation of G4s, as well as their effects on the replication machinery, remain nominal.
The conceivable biological significance of G4s has made them an important area of research and a potentially tractable therapeutic target17,18. Nevertheless, understanding the effects of these structures in vivo has been challenging because their formation can be highly dynamic and transient, thus requiring the development of targeted reporter assays. Recent efforts used to study the effects of G4s on replication include the use of replicating plasmids with G4 sequences, monitoring genomic instability at specific genomic loci that contain putative G4-motifs, the use of reporter assays, and genome wide deep-sequencing13,14,19,20. These approaches identified important in vivo regulatory roles of both G4 motifs as well as various G4-interacting proteins and helicases, demonstrating that persistent and/or deregulated G4s pose an impasse to replication fork progression, causing genetic and epigenetic instability15,21. Recent development of antibodies and ligands to probe for G4s have provided compelling visual evidence of their formation in vivo22,23. Importantly, the amount of G4s was found to be elevated in various human cancer cell lines particularly in S phase22,23. These observations suggest that transient unpackaging of chromatin and exposure of ssDNA during replication could be conducive to G4 formation, hence posing a moment of heightened replisome vulnerability24,25,26,27. Despite these studies, we still lack direct evidence as to the formation of replication fork (RF)-coupled G4, which are hypothesized to spontaneously occur during replication of the numerous endogenous G4 motifs within our genome. Consequently, we have a poor understanding regarding how these structures directly affect replication fork activity, morphology, and signaling in vivo. This is, in part, due to previous technical limitations in the ability to visualize transient RF-coupled G4s in vivo.
To address this knowledge gap, we utilized multi-color single-molecule localization microscopy (SMLM) for direct, nanoscopic visualization of replication factors, nascent DNA, and G4s in cells. To obtain an unbiased quantitative classification of the spatial patterns of different molecular complexes resolved within each cell, we developed a robust SMLM image data mining algorithm28,29. We utilized this method to quantify the association of G4s with individual replisomes, and observed the formation of G4s at a subset of active replication forks that is further enhanced by the induction of helicase-polymerase uncoupling. Formation of G4s within replisomes imposes distinct replication dynamics, impeding DNA polymerase progression and hindering the recruitment of Replication Protein A (RPA), a ssDNA-binding protein essential for replication stress signaling. Suppression and resolution of RF-coupled G4 formation is mediated via the collaboration between replication-associated helicase FANCJ and RPA; without FANCJ helicase activity, local accumulation of stable G4s at forks dampens RPA-mediated replication stress signaling, culminating in DNA damage at corresponding replication forks. Our single-molecule fluorescence resonance energy transfer (smFRET) assays further identified the interplay between FANCJ and RPA, in which FANCJ helicase activity facilitates the loading of RPA onto thermodynamically stable G4 structures that are otherwise refractory to RPA binding. Collectively, our results provide a novel mechanistic understanding of the formation, consequence and regulation of stable G4s that form during DNA synthesis in the context of replisome organization and dynamics, as well as replication fork protection and signaling.
Results
Quantitative single-molecule localization of RF-coupled G4s in cells
To visualize individual replisome complexes and their association with DNA G4 structures in cells, we utilized recently established multi-color SMLM imaging protocols30,31 wherein samples were labeled with photoswitchable dyes. We pulse-labeled nascent DNA with the thymidine analog 5-ethynyl-2′-deoxyuridine (EdU), and co-stained with antibodies against the replicative helicase MCM, DNA polymerases processivity factor PCNA (Fig. 1a) or DNA G4 (Fig. 1d) (see antibody validation in Supplementary Note 1). We then selected EdU-positive, S phase nuclei for imaging. In contrast to blurry images typically obtained from diffraction-limited microscopy, the enhanced single-molecule detection sensitivity of SMLM provided nanoscale localization and resolution of the labeled molecules, with images representing the molecular coordinates of all localized molecules (Fig. 1a, d).
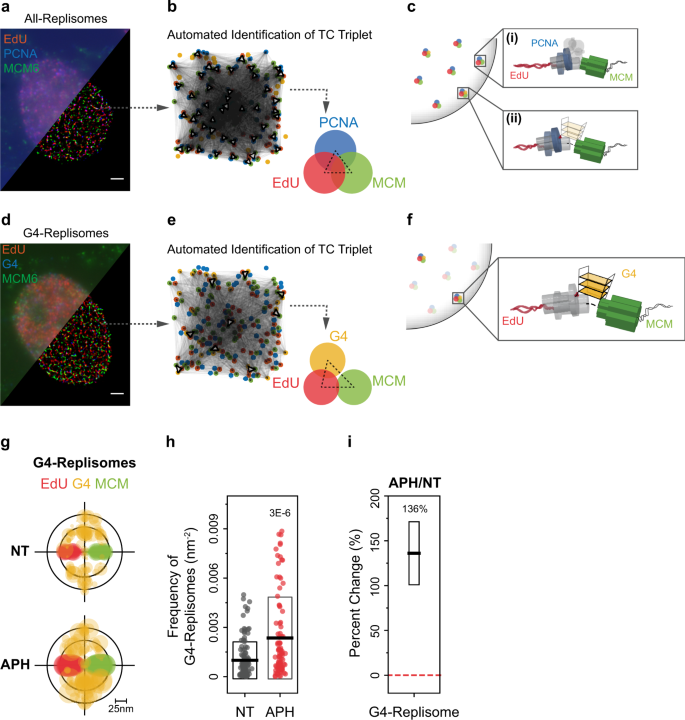
a, d Representative epifluorescence (upper left) and SMLM (lower right) images of a single S-phase U2OS nucleus labeled for a nascent DNA (using EdU, red), PCNA (blue), and MCM (green); and d nascent DNA (using EdU, red), G4 (blue), and MCM (green). Scale bar, 2 µm. b, e Schematic illustrations of how TC analysis recognizes triplet patterns from a nucleus. Each red, blue (yellow for G4), and green molecules can form triangles (connected by pale gray lines). If a specific pattern is repeatedly found (dark, bold triangles), its population is distinct from stochastic triplets and therefore is identified as a TC triplet, as shown on right. b shows the TC triplet derived from a, while e shows the TC triplet derived from d. c, f Schematic illustrations of the molecular organizations of “All-Replisome” (without (i) or with (ii) G4 association) resolved by TC analysis of EdU, PCNA, and MCM, as represented in a and b (c), and “G4-Replisome” resolved by TC analysis of EdU, G4, MCM, as represented in d and e (f). g Overlaid TC triplets of EdU, G4, and MCM from multiple non-treated (NT) or 1 h, 200 nM APH-treated cells statistically describe the molecular organization of these three species. Circle size of each TC triplet represent the frequency of G4-Replisomes from a single nucleus. The TC triplets are aligned onto the same EdU-MCM plane to define the positions of G4s relative to the replisome complex. h Frequency of G4-Replisomes in NT or APH-treated cells. Individual data points represent result from single cell. Black horizontal line and box height indicate mean ± SD. Values on graph indicate p-values of unpaired two-sample t-tests between NT and APH-treated cells. i Percent change in frequency of G4-Replisomes in APH-treated compared to NT cells. Values on the graph and black horizontal line represent the percent change, box height indicates the propagated s.e.m. For all experiments, number of cells analyzed and TC triplets identified are listed in Supplementary Table 1.
To estimate the frequency of replication sites that encounter G4 structures, we first measured the fraction of PCNA foci that are non-randomly colocalize with G4s by utilizing quantitative SMLM clustering (density-based spatial clustering of applications with noise (DBSCAN)) and colocalization (nearest neighbor distance (NND)) approaches32. This revealed that a small, yet statistically significant, subset (~2.24%) of the observed replication sites form G4 structures (Supplementary Fig. 1j, Supplementary Note 2). We next sought to resolve the specific molecular arrangement of G4s at replication forks, and to examine how their formation affects the organization and dynamics of individual replisomes. We noted that although the improved resolution (10–20 nm) of SMLM allows for localization of individual replisome components15,27. Nevertheless, much of our knowledge of these encounters is based on studies of replication at specific genomic loci that are known to contain G4s, whereas the RF-coupled formation of G4s, which was hypothesized to frequently and spontaneously occur as replication forks progress through the multiple G4-forming motifs that are widely distributed throughout the genome, have not been addressed. This is because methodologies for monitoring the transient occurrence of such structures, as well as their association with, and influence on, replication machinery at high resolution in intact cells has not been realized.
Our multi-color SMLM platform coupled with TC image data-mining approach28,29 provide nanoscale quantitative map** of the spatial-association between endogenous replisome complexes and G4s within intact single cells. Using this approach, we directly visualized the RF-coupled formation of G4 structures and have defined the spatial configurations of these events. We find that these G4s are predominately positioned between the MCM helicase and nascent DNA, indicating that G4s form at newly unwound ssDNA prior to nascent DNA synthesis. The formation of G4s within replisomes locally obstruct replication fork progression and impede RPA ssDNA protection. We further show that mild inhibition of the replicative polymerases by APH, which induces helicase-polymerase uncoupling and ssDNA exposure52, increases the frequency of RF-coupled formation of G4s. Importantly, G4-Replisomes induced by APH treatment exhibit the same distinct behavior as the G4-Replisomes observed in untreated cells. We conclude that transient, RF-coupled G4 formation that occurs during normal replication is likely to cause brief fork uncoupling events, and therefore requires continuous and timely regulation.
Of particular significance is our observation that the formation of G4-Replisomes precludes the binding of RPA. MCM unwinding of parental DNA during replication exposes ssDNA especially on the lagging strand, which is rapidly coated and protected by RPA15. Although our approach cannot distinguish between G4s that form at the leading strand and those at the lagging strand, we found that RF-coupled formation of G4s consistently exhibit resistance to RPA recruitment, even upon APH-induced fork uncoupling. Previous in vitro studies have shown that RPA could bind and unfold G4 structures48,49, suggesting that RPA could play a direct role in counteracting these structures during replication. However, a study using smFRET assays has systematically characterized the binding and unfolding ability of RPA on diverse G4 structures, and showed that the more thermodynamically stable G4s, including the ones with shorter ssDNA loop lengths, are remarkably resistant to RPA binding in vitro50. Intriguingly, it was recently shown that G4 motifs with loop size of 1-nucleotide are significantly prevalent in the human genome51 and that they contribute to genomic instability53. We therefore hypothesized that in cells the more stable RF-coupled G4s cannot be unfolded by RPA alone, and thus need to be resolved by additional factors in order to maintain normal replication fork progression.
A growing list of human helicases, including FANCJ, BLM, WRN, PIF1, and RTEL1 have been shown to have G4-specific activities, with the abilities to unwind G4 DNA structures in vitro, along with roles in maintaining genome integrity15. The FANCJ helicase38, whose mutations are associated with a rare subtype of Fanconi anemia54,55 as well as early-onset breast and ovarian cancers56, have been proposed to participate in the maintenance of replication integrity. Several studies have outlined the importance of FANCJ in G4 regulation, presumably during replication, in model organisms, with deficiencies in FANCJ homologs leading to hypersensitivity to G4-stabilizing ligands, resulting in reduced replication39,40, impaired cell proliferation, DNA damage induction, and elevated apoptosis20. Here, we provide direct evidence pertaining to the role of FANCJ in regulating RF-coupled formation of G4 structures. Our data revealed an increased frequency in stable G4s at replication forks upon FANCJ depletion or inactivation, which prevents RPA from loading onto these sites, leading to DNA damage that is specifically localized at G4-Replisomes. Importantly, the suppression of RPA binding at the damaged G4-Replisomes also corresponds to defective replication fork signaling via pRPA, in agreement with previous studies showing that loss of FANCJ inhibits RPA-ATR signaling57,58, and that the inability of RPA to bind repetitive DNA sequences can suppress ATR checkpoint control46,59,60,61. The close cooperation between RPA and FANCJ in resolving stable G4s is further realized via our in vitro smFRET measurements, which show that FANCJ helicase activity is required for loading RPA onto stable short-loop G4s, which are otherwise resistant to RPA binding. These results also offer insights into previous studies wherein RPA was shown to stimulate the unwinding activity of FANCJ20,47. Given the variety of specialized G4 helicases and the known associations amongst some of them19, as well as with RPA62,63, it is likely that there is at least a partial redundancy in the roles of these helicases in assisting the RPA-mediated resolution of RF-coupled G4 formation like that observed for FANCJ. Indeed, a recent study in the Saccharomyces cerevisiae model system demonstrated that replication through G-rich minisatellites is enabled via a cooperation between RPA and the G4 helicase Pif163. Further studies into the mechanisms governing RF-coupled G4 resolution in human cells are needed to clarify the specific contribution of different factors to these pathways.
Together, our findings demonstrate that DNA G4 structures normally form at a subset of replisomes upon unwinding of parental DNA, altering their replication behavior. In the case of perturbed replication, when G4s formed at replication forks are not properly resolved, these persistent G4s could lead to genomic instability. Our study provides novel mechanistic insights whereby the resolution of stable RF-coupled G4s depends on a collaboration between RPA and FANCJ, which also facilitates proper signaling and related replication stress response at these replisomes. We propose the following model, as illustrated in Fig. 6d: RF-coupled G4 formation induces local and temporary helicase-polymerase uncoupling events. Generally, replication fork uncoupling will result in RPA accumulation, RPA-mediated ATR activation and replication stress response46. While RPA can readily bind and destabilize some G4s, the more stable G4s cannot be unfolded by RPA alone and therefore will be inhibitory to RPA-mediated signaling. These G4s need to be destabilized by the FANCJ helicase to facilitate the subsequent loading of RPA, thereby maintaining DNA synthesis and proficient ATR replication stress response at these forks. Accordingly, loss of FANCJ results in a failure of timely removal of RPA-resistant, stable G4s at forks, leading to DNA damage accumulation along with defective replication stress signaling. The combination of persistent DNA lesions and suppressed signaling would have major mutagenic consequences that could explain why G4 motifs are frequently associated with genomic rearrangements in cancer genomes64,65.
Methods
Cell culture and drug treatments
U2OS cells (ATCC HTB-96) and Human cells Human cervix epithelioid carcinoma Flp-In T-REx (HeLa FIT) cells44,66 were cultured in Dulbecco’s modified Eagle’s medium (DMEM) (ThermoFisher 11965) with 10% fetal bovine serum (Gemini Bio., 100-106) and 1% Pen-Strep (ThermoFisher, 15140) inside a 37°C incubator at a 5% CO2-containing atmosphere. For all imaging experiments, cells were trypsinized and seeded on glass coverslips (Fisher Scientific, 12-548-B) in six-well plates at low density and allowed to attach. Drug treatments and/or siRNA transfection were performed directly on cells on coverslips.
To investigate the effects of aphidicolin on G4 formation and association with the replisome in S-phase cells, fully attached cells were arrested to G0/G1 phase using serum starvation for 72 h. Cells were subsequently released in complete medium for a further 16 h to produce a predominantly early/mid-S phase cell population. Cells were then treated with different concentrations of APH (Abcam, 142400) for 1 h before analyses. The specific concentrations of APH are indicated accordingly in the text or in the figure legends.
To investigate the mechanisms of G4 regulation in cells, siRNA transfected cells were treated with 20 μM PDS (Sigma, SML0678) for 1, 4, or 24 h before analyses. The specific durations of PDS treatment are indicated accordingly in the text and/or in the figure legends. We emphasize that the addition of PDS only increases the melting temperature (thermostability) of already folded native G4s66,67,68, resulting in a slight enrichment in the frequency of stable native G4s at forks, and provided improved in situ probing of their presence, effects, and regulations on replication forks.
FANCJ knockout
siRNAs reverse transfections were performed using Lipofectamine RNAiMax (ThermoFisher) following the manufacturer’s instructions. SMLM experiments were done 72 h after transfection. Knockdown efficiency was confirmed via Western blot analysis (Fig. S8). The siRNAs used in this study are:
FANCJ: 5′-TAGATAGTATGGTCAACAATA-3′ (QIAGEN, Hs_BRIP1_6, SI03110723)
CONTROL: 5′-AATTCTCCGAACGTGTCACGT-3′ (QIAGEN 1027310)
Details of CRISPR-mediated FANCJ knockout (FANCJ-KO) HeLa cell-line with or without wild-type FANCJ (FANCJ-WT) or a helicase-dead FANCJK52R (FANCJ-HD) complementation were described previously44.
Permeabilization and fixation
An optimized permeabilization and fixation protocol were used to remove the majority of the cytoplasm and non-chromatin bound proteins in order to minimize nonspecific antibody labeling, which could significantly contribute to the noise for image analysis. Cells were permeabilized with 0.5% Triton X-100 in ice-cold CSK buffer (10 mM Hepes, 300 mM Sucrose, 100 mM NaCl, 3 mM MgCl2, pH = 7.4) for 10 min at room temperature. Following pre-extraction, cells were washed once with PBS, then fixed in 3.7% paraformaldehyde (Electron Microscopy Sciences, 15714) in PBS for 30 min at room temperature. Cells were then washed twice with PBS and blocked with blocking buffer (2% glycine, 2% BSA, 0.2% gelatin, and 50 mM NH4Cl in PBS) at least overnight at 4°C prior to immunofluorescence staining and imaging.
Immunofluorescence labeling
For nascent DNA detection, cells were treated with 10 μM EdU for 15 min before fixation, so that EdU only incorporates into newly synthesized DNA in S-phase cells through endogenous replication. Incorporated EdU was labeled using Click-iT™ Plus EdU Alexa Fluor™ 647 Imaging Kit (ThermoFisher, C10640) after fixation. DNA G4, MCM, PCNA, RPA, and γH2AX were labeled either directly by Alexa Fluor-conjugated primary antibodies in blocking buffer for 1 h, or indirectly using primary antibodies for 1 h, then Alexa Fluor secondary antibodies for 30 min. All staining steps were done at room temperature. All antibodies used in IF studies are listed in Supplementary Table 2.
SMLM imaging
After immunofluorescence staining, coverslips with fixed cells were mounted on microscope glass slides with freshly prepared SR imaging buffer (1 mg/mL glucose oxidase (Sigma, G2133), 0.02 mg/mL catalase (Sigma, C3155), 10% glucose (Sigma, G8270), 100 mM mercaptoethylamine (Fisher Scientific, BP2664100) in PBS, pH = 8) flowed through.
All raw SMLM-SR images were acquired using a custom-built optical imaging platform based on a Leica DMI 300 inverse microscope. 750 nm (UltraLaser, MDL-III-750-500), 639 nm (UltraLaser, MRL-FN-639-800), 561 nm (Cobolt), 488 (OBIS) laser lines were adjusted to 1.5, 0.8, 1.0, 0.8 kW/cm2, respectively. The laser lines were combined using appropriate dichroic and focused onto the back aperture of an HCX PL APO 63X NA = 1.47 OIL CORR TIRF (Zeiss) Objective via a multi-band dichroic (FF408/504/581/667/762-Di01). To increase power density and limit out-of-plane fluorescence, a Highly Inclined and Laminated Optical (HILO) illumination configuration was achieved by translating the excitation beam laterally across the back aperture of the objective. Fluorescence emission was expanded with a 2X lens tube, corrected by a chromatic aberration correction lens (Thorlabs, AC254-300-A), and was collected on a sCMOS camera (Photometrics, Prime 95B). Fluorescence signals were collected sequentially using the corresponding single-band pass filters in a filter wheel (ThorLabs, FW102C): AF750 (Semrock, FF02-809/81), AF488 (Semrock, FF01-531/40), AF647 (Semrock, FF01-676/37), AF568 (Semrock, FF01-607/36). A 405 nm laser line (MDL-III-405-150, CNI) was introduced to enhance recovery of dark state fluorophores when required. 2000 Frames at 33 Hz were acquired for each color. Image acquisition was done using the Micro-Manager (v1.4) software.
Map** and alignment of images from different colors
Map** among different channels for multi-color imaging was carried out using a polynomial morph-type map** algorithm in order to correct the chromatic aberrations caused by the varying diffraction behaviors of different wavelength emissions29. Before each experiment, a calibration map was generated by imaging spatially separated fluorescent beads (ThermoFisher, T-7279) in each of the four channels. A 2nd polynomial function was optimized to fit the localizations of the beads in each of the AF750, AF568, and AF488 channels to their locations in the AF647 channel. This optimized 2nd polynomial function is then used to map the molecular localizations of the experimental samples in each of AF750, AF568, AF488 channels to the AF647 channel.
Single-molecule localization
Each frame of the raw image stack was firstly box-filtered with a box size of 4 times of the FWHM of a 2D Gaussian PSF. Note that each pixel of the image was weighted by the inverse of its pre-calibrated variance during the box-filtering69. The low-pass filtered image was then extracted from the raw image for rough local maxima recognition and localization. All the 7 × 7 pixel regions around all the local maxima from all frames of the image stack were then submitted for 2D-Gaussian multi-PSF fitting70, which is performed by GPU (Nvidia GTX 1060, CUDA 8.0) using the Maximum Likelihood Estimation (MLE) algorithm. In brief, the likelihood function of each pixel was built by the convolution of (1) the Poisson distribution of the shot noise from the photons emitted from fluorophores nearby and (2) the gaussian distribution of the inherent read-out noise of each pixel pre-calibrated as mentioned above. The fitting accuracy was then estimated by Cramér-Rao lower bound (CRLB), and the distribution of the accuracy of all sequential localizations were fitted into a skew-Gaussian distribution. Any localizations appearing in consecutive frames within 2.5 times of the localization precision were considered as one blinking event. Such localizations were weighted by the inverse of its own CRLB determined variance and averaged into one localization in order to minimize overcounting during Auto-PC computation. For display purpose, the representative images were generated by rendering the raw coordinates into 10 nm pixel canvas and convolved with a 2D-Gaussian (σ = 10 nm) kernel.
Triple-correlation function
Details of the TC algorithm were described previously28,29. Briefly, the TC Function is defined as Eq. (1),
where \({\left\langle {\rho }_{i}\left({\bf{R}}\right)\right\rangle }_{{\bf{R}}}\) denotes the average density of the detections from the ith of the three-color channels within the Region-Of-Interests (ROI, a ~6 × 6 μm2 square at the center of the 3-color SMLM image of a nucleus) and \(\delta {\rho }_{i}\left({\bf{R}}\right)={\rho }_{i}\left({\bf{R}}\right)-{\left\langle {\rho }_{i}\left({\bf{R}}\right)\right\rangle }_{{\bf{R}}}\) denotes the local density fluctuation at \({\bf{R}}\). The implementation of the TC to define any significant TC triplets is illustrated in Supplementary Note 3.
Estimation of the local density within a TC triplet pattern via TC Function
\({\left\langle \delta {\rho }_{1}\left({\bf{R}}\right)\delta {\rho }_{2}\left({\bf{R}}{\boldsymbol{+}}{{\bf{r}}}_{{\boldsymbol{1}}}\right)\delta {\rho }_{3}\left({\bf{R}}{\boldsymbol{+}}{{\bf{r}}}_{{\boldsymbol{2}}}\right)\right\rangle }_{{\bf{R}}}\) defines, on average, the product of the local density of the three species within a triplet pattern \(\triangle \left({{\bf{r}}}_{{\bf{1}}},{{\bf{r}}}_{{\bf{2}}}\right)\), while \({\left\langle \delta {\rho }_{1}\left({\bf{R}}\right)\delta {\rho }_{2}\left({\bf{R}}{\boldsymbol{+}}{{\bf{r}}}_{{\boldsymbol{1}}}\right)\right\rangle }_{{\bf{R}}}\) stands for the average product of the two species correlating at \({{\bf{r}}}_{{\bf{1}}}\). Similar to the conditional probability, the local density of the third species within the triple-pattern is therefore estimated as the ‘conditional’ local density at \({{{\bf{r}}}_{{\bf{2}}}-{\bf{r}}}_{{\bf{1}}}\) given a pair correlating at \({{\bf{r}}}_{{\bf{1}}}\) (2):
Such local density within a triplet pattern is validated via simulations in Supplementary Note 3.
Computation of TC
Since SMLM data consists of coordinates other than intensity values at each pixel across the entire image canvas, we directly calculated the TC as its definition (1) by visiting each coordinate in the first channel, and calculated \(\delta {\rho }_{2}\left({{\bf{r}}}_{{\boldsymbol{1}}}\right)\) and \(\delta {\rho }_{3}\left({{\bf{r}}}_{{\boldsymbol{2}}}\right)\) in the second and third channels at \({{\bf{r}}}_{{\boldsymbol{1}}}\), and \({{\bf{r}}}_{{\boldsymbol{2}}}\) displaced from the visited coordinate, respectively. Moreover, since the triplets are randomly oriented in the ROI, the TCF at \({{\bf{r}}}_{{\boldsymbol{1}}}=\left({r}_{1},\theta \right),{{\bf{r}}}_{{\boldsymbol{2}}}=\left({r}_{2},\theta +{\boldsymbol{\triangle }}\theta \right)\) was averaged along \(\theta \in \left[-\pi ,\pi \right]\), and \(f\left({{\bf{r}}}_{{\boldsymbol{1}}},{{\bf{r}}}_{{\boldsymbol{2}}}\right)\) was thus transformed to \(f\left({r}_{1},{r}_{2},{r}_{3}\right)\) where \({r}_{3}^{2}={r}_{1}^{2}+{r}_{2}^{2}+2{r}_{1}{r}_{2}{{\cos }}{{\triangle }}\theta\).
Auto-Correlation (AC)
For AC analyses, a ~6 × 6 \({{\rm{\mu }}{\rm{m}}}^{2}\) square at the center of each SMLM imaged nucleus were cropped and submitted to the Auto-PC function (3).
Note that artificial blinking events were eliminated by averaging the localizations appearing in consecutive frames within 2.5 times of the localization precision as discussed above. The output correlation profile \(g\left(r\right)\) was plotted as the function of pair-wise distances \(r\), and fitted into a two Gaussian model as Eq. (4):
where \(\sigma\) and \(\left\langle \rho \right\rangle\) denotes the localization precision and the averaged density of the examined protein within the 6 × 6 \({{\rm{\mu }}{\rm{m}}}^{2}\) square (termed as the ‘global density’), respectively. Each focus was modeled as a Gaussian distribution and the second term in Eq. (4) is its auto-correlation form that convoluted with the stochastic sampling (the first term). \(A\) is proportional to the average probability of finding molecules around each other and \({r}_{{\rm{app}}}\) stands for the average sigma radius of the Gaussian modeled focus. The averaged molecular content \(\left\langle N\right\rangle\) of each focus within such 6 × 6 \({{\rm{\mu }}{\rm{m}}}^{2}\) square was then calculated as Eq. (5).
Recombinant protein expression and purification
FANCJ expression and purification were described previously44. In brief, Sf9 cells were infected with recombinant baculoviruses encoding for N-terminally Flag-tagged FANCJ WT or FANCJ HD. 48 h after infection, the cells were spun down and the pellet was lysed for 1 h in buffer A (50 mM Na2HPO4/NaH2PO4 (pH = 7.4), 150 mM NaCl, 10% glycerol, 0.01% NP-40, 0.5 mM EDTA, 1% Triton X-100) supplemented with protease inhibitors (Roche). Lysed cells were spun down and the supernatant was incubated on Flag M2 beads (Sigma-Aldrich) for 2 h at 4°C. Subsequently, the beads were washed twice with buffer B (50 mM Na2HPO4/NaH2PO4 (pH = 7.4), 150 mM NaCl, 10% glycerol, 0.01% NP-40, 0.5 mM EDTA), followed by one wash with buffer A, and one wash with buffer C (50 mM Na2HPO4/NaH2PO4 (pH = 7.4), 150 mM NaCl, 10% glycerol, 0.01% NP-40, 0.5 mM EDTA, 1%, 5 mM MgCl2,) supplemented with 5 mM ATP. Finally, the beads were washed extensively in buffer B and eluted for 1 h in buffer B containing 200 µg/ml 3× Flag peptide (Sigma-Aldrich).
RPA expression and purification were described previously71.
smFRET assays
To observe G4 unfolding using smFRET, a PEG-coated imaging surface with 50 pM DNA immobilized via biotin–Neutravidin linkage was prepared. Reaction buffer containing RPA and/or 100 pM FANCJ is then prepared at room temperature in a buffer composed of 20 mM pH = 7.5 TrisAc, 50 mM KAc, 10 mM MgAc, 0.8% (w/v) glucose, 0.5 mg/mL glucose oxidase, 0.4 μg/mL catalase, 5 mM Trolox, 1 mg/mL BSA, 1 mM ATP, and 2 mM DTT. Concentrations of RPA and/or FANCJ proteins varies and are indicated accordingly in the text or in the figure legends. The reaction was immediately flowed into the imaging chamber right before imaging acquisitions. All DNA substrates used in smFRET studies are listed in Supplementary Table 3.
Single-molecule imaging was performed on a custom-built Total-Internal Reflection Fluorescence Microscopy (TIRFM) system based on a modified inverted microscope (IX70, Olmpus) equipped with a high NA TIRF objective (PLAN APO; 100×; NA, 1.45; OIL TIRF, Olympus) as previously described72. Briefly, the microscope was coupled to 532- and 640-nm solid-state lasers to excite the sample at TIRF illumination mode for improved signal-to-noise ratio and to reject out-of-plane fluorescence. Sample emission was collected and split into two channels through a dichroic (FF660, Semrock) and emission narrow-band bandpass filters (HQ580/60 and ET690/50; Chroma) in conjunction with the use of an Optosplit II (Cairn Research) to image two colors simultaneously onto a single EMCCD camera (Andor iXon3). Movies consisting of 800 frames were acquired for analyses with each frame having an exposure of 30 ms.
smFRET trajectory analyses were performed in Matlab. Briefly, molecules were identified using custom-written-map** routines to obtain intensity vs time trajectories, followed by idealization of the trajectories and measurement of dwell times using ebFRET73. FRET efficiencies were approximated as the ratio between the acceptor intensity and the sum of acceptor and donor intensities. Each smFRET histogram was generated by a minimum of 100 trajectories from two independent experiments. The peaks corresponding to the folded and unfolded populations were fitted to two independent gaussian curves, and the area from each curve was used to calculate the unfolded fraction. The measured dwell times were fitted to single exponential decays to calculate folding (kfold) and unfolding (kunfold) values. Data collected from two independent experiments were pooled together for analysis.
SiMPull assays, imaging, and analysis
To validate that the G4 antibody 1H623 can indeed bind on DNA G4, a modified SiMPull assay was performed74. Biotin-tagged anti-mouse or anti-rabbit IgG was first immobilized to a PEG-coated quartz surface with biotin-neutravidin linkage. 1H6 antibody was then flowed into the imaging chamber, followed by the flow through of either Cy3/Cy5-labeled DNA G4 or T20 single-stranded DNA oligonucleotides. The chamber was then washed multiple times. The presence of Cy3/Cy5 signals, which indicates the capture of the DNA oligos by the antibodies, was observed and imaged using the same microscope system as smFRET experiment described above. The amount of captured oligos was then counted using ImageJ “Analyze Particles” plugin. The experiment and washes were carried out at room temperature in a buffer composed of 50 mM Tris-HCl (pH = 8.0), 2 mM MgCl2, 100 mM KCl and an oxygen scavenging system (1 mg mL−1 glucose oxidase, 0.4% (w/v) D-glucose, 0.02 mg mL−1 catalase and 2 mM Trolox). Detailed information for antibodies and DNA substrates used are listed in Supplementary Tables 2 and 3.
Colocalization analyses
To visualize the degree of colocalization between the two G4 antibodies 1H623 and BG422, each nucleus was manually outlined to generate an ROI for independent analysis. An automatic Otsu threshold75 was then applied and the clusters defined for each color for each nucleus. The extent of overlaps between the two colors were then visualized using ImageJ “AND” function. To generate a baseline of expected random colocalization, the clusters of one color were redistributed within the ROI using a Monte Carlo randomization algorithm76 and the extent of random overlaps between the two colors were visualized using the same ImageJ function. The abundance of the overlapped foci indicates significant, non-random colocalization between the two antibodies.
To further quantify the level of colocalization, we calculated the cross-correlation (Eq. (6) between 1H6 and BG4 in both experimental data and randomized data (See Fig. S3 and Fig. S4 in Chen, Y. H. et al.30 for randomization procedure).
In brief, the 1H6 and BG4 signal from the ROI of the same nucleus were submitted for co-localization test via cross-correlation, whilst the cross-correlation between 1H6 and BG4 signal from the ROIs of different nuclei served as the correlation level for two distributions that random to each other.
Fraction analysis
To determine the colocalization between PCNA and G4 foci detected in SMLM, the single-molecule localizations of both species were first submitted to home-written Density-Based Spatial Clustering of Applications with Noise (DBSCAN) algorithm for foci segmentation. The number of minimum points that could form a DBSCAN focus was set at 3 and the threshold distance was set at 15 nm. After DBSCAN segmentation, the Nearest-Neighboring Distance (NND) (edge-to-edge) between the two species were calculated and clusters that maintain an NND < = 5 nm were designated as a pair of co-localized clusters. The fraction was then calculated by dividing the number of clusters of either of the species from the number of co-localized pairs. To ensure that the detected colocalizations are non-random, the levels of colocalization were compared to random distributions, which is generated via randomly repositioning and orienting the clusters.
γH2AX imaging
To detect γH2AX signals, S-phase U2OS cells were pulsed-labeled with EdU and immuno-stained with anti-γH2AX antibody (Supplementary Table 2). After staining coverslips were mounted onto glass slides using VECTASHIELD Antifade Mounting Medium with DAPI (VectorLabs, H-1200) and imaged with a Keyence BZ-X800 microscope using the Keyence BZ-X software (Keyence). At least 300 EdU-positive cells were acquired.
Western blotting
Cells were harvested using Laemmli sample buffer (Bio-Rad) containing (final concentration) 2% SDS, 10% glycerol, 5% 2-mercaptoethanol, 0.002% bromphenol blue, and 60 mM Tris-HCl (pH ~ 6.8) and lysed by heating the samples at 95°C for 15 min. Protein extracts were calibrated and resolved by SDS-polyacrylamide gel electrophoresis on Nupage 4–12% Bis-Tris, 3–8% Tris-Acetate gels (Invitrogen), or 4–15% TGX gels (Bio-Rad) in 1 × Tris-Glycine-SDS buffer. Proteins were transferred onto polyvinylidene difluoride (PVDF) membrane (Millipore) and incubated in 5% milk in TBST for 1 h at room temperature. The membrane was then incubated with primary antibodies overnight at 4°C, followed by incubation with secondary antibodies conjugated with horseradish peroxidase for 1 h at room temperature. Blots were detected using an Enhanced Chemiluminescence Detection Kit (GE Healthcare) and were developed with a LICOR Odyssey imager. All antibodies used in WB studies are listed in Supplementary Table 2.
Reporting summary
Further information on research design is available in the Nature Research Reporting Summary linked to this article.
Data availability
All imaging and single-molecule data constitute a sizable dataset (>10TB) that cannot be reasonably maintained online. Raw data will be made available by the corresponding author upon request. Source data are provided with this paper.
Code availability
Codes for the dTC and dPC algorithms, as well as a testing demo (with simulation codes) are available at https://github.com/yiny02/direct-Triple-Correlation-Algorithm. The code is for Research and Educational Purposes for Non-Profit Academic and/or Research Institutions.
References
Huppert, J. L. & Balasubramanian, S. Prevalence of quadruplexes in the human genome. Nucleic Acids Res. 33, 2908–2916 (2005).
Chambers, V. S. et al. High-throughput sequencing of DNA G-quadruplex structures in the human genome. Nat. Biotechnol. 33, 877–881 (2015).
Gellert, M., Lipsett, M. N. & Davies, D. R. Helix formation by guanylic acid. Proc. Natl Acad. Sci. USA 48, 2013–2018 (1962).
Sen, D. & Gilbert, W. Formation of parallel four-stranded complexes by guanine-rich motifs in DNA and its implications for meiosis. Nature 334, 364–366 (1988).
Williamson, J. R., Raghuraman, M. K. & Cech, T. R. Monovalent cation-induced structure of telomeric DNA: the G-quartet model. Cell 59, 871–880 (1989).
Burge, S. et al. Quardruplex DNA: sequence, topology and structure. Nucleic Acids Res. 34, 5402–5415 (2006).
Siddiqui-Jain, A., Grand, C. L., Bearss, D. J. & Hurley, L. H. Direct evidence for a G-quadruplex in a promoter region and its targeting with a small molecule to repress c-MYC transcription. Proc. Natl Acad. Sci. USA 99, 11593–11598 (2002).
Paeschke, K., Simonsson, T., Postberg, J., Rhodes, D. & Lipps, H. J. Telomere end-binding proteins control the formation of G-quadruplex DNA structures in vivo. Nat. Struct. Mol. Biol. 12, 847–854 (2005).
Besnard, E. et al. Unraveling cell type-specific and reprogrammable human replication origin signatures associated with G-quadruplex consensus motifs. Nat. Struct. Mol. Biol. 19, 837–844 (2012).
Valton, A. L. et al. G4 motifs affect origin positioning and efficiency in two vertebrate replicators. EMBO J. 33, 732–746 (2014).
Wu, Y. & Brosh, R. M. Jr. G-quadruplex nucleic acids and human disease. FEBS J. 277, 3470–3488 (2010).
Sarkies, P., Reams, C., Simpson, L. J. & Sale, J. E. Epigenetic instability due to defective replication of structured DNA. Mol. Cell 40, 703–713 (2010).
Lemmens, B., van Schendel, R. & Tijsterman, M. Mutagenic consequences of a single G-quadruplex demonstrate mitotic inheritance of DNA replication fork barriers. Nat. Commun. 6, 8909 (2015).
London, T. B. et al. FANCJ is a structure-specific DNA helicase associated with the maintenance of genomic G/C tracts. J. Biol. Chem. 283, 36132–36139 (2008).
Lerner L. K. & Sale J. E. Replication of G quadruplex DNA. Genes 10, 95 (2019).
Maffia A., Ranise C. & Sabbioneda S. From R-Loops to G-Quadruplexes: emerging new threats for the replication fork. Int. J. Mol. Sci. 21, 1506 (2020).
Balasubramanian, S. & Neidle, S. G-quadruplex nucleic acids as therapeutic targets. Curr. Opin. Chem. Biol. 13, 345–353 (2009).
Hansel-Hertsch, R., Di Antonio, M. & Balasubramanian, S. DNA G-quadruplexes in the human genome: detection, functions and therapeutic potential. Nat. Rev. Mol. Cell Biol. 18, 279–284 (2017).
Sarkies, P. et al. FANCJ coordinates two pathways that maintain epigenetic stability at G-quadruplex DNA. Nucleic Acids Res. 40, 1485–1498 (2012).
Wu, Y., Shin-ya, K. & Brosh, R. M. Jr. FANCJ helicase defective in Fanconia anemia and breast cancer unwinds G-quadruplex DNA to defend genomic stability. Mol. Cell Biol. 28, 4116–4128 (2008).
Wang G. & Vasquez K. M. Effects of replication and transcription on DNA structure-related genetic instability. Genes (Basel) 8, 17 (2017).
Biffi, G., Tannahill, D., McCafferty, J. & Balasubramanian, S. Quantitative visualization of DNA G-quadruplex structures in human cells. Nat. Chem. 5, 182–186 (2013).
Henderson, A. et al. Detection of G-quadruplex DNA in mammalian cells. Nucleic Acids Res. 42, 860–869 (2014).
Kaguni, L. S. & Clayton, D. A. Template-directed pausing in in vitro DNA synthesis by DNA polymerase a from Drosophila melanogaster embryos. Proc. Natl Acad. Sci. USA 79, 983–987 (1982).
Woodford, K. J., Howell, R. M. & Usdin, K. A novel K(+)-dependent DNA synthesis arrest site in a commonly occurring sequence motif in eukaryotes. J. Biol. Chem. 269, 27029–27035 (1994).
Weitzmann, M. N., Woodford, K. J. & Usdin, K. The development and use of a DNA polymerase arrest assay for the evaluation of parameters affecting intrastrand tetraplex formation. J. Biol. Chem. 271, 20958–20964 (1996).
Valton, A. L. & Prioleau, M. N. G-Quadruplexes in DNA replication: a problem or a necessity? Trends Genet. 32, 697–706 (2016).
Yin, Y. & Rothenberg, E. Probing the spatial organization of molecular complexes using triple-pair-correlation. Sci. Rep. 6, 30819 (2016).
Yin, Y., Lee, W. T. C. & Rothenberg, E. Ultrafast data mining of molecular assemblies in multiplexed high-density super-resolution images. Nat. Commun. 10, 119 (2019).
Chen, Y. H. et al. ATR-mediated phosphorylation of FANCI regulates dormant origin firing in response to replication stress. Mol. Cell 58, 323–338 (2015).
Whelan, D. R. et al. Spatiotemporal dynamics of homologous recombination repair at single collapsed replication forks. Nat. Commun. 9, 3882 (2018).
Nicovich, P. R., Owen, D. M. & Gaus, K. Turning single-molecule localization microscopy into a quantitative bioanalytical tool. Nat. Protoc. 12, 453–460 (2017).
**ang, W. et al. Correlative live and super-resolution imaging reveals the dynamic structure of replication domains. J. Cell Biol. 217, 1973–1984 (2018).
Goswami, P. et al. Structure of DNA-CMG-Pol epsilon elucidates the roles of the non-catalytic polymerase modules in the eukaryotic replisome. Nat. Commun. 9, 5061 (2018).
Koundrioukoff, S. et al. Stepwise activation of the ATR signaling pathway upon increasing replication stress impacts fragile site integrity. PLoS Genet. 9, e1003643 (2013).
Veatch, S. L. et al. Correlation functions quantify super-resolution images and estimate apparent clustering due to over-counting. PLoS One 7, e31457 (2012).
Wold, M. S. Replication protein A: a heterotrimeric, single-stranded DNA-binding protein required for eukaryotic DNA metabolism. Annu. Rev. Biochem. 66, 61–92 (1997).
Cantor, S. B. et al. BACH1, a novel helicase-like protein, interacts directly with BRCA1 and contributes to its DNA repair function. Cell 105, 149–160 (2001).
Schwab, R. A., Nieminuszczy, J., Shin-ya, K. & Niedzwiedz, W. FANCJ couples replication past natural fork barriers with maintenance of chromatin structure. J. Cell Biol. 201, 33–48 (2013).
Castillo Bosch, P. et al. FANCJ promotes DNA synthesis through G-quadruplex structures. EMBO J. 33, 2521–2533 (2014).
Rodriguez, R. et al. Small-molecule-induced DNA damage identifies alternative DNA structures in human genes. Nat. Chem. Biol. 8, 301–310 (2012).
Muller, S., Kumari, S., Rodriguez, R. & Balasubramanian, S. Small-molecule-mediated G-quadruplex isolation from human cells. Nat. Chem. 2, 1095–1098 (2010).
Koirala, D. et al. A single-molecule platform for investigation of interactions between G-quadruplexes and small-molecule ligands. Nat. Chem. 3, 782–787 (2011).
Odermatt D. C. et al. Cancer-associated mutations in the iron-sulfur domain of FANCJ affect G-quadruplex metabolism. PLoS Genet. 16, e1008740 (2020).
Oakley, G. G. & Patrick, S. M. Replication protein A: directing traffic at the intersection of replication and repair. Front Biosci. 15, 883–900 (2010).
Zeman, M. K. & Cimprich, K. A. Causes and consequences of replication stress. Nat. Cell Biol. 16, 2–9 (2014).
Gupta, R. et al. FANCJ (BACH1) helicase forms DNA damage inducible foci with replication protein A and interacts physically and functionally with the single-stranded DNA-binding protein. Blood 110, 2390–2398 (2007).
Salas, T. R. et al. Human replication protein A unfolds telomeric G-quadruplexes. Nucleic Acids Res. 34, 4857–4865 (2006).
Safa, L. et al. Binding polarity of RPA to telomeric sequences and influence of G-quadruplex stability. Biochimie 103, 80–88 (2014).
Qureshi, M. H., Ray, S., Sewell, A. L., Basu, S. & Balci, H. Replication protein A unfolds G-quadruplex structures with varying degrees of efficiency. J. Phys. Chem. B 116, 5588–5594 (2012).
Puig Lombardi, E. et al. Thermodynamically stable and genetically unstable G-quadruplexes are depleted in genomes across species. Nucleic Acids Res. 47, 6098–6113 (2019).
Gorisch, S. M. et al. Uncoupling the replication machinery: replication fork progression in the absence of processive DNA synthesis. Cell Cycle 7, 1983–1990 (2008).
Piazza, A. et al. Short loop length and high thermal stability determine genomic instability induced by G-quadruplex-forming minisatellites. EMBO J. 34, 1718–1734 (2015).
Levitus, M. et al. The DNA helicase BRIP1 is defective in Fanconi anemia complementation group. J. Nat. Genet. 37, 934–935 (2005).
Litman, R. et al. BACH1 is critical for homologous recombination and appears to be the Fanconi anemia gene product FANCJ. Cancer Cell 8, 255–265 (2005).
Hiom, K. FANCJ: solving problems in DNA replication. DNA Repair 9, 250–256 (2010).
Gong, Z., Kim, J. E., Leung, C. C., Glover, J. N. & Chen, J. BACH1/FANCJ acts with TopBP1 and participates early in DNA replication checkpoint control. Mol. Cell 37, 438–446 (2010).
Guillemette, S. et al. FANCJ localization by mismatch repair is vital to maintain genomic integrity after UV irradiation. Cancer Res. 74, 932–944 (2014).
Sannino, V. & Costanzo, V. ATR checkpoint suppression by repetitive DNA. Cell Cycle 15, 2993–2994 (2016).
Aze, A. et al. Centromeric DNA replication reconstitution reveals DNA loops and ATR checkpoint suppression. Nat. Cell Biol. 18, 684–691 (2016).
Chanoux, R. A. et al. ATR and H2AX cooperate in maintaining genome stability under replication stress. J. Biol. Chem. 284, 5994–6003 (2009).
Wu, W. et al. HERC2 facilitates BLM and WRN helicase complex interaction with RPA to suppress G-Quadruplex DNA. Cancer Res. 78, 6371–6385 (2018).
Maestroni, L. et al. RPA and Pif1 cooperate to remove G-rich structures at both leading and lagging strand. Cell Stress 4, 48–63 (2020).
Bacolla, A., Tainer, J. A., Vasquez, K. M. & Cooper, D. N. Translocation and deletion breakpoints in cancer genomes are associated with potential non-B DNA-forming sequences. Nucleic Acids Res. 44, 5673–5688 (2016).
Cheloshkina, K. & Poptsova, M. Tissue-specific impact of stem-loops and quadruplexes on cancer breakpoints formation. BMC Cancer 19, 434 (2019).
Rodriguez, R. et al. A novel small molecule that alters shelterin integrity and triggers a DNA-damage response at telomeres. J. Am. Chem. Soc. 130, 15758–15759 (2008).
Chen, M. C., Murat, P., Abecassis, K., Ferre-D’Amare, A. R. & Balasubramanian, S. Insights into the mechanism of a G-quadruplex-unwinding DEAH-box helicase. Nucleic Acids Res. 43, 2223–2231 (2015).
Maleki, P. et al. Quantifying the impact of small molecule ligands on G-quadruplex stability against Bloom helicase. Nucleic Acids Res. 47, 10744–10753 (2019).
Huang, F. et al. Video-rate nanoscopy using sCMOS camera-specific single-molecule localization algorithms. Nat. Methods 10, 653–658 (2013).
Holden, S. J., Uphoff, S. & Kapanidis, A. N. DAOSTORM: an algorithm for high- density super-resolution microscopy. Nat. Methods 8, 279–280 (2011).
Modesti, M. Fluorescent labeling of proteins. Methods Mol. Biol. 115-134, 2018 (1665).
Chatterjee, S. et al. Mechanistic insight into the interaction of BLM helicase with intra-strand G-quadruplex structures. Nat. Commun. 5, 5556 (2014).
van de Meent, J. W., Bronson, J. E., Wiggins, C. H. & Gonzalez, R. L. Jr. Empirical Bayes methods enable advanced population-level analyses of single-molecule FRET experiments. Biophys. J. 106, 1327–1337 (2014).
Jain, A., Liu, R., **ang, Y. K. & Ha, T. Single-molecule pull-down for studying protein interactions. Nat. Protoc. 7, 445–452 (2012).
Otsu, N. A threshold selection method from gray-level histograms. IEEE Trans. Syst. Man Cybern. 9, 62–66 (1979).
Bermudez-Hernandez, K. et al. A method for quantifying molecular interactions using stochastic modelling and super-resolution microscopy. Sci. Rep. 7, 14882 (2017).
Acknowledgements
This work was supported by NIH grants 1R35GM134947-01 (E.R.), 1R01AI153040-01 (E.R.), 1P01CA247773-01/549 (E.R.), R01ES031658 (T.T.H.), R01CA225018-02 (S.B.C.); American Cancer Society grant RSG-16-241-01-DMC (E.R.); V Foundation BRCA Research grants (E.R. and T.T.H.). W.T.C.L. was supported, in part, by American Heart Association Summer 2018 Predoctoral Fellowship 18PRE33960303. The lab of K.G. was part of COST action CA15133, and has received funding from the Swiss National Science Foundation PP00P3_172959/1 and the Human Frontier Science Program CDA00043/2013-C. M.M. is supported by the French National Research Agency, the French National Cancer Institute and the French National League Against Cancer (équipe labellisée). We thank members of the Rothenberg laboratory for critical discussion.
Author information
Authors and Affiliations
Contributions
W.T.C.L. and E.R. designed the study and wrote the manuscript with input from all the authors. W.T.C.L. performed the imaging and SimPull experiments. W.T.C.L. and Y.Y. analyzed the data using computational pipelines developed by Y.Y. Y.Y. maintained equipment and performed calibration measurements. M.J.M. performed the smFRET experiments. P.T. performed the Western blot experiments supervised by T.T.H. P.G. performed the antibody validation experiment. D.C.O., K.G., S.B.C., and M.M. provided reagents.
Corresponding author
Ethics declarations
Competing interests
The authors declare no competing interests.
Additional information
Peer review information Nature Communications thanks Sergei Mirkin and the other, anonymous, reviewer(s) for their contribution to the peer review of this work. Peer reviewer reports are available.
Publisher’s note Springer Nature remains neutral with regard to jurisdictional claims in published maps and institutional affiliations.
Supplementary information
Source data
Rights and permissions
Open Access This article is licensed under a Creative Commons Attribution 4.0 International License, which permits use, sharing, adaptation, distribution and reproduction in any medium or format, as long as you give appropriate credit to the original author(s) and the source, provide a link to the Creative Commons license, and indicate if changes were made. The images or other third party material in this article are included in the article’s Creative Commons license, unless indicated otherwise in a credit line to the material. If material is not included in the article’s Creative Commons license and your intended use is not permitted by statutory regulation or exceeds the permitted use, you will need to obtain permission directly from the copyright holder. To view a copy of this license, visit http://creativecommons.org/licenses/by/4.0/.
About this article

Cite this article
Lee, W.T.C., Yin, Y., Morten, M.J. et al. Single-molecule imaging reveals replication fork coupled formation of G-quadruplex structures hinders local replication stress signaling. Nat Commun 12, 2525 (2021). https://doi.org/10.1038/s41467-021-22830-9
Received:
Accepted:
Published:
DOI: https://doi.org/10.1038/s41467-021-22830-9
- Springer Nature Limited
This article is cited by
-
Dormant origin firing promotes head-on transcription-replication conflicts at transcription termination sites in response to BRCA2 deficiency
Nature Communications (2024)
-
Chromatin dynamics and RNA metabolism are double-edged swords for the maintenance of plant genome integrity
Nature Plants (2024)
-
FANCJ promotes PARP1 activity during DNA replication that is essential in BRCA1 deficient cells
Nature Communications (2024)
-
Stepwise requirements for polymerases δ and θ in theta-mediated end joining
Nature (2023)
-
USP1-trap** lesions as a source of DNA replication stress and genomic instability
Nature Communications (2022)