
Abstract
Background
Differentially methylated imprint control regions (ICRs) regulate the monoallelic expression of imprinted genes. Their epigenetic dysregulation by environmental exposures throughout life results in the formation of common chronic diseases. Unfortunately, existing Infinium methylation arrays lack the ability to profile these regions adequately. Whole genome bisulfite sequencing (WGBS) is the unique method able to profile the ICRs. However, it is very expensive and it requires not only a high coverage, but it is also computationally intensive to assess these regions.
Findings
To address this deficiency, we developed a custom methylation array containing 22,819 probes. Among them, 10,438 are CG probes targeting unique CpG sites, with 9,757 probes successfully map** to 1,088 out of the 1,488 candidate ICRs recently described. To assess the performance of the array, we created matched samples processed with the Human Imprintome array and WGBS, which is the current standard method for assessing the methylation of the Human Imprintome. We compared the methylation levels from the shared CpG sites, and obtained a mean R2 = 0.569. We also created matched samples processed with the Human Imprintome array and the Infinium Methylation EPIC v2 array, and obtained a mean R2 = 0.796. Furthermore, replication experiments demonstrated high reliability (ICC: 0.799–0.945).
Conclusions
Our custom array will be useful for replicable and accurate assessment, mechanistic insight, and targeted investigation of ICRs. This tool should accelerate the discovery of ICRs associated with a wide range of diseases and exposures, and advance our understanding of genomic imprinting and its relevance in development and disease formation throughout the life course.
Introduction
Interdisciplinary evidence accumulated over the past decades supports that environmental stressors — where the environment is broadly defined to include the built environment, contaminants, and psychosocial and socioeconomic stressors — are estimated to contribute 70–90% of the burden of common chronic diseases in humans [1,2,3]. Nevertheless, empirical human data remains limited as disease formation often occurs many years after environmental exposure.
Epigenetics is a means by which genes respond to a wide range of environmental stressors to stably change gene expression, replication, and repair that can cause long-term health effects [4]. Mechanistically, this is achieved by altering the organization and function of chromatin with the use of modifications to DNA and histones, as well as non-coding RNA interference [5]. The most studied epigenetic mechanism in humans is DNA methylation, owing to the stability of the DNA molecule. Indeed, data generated in the last decade, much of it from multiple iterations of Illumina Methylation Arrays, demonstrate the mediating role of CpG methylation in the effects of a wide range of environmental exposures and chronic diseases [6,7,8]. Sometimes the interpretation of the findings is ambiguous because the DNA methylation modifications identified in the accessible tissues, such as blood, are different from the marks in the diseased tissue [9, 10]. Moreover, many epigenetic marks must respond to environmental exposure throughout the life course, making cause-and-effect difficult to infer in related disease outcomes.
Known exceptions to this variability are CpG methylation marks that are stochastically established before tissue specification that controls metastable epiallele expression [11], and those that reside in the imprint control regions (ICRs) that regulate the monoallelic expression of imprinted genes [12,13,14]. CpG methylation in ICRs is established before gastrulation and is mitotically heritable, such that these epigenetic marks are normally similar across tissues and cell types over the life course. ICRs are defined by parent-of-origin specific methylation marks that are important gene dosage regulators and are similar across individuals. The stability of these methylation marks with age also makes them long-term ‘records’ of early exposures that are difficult to obtain through questionnaires or other exposure assessment assays [14]. Moreover, multiple lines of evidence support that changes in the methylation patterns in ICRs are implicated in many disorders such as cancer [15, 16], neurological disorders [17], specific syndromes such as Prader–Willi syndrome [18] and Angelman syndrome [19], as well as chronic diseases that result from exposure to environmental contaminants [20, 21].
While these features make ICRs attractive targets for unraveling the mechanisms underlying many chronic diseases with developmental origins and in develo** potential therapeutic strategies, until a year ago, only 24 ICRs were characterized [13, 22]. In a recent study, Jima et al. identified 1,488 candidate differentially methylated ICRs in humans by performing whole-genome bisulfite sequencing (WGBS) [12]. The replicable measurement of CpG methylation in these regions in a large number of samples is only possible using a high throughput DNA methylation sequencing method.
While the cost of WGBS continues to decline relative to the depth of sequence, the cost to sequence, and complexity of whole genome sequencing analysis are prohibitive for analyzing just these regions. The existing targeted method of pyrosequencing can only analyze single sequences, and has a limited length of high-quality sequence obtained (often < 100 bp). Targeted amplification and pooled sequencing of small numbers of ICRs (< 20) is a feasible approach, but is only effective once a small target set is established, and not effective for generalized screening. Hybridization capture methods to enrich for target sequences from genomic libraries, such as targeted methyl-seq assays from Twist Bioscience, Inc. (San Francisco, CA) are capable of targeted sequencing on the scale required; however, like the other sequencing-based methods, require substantial technical expertise, and a variety of specialized instrumentation.
Microarrays provide a means of simultaneous methylation quantitation on the scale required, using less complex sample processing methods, shorter times for data collection than Next Generation Sequencing (NGS), and are more automatable. While microarrays are not able to measure every ICR CpG site, they are capable of interrogating a subset of CpG sites within nearly all candidate ICRs.
The most common DNA methylation microarrays in academic and commercial research are the Illumina Infinium HumanMethylation450, the Infinium Illumina EPIC850k BeadChip, and the Infinium Methylation EPICv2 BeadChip (Illumina, Inc., San Diego, CA). The reference human genome contains 22,157 CpG sites mapped to the 1,488 ICRs. However, only 6.8% of them are represented on the EPICv2 array. Thus, the current arrays are not able to comprehensively profile ICRs, limiting our ability to use these arrays to investigate the role of imprinting in disease development.
Herein, we describe the development of a custom methylation array specifically designed to target and measure the DNA methylation status of the candidate ICRs involved in imprinted gene expression. This technology provides a targeted and comprehensive approach that allows accurate assessment, mechanistic insights, and the identification of aberrations within ICRs associated with various diseases.
Methods
Sample cohort information
Alzheimer’s disease brain tissues
DNA derived from autopsy brain specimens was obtained from the Joseph and Kathleen Bryan Brain Bank of the Duke University/University of North Carolina at Chapel Hill Alzheimer’s Disease Research Center (Duke/UNC ADRC). These brain tissues were selected according to their neuropathologic diagnosis of Alzheimer’s disease. Eight brain samples from AD autopsies (4 non-Hispanic Blacks – NHBs – and 4 non-Hispanic Whites – NHWs) and eight brain samples from control autopsies (4 NHBs and 4 NHWs) were processed using both the Human Imprintome array and WGBS with 10-15X coverage [23].
Alzheimer’s disease whole blood
A pilot case control study of 50 cases and 50 controls was also conducted at the Duke Memory Clinic. Peripheral whole blood was collected by the lancet and capillary method into lysis buffer and DNA extracted. In total, DNA samples from 17 individuals were randomly selected. Among them, 10 were Alzheimer’s disease cases and 7 were controls. All the samples were processed twice using the Human Imprintome array to assess the performance of the array. Moreover, three more controls were randomly selected to process them with the Human Imprintome array and the EPICv2 array.
Newborn epigenetics study (NEST) cohort umbilical cord
NEST is an ongoing prospective birth cohort study with 2,681 pregnant women recruited in two waves between 2005 and 2011; enrollment of participants is described in detail elsewhere [24, 25]. Briefly, pregnant women were recruited from prenatal clinics serving Duke University Hospital and Durham Regional Hospital obstetrics facilities in Durham, NC. Eligible participants were: (1) pregnant, (2) at least 18 years of age, (3) English-speaking, and (4) intending to deliver at one of two obstetric facilities. Women with HIV or intending to give up custody of their offspring were excluded. At delivery, umbilical cord blood was obtained. For the current study, we used 8 umbilical cord blood samples, and processed them twice with the Human Imprintome Array to assess the reliability of the array.
Preprocessing of the human imprintome and EPIC array data
For the preparation of samples, 200 ng of DNA were bisulfite converted using the EZ DNA Methylation kit (Zymo Research, Irvine, CA) according to the manufacturer’s instructions. Bisulfite-converted DNA samples were randomly assigned to a chip well on the Infinium Human Methylation EPIC v2 BeadChip (Illumina, Inc., San Diego, CA) or in the Human Imprintome array BeadChip (Illumina, Inc., San Diego, CA), amplified, hybridized onto the array, stained, washed, and imaged with the Illumina iScan SQ instrument (Illumina, Inc., San Diego, CA) to obtain raw image intensities. For the EPIC processing, the data were processed at TruDiagnostic, Inc. (Lexington, KY) using a custom EPIC v2 array that include all the probes from the regular EPICv2 array [26] and 6,930 additional probes spiked in.
To preprocess the DNA methylation values, we utilized the sesame package [27] due to its compatibility with custom arrays. Specifically, we employed the readIDATpair followed by the getBetas functions, which require the IDAT file locations and the custom manifest to generate a beta value matrix. To visualize the distribution of beta values we employed the densityPlot function from the minfi package [28].
Processing of the WGBS data
For the Alzheimer’s disease autopsy tissues (n = 16), libraries were prepared using EpiGnome™ Methyl-Seq reagents (Illumina, Inc, San Diego, CA), index-tagged for multiplexing, and sequenced on an Illumina NextSeq platform (Illumina, Inc, San Diego, CA). Reads were assigned back to individuals by indexing, and aligned in silico to a bisulfite-converted reference genome (version Hg38), eliminating reads without unique alignments (due to either repetitive genomic sequence or loss of specificity from bisulfite conversion of cytosines) and duplicate reads (indicative of clonal amplification of original random DNA fragments). From these reads, methylation fractions and read counts were calculated for all CpG sites in the genome. There was > 97% bisulfite conversion in all samples, with sequence coverage between 10X-15X and no sequence duplication bias. To compare against array data, the percent of methylated reads over the total number of reads was used to estimate overall methylation values. We removed the CpG sites that had fewer than 10 reads per probe from the WGBS data to ensure a correct estimation of the methylation level. These values were then compared to unnormalized beta values extracted from arrays.
Results
Design of the human imprintome array
For the development of the custom Human Imprintome array, we first identified the CpG sites from the reference human genome that were mapped to the 1,488 ICRs described by Jima et al. using WGBS [12]. To this end, we extracted 29.4 million CpG locations from the human genome (hg38), and intersected with ICR locations using the intersect function from bedtools. The total number of CpG sites mapped to ICRs was 22,157 (Table S1). Illumina, Inc. (San Diego, CA) used this list in order to design an array with the maximum number of probes targeting those CpG sites.
Remarkably, we used threshold scores designed and validated by Illumina, Inc. (San Diego, CA) to only select high-quality probes. Mainly, we used a general score based on probe sequence, including GC content and annealing temperature. The minimum probe score was set to 0.3 for the converted strand and 0.2 for the opposite strand.
As a result, the Human Imprintome array manifest (Table S3) comprises a total of 22,819 probes, categorized into 704 control probes and 22,115 CG probes (Table 1). Out of the CG probes, 10,438 are mapped to unique CpG sites, with 9,757 successfully aligned with one of the 1,488 identified ICRs (Table S4). The remaining CG probes served various purposes, including multimap**, background normalization, or map** to distinct locations that did not intersect with any ICR. The manifest includes 10,364 cgBackground (“cgBK”) probes with missing chromosomes that were included in the manifest to enable any additional background-normalization capabilities, such as quantile normalization or Noob. The determination of this probe count stemmed from an evaluation conducted by Illumina, Inc. (San Diego, CA), assessing the impact of integrating varying proportions of Infinium I and Infinium II probes for normalization purposes. Consequently, 10,364 cgBK probes have been retained in the manifest of all custom arrays. This set includes 9,163 Infinium II assays, 485 Green extending Infinium I probes, and 716 Red extending Infinium I probes.
Previous studies have identified the necessity to exclude low-specificity probes that can bind to multiple sequences within the genome, as well as probes that contain genetic variants in their underlying sequence [29, 30]. In the Human Imprintome array, we identified 1,313 multimapper probes. The number of map** genomic positions per probe in the GRCh38 Build Genome ranged from 2 to 100 (Fig. S1; Table S2). However, since these 1,313 multimapper probes were representative of a high number of ICRs, we decided to keep these probes on the array although the chromosome and the position in the manifest were set to 0 to avoid confusion.
Out of the 1,488 ICRs, a subset of 1,088 ICRs (73.1%) had successful probe alignments, as outlined in Table 2. The distribution of probes per ICR in the Human Imprintome array revealed a mean value of 9, encompassing a range from a minimum of 1 probe to a maximum of 171 probes. Notably, a significant proportion (n = 672) of ICRs exhibited successful map**s with more than 5 probes.
Comparison with other arrays
To compare the Human Imprintome array with other arrays, we calculated the ICR representation in each sequencing method. As a reference, we used the WGBS method, since it is able to target all 22,157 CpG sites that were identified to be representative of the 1,488 ICRs [12]. Figure 1 demonstrates that the Imprintome array has a much larger representation of ICRs compared to EPICv1 and EPICv2 arrays. As shown in Table 2, the EPICv1 array only examines 307 probes out of the 22,157 (1.4%), and has a representation of 156 ICRs. Moreover, the average number of probes per ICR is 2. The last version of the EPIC array, version 2, can sequence a higher number of Human Imprintome probes compared to version 1. In this case, 6.8% of the probes are analyzed and they represent 548 ICRs with an average of 2.7 probes per ICR. In contrast, the Human Imprintome array evaluates the methylation level of 9,757 probes that are mapped to unique locations (44.0%), and represent 1,088 ICRs with an average of 9 probes per ICR. Remarkably, the first 345 ICRs, which are mapped to chromosomes 1 to 5, and the ICRs from 1221 to 1300, which are mapped to chromosome 21, show a low representation in all the arrays. This is due to the highest frequency of multi-map** probes on those regions.
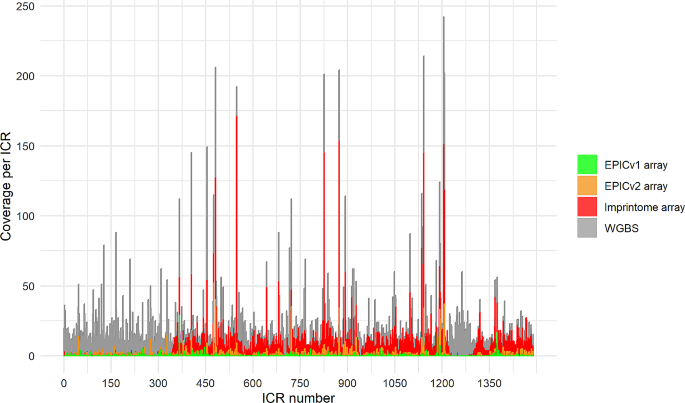
Coverage across Imprint Control Regions (ICRs) for each sequencing method. Whole genome bisulfite sequencing (WGBS) is the reference and it contains the 1,488 ICRs described [12], as well as the 22,157 probes mapped to these regions. The other sequencing methods have a lower number of ICRs and probes representing those ICRs
To check whether the beta values obtained using the Human Imprintome array are comparable with the beta values using the EPICv2 array, we examined three whole blood samples from the Alzheimer’s cohort that were processed using both the EPICv2 array and the Human Imprintome array. The EPICv2 and the Human Imprintome array contain some CpG sites that are targeted using multiple probes. This is implemented because some areas may need more than one probe to generate accurate analysis due to the CG enrichment or the presence of single nucleotide polymorphisms (SNPs) in the probe sequence. Thus, multiple probes can target mutations on the same site with each probe for a different alternative allele. In the EPICv2, 4174 CpG sites are targeted twice and 1016 are targeted three times for different alternative alleles [26]. In the Human Imprintome Array, 1,182 CpG sites were targeted twice. To ensure comparability across arrays, we collapsed multiple probes targeting the same CpG site by calculating their mean.
Utilizing this approach, we identified 1,703 probes sites that overlapped between the EPICv2 and Human Imprintome arrays. We obtained Pearson correlation coefficients of 0.788, 0.811, and 0.789, respectively, as shown in Fig. 2. As expected, there is a cluster of control probes around 0 and around 1 in both methods.

Correlation plots between Human Imprintome and the Infinium Methylation EPIC arrays. We selected the 1,703 probes overlapped between both arrays to plot the Pearson correlation. (A) Sample AD-125, which belongs to a female Non-Hispanic White (NHW) sample. (B) Sample AD-157, which belongs to a male Non-Hispanic White sample. (C) Sample AD-173, which belongs to a male Non-Hispanic Black (NHB) sample. Each color represents a different probe type; “cg” probes are colored in red; control probes (“ctl”) are colored in green; and single nucleotide polymorphism control probes (“rs”) are colored in blue
Moreover, using the same samples, we compared the beta value density plots using the probes from each array. The beta values from all the probes in the Human Imprintome array exhibit three peaks at 0, 0.5, and 1 (Fig. 3A). However, when we remove all the probes that are not mapped to any ICR, we only observe a peak at 0.5, which is indicative of monoallelic methylation (Fig. 3B). This pattern arises from the presence of approximately 100% methylation on one parental allele and 0% methylation on the other. The density plot of the probes analyzed in the EPICv2 array displays two peaks at 0 and 1, reflecting biallelic methylation, where both probes were either methylated or unmethylated (Fig. 3C). This shows that the Human Imprintome array is correctly assessing the methylation levels of the Human Imprintome probes.

Comparison of the beta distribution between all the probes in the Human Imprintome array (A), the probes mapped to ICRs from the Human Imprintome array (B), and all the probes from the Infinium Methylation EPIC v2 array (C) in the same samples
Finally, we compared the DNA methylation levels along all the probes mapped to the ICR_548, since it was one of the ICRs with higher coverage in the Human Imprintome array compared to the EPICv2. Figure 4 shows that the Human Imprintome array is useful for a better comprehension of the DNA methylation levels along ICR_548.

DNA methylation levels along all the probes from the ICR_548 in the Human Imprintome (A & B) and EPICv2 arrays (C & D) in the same samples. (A) Violin plot showing the DNA methylation levels along 171 probes mapped to ICR_548 in the Human Imprintome array. (B) DNA methylation levels along the genomic positions within the ICR_548 for the Human Imprintome array. (C) Violin plot showing the DNA methylation levels along 9 probes mapped to ICR_548 in the EPICv2 array. (D) DNA methylation levels along the genomic positions within the ICR_548 for the EPICv2 array
Additionally, we compared the Human Imprintome array to the current standard method for assessing the methylation of the Human Imprintome (i.e., WGBS). We used 16 brain samples from Alzheimer’s cases and controls. These samples were classified into 4 controls and 4 cases of NHBs and 4 controls and 4 cases of NHWs. To correctly assess the correlations between the Human Imprintome array and WGBS, we combined the 4 samples from each group by averaging the DNA methylation levels in the Human Imprintome array, and by combining the reads in WGBS. This increased the coverage and obtained a higher number of shared CpG sites between both methodologies. We collapsed the probes that were targeting the same CpG site in the Human Imprintome array.
We removed the CpG sites that had fewer than 10 reads per probe from the WGBS data because the probability of estimating an incorrect methylation level is higher when the number of reads per probe is low. We then calculated the percentage of methylated reads compared to the total of reads mapped to each probe to compare this value to the beta values from the Human Imprintome array. Finally, we calculated the correlations using the CpG sites shared in each group. The highest number of CpG sites shared was for NHB cases with 7746 and the lowest was 4513 for NHW controls. The correlations ranged from 0.532 for NHW cases to 0.657 for NHB controls with a mean of 0.569 (Fig. 5). We also did a filtration at 1, 3, 5, and 20 reads per probe, but the best results with a sufficient number of probes to compare were obtained with 10 (Table S5).

Correlation between the Human Imprintome array and WGBS. (A) Correlation plot for the combination of four Non-Hispanic White (NHW) Alzheimer’s Disease cases. (B) Correlation plot for the combination of four Non-Hispanic Black (NHB) Alzheimer’s Disease cases. (C) Correlation plot for the combination of four NHW controls. (D) Correlation plot for the combination of four NHB controls
Performance in replicates
To test the performance of the array, we analyzed replicates in the laboratory. We used 8 samples from the umbilical cord blood (NEST cohort [23, 24]) and 17 samples from whole blood (Alzheimer’s cohort). Using all the probes, we calculated the intraclass correlation (ICC) between the first and the second replicate for each sample. The ICC values ranged from 0.799 to 0.945, having a mean of 0.868 (Table S6; Figs. S2-S3).
Discussion
The Illumina BeadArray technology has undergone substantial redevelopment over the years, and the total number of CpG sites that can be simultaneously analyzed has increased substantially from ~ 25,000 in 2008 (HumanMethylation27KBeadChip) [31], to ~ 485,000 in 2011 (HumanMethylation450K BeadChip) [32], to over ~ 850,000 CpG sites in 2016 (MethylationEPIC BeadChip v1.0) [33], and finally to over ~ 935,000 CpG sites in 2022 when MethylationEPIC BeadChip v2.0 was released in June of 2023 [26].
In this study, we have successfully developed and characterized a Human Imprintome custom array, which offers an innovative approach for investigating DNA methylation patterns specifically associated with ICRs and parental allele-specific methylation. Using replicate samples, we have demonstrated that this custom array exhibits high reliability when capturing DNA methylation information. Furthermore, the analysis of beta values obtained from the shared CpG sites between the Human Imprintome array, EPIC v2 array, and WGBS has revealed a high degree of correlation, reinforcing the robustness and reliability of the Human Imprintome custom array. The correlation between the Human Imprintome array and the WGBS was lower than the correlation with the EPICv2. It is likely caused by the low coverage of the WGBS data and also by the different methodologies for assessing DNA methylation (array type vs. sequencing).
Imprinted genes play essential roles in embryonic development and growth regulation. Understanding their imprinting patterns and functions is vital for comprehending normal development and potentially identifying the causes of developmental disorders. Imprinting disorders, such as Prader-Willi [34, 35], Silver-Russell [36], Angelman [34, 35], and Kagami-Ogata syndromes [37] result from abnormalities in imprinted genes. Investigating in more detail the ICRs can provide insights into the molecular mechanisms underlying these disorders, leading to better diagnostics, treatments, and potential prevention strategies. Moreover, understanding better how imprinted genes influence growth regulation could lead to novel treatments for growth disorders or cancers that involve the dysregulation of imprinting.
The Human Imprintome array represents a powerful tool that provides researchers with a focused platform for high-resolution analysis of DNA methylation dynamics in imprint control regions. Custom arrays like the Human Imprintome array can be a cost-effective solution compared to using commercially available arrays that contain probes unrelated to the research focus. By focusing on specific regions of interest, researchers can also optimize their resources, and obtain more relevant data. Notably, existing commercial arrays have representation for a limited number of ICRs. The EPICv1 and EPICv2 arrays have 10.5% and 36.8% of the ICRs represented, respectively, with an average of 2 probes per ICR. In comparison, the Human Imprintome array contains 73.1% of the ICRs with an average of 9 probes per ICR.
Infinium arrays are extensively used and there are many bioinformatic pipelines to process them. Although not all of them work with custom arrays, sesame is an existing package that seamlessly integrates with the Human Imprintome array, and ensures accurate data processing [27]. Moreover, the utilization of arrays provides precise estimates of DNA methylation at specific sites, enabling the design of epigenetic biomarkers specific to the Human Imprintome array.
To enhance the utility of the Human Imprintome array, we have provided a comprehensive annotation of the probes contained in the array, as well as detailed information regarding the ICRs and the probes mapped to them. This annotation allows researchers to gain a deeper understanding of the regions and probes interrogated by the array, facilitating more targeted and insightful analyses.
Although the Human Imprintome array exhibits remarkable performance, we acknowledge its limitations, including the absence of probes representing 400 ICRs and the relatively low coverage in some represented ICRs, especially those mapped to chromosomes 1 to 5, and chromosome 21. However, we are actively addressing these limitations, and working towards the development of a new version of the array that includes probes mapped to the missing ICRs.
In conclusion, the Human Imprintome custom array has the potential to significantly contribute to the identification of CpG sites and ICRs with altered methylation levels. This, in turn, may provide valuable insights into the emergence and evolution of diseases associated with aberrant DNA methylation patterns involved in imprinted gene regulation. The Human Imprintome array, with its focused design, extensive annotation, and promising performance, holds great promise as a powerful tool for unraveling the complex relationship between DNA methylation, imprinting, and disease pathogenesis.
Data availability
Data will be available from the authors upon request. It will also be updated and available at the website https://humanicr.org/. This website will also have NCBI accession numbers when available.
References
Rappaport SM, Smith MT. Environment and Disease risks. Science. 2010;330:460–1.
Lichtenstein P, Holm NV, Verkasalo PK, Iliadou A, Kaprio J, Koskenvuo M, et al. Environmental and heritable factors in the causation of cancer–analyses of cohorts of twins from Sweden, Denmark, and Finland. N Engl J Med. 2000;343:78–85.
Willett WC. Balancing life-style and genomics research for disease prevention. Science. 2002;296:695–8.
Ho S-M, Johnson A, Tarapore P, Janakiram V, Zhang X, Leung Y-K. Environmental epigenetics and its implication on Disease Risk and Health outcomes. ILAR J. 2012;53:289–305.
Handy DE, Castro R, Loscalzo J. Epigenetic modifications: Basic mechanisms and Role in Cardiovascular Disease. Circulation. 2011;123:2145–56.
Mannens MMAM, Lombardi MP, Alders M, Henneman P, Bliek J. Further introduction of DNA methylation (DNAm) arrays in regular Diagnostics. Front Genet. 2022;13:831452.
Baylin SB, Jones PA. A decade of exploring the cancer epigenome - biological and translational implications. Nat Rev Cancer. 2011;11:726–34.
Robertson KD. DNA methylation and human disease. Nat Rev Genet. 2005;6:597–610.
Zhang B, Zhou Y, Lin N, Lowdon RF, Hong C, Nagarajan RP, et al. Functional DNA methylation differences between tissues, cell types, and across individuals discovered using the M&M algorithm. Genome Res. 2013;23:1522–40.
Lokk K, Modhukur V, Rajashekar B, Märtens K, Mägi R, Kolde R, et al. DNA methylome profiling of human tissues identifies global and tissue-specific methylation patterns. Genome Biol. 2014;15:r54.
Kessler NJ, Waterland RA, Prentice AM, Silver MJ. Establishment of environmentally sensitive DNA methylation states in the very early human embryo. Sci Adv. 2018;4:eaat2624.
Jima DD, Skaar DA, Planchart A, Motsinger-Reif A, Cevik SE, Park SS, et al. Genomic map of candidate human imprint control regions: the imprintome. Epigenetics. 2022;17:1920–43.
Skaar DA, Li Y, Bernal AJ, Hoyo C, Murphy SK, Jirtle RL. The human imprintome: Regulatory mechanisms, methods of Ascertainment, and roles in Disease susceptibility. ILAR J. 2012;53:341–58.
Hoyo C, Murphy SK, Jirtle RL. Imprint regulatory elements as epigenetic biosensors of exposure in epidemiological studies. J Epidemiol Community Health. 2009;63:683–4.
Plass C, Soloway PD. DNA methylation, imprinting and cancer. Eur J Hum Genet. 2002;10:6–16.
Monk D. Deciphering the cancer imprintome. Brief Funct Genomics. 2010;9:329–39.
Ho-Shing O, Dulac C. Influences of genomic imprinting on brain function and behavior. Curr Opin Behav Sci. 2019;25:66–76.
Cassidy SB, Schwartz S, Miller JL, Driscoll DJ. Prader-Willi syndrome. Genet Med off J Am Coll Med Genet. 2012;14:10–26.
Williams CA, Driscoll DJ, Dagli AI. Clinical and genetic aspects of Angelman syndrome. Genet Med off J Am Coll Med Genet. 2010;12:385–95.
Pathak R, Feil R. Environmental effects on genomic imprinting in Development and Disease. In: Patel VB, Preedy VR, editors. Handbook of Nutrition, Diet, and Epigenetics. Cham: Springer International Publishing; 2019. pp. 3–23.
Cowley M, Skaar DA, Jima DD, Maguire RL, Hudson KM, Park SS, et al. Effects of Cadmium exposure on DNA methylation at imprinting control regions and genome-wide in mothers and Newborn Children. Environ Health Perspect. 2018;126:037003.
Luedi PP, Dietrich FS, Weidman JR, Bosko JM, Jirtle RL, Hartemink AJ. Computational and experimental identification of novel human imprinted genes. Genome Res. 2007;17:1723–30.
Cevik SE, Skaar DA, Jima DD, Liu AJ, Østbye T, Whitson HE, et al. DNA methylation of imprint control regions associated with Alzheimer’s disease in non-hispanic blacks and non-hispanic whites. Clin Epigenetics. 2024;16:58.
McCullough LE, Mendez MA, Miller EE, Murtha AP, Murphy SK, Hoyo C. Associations between prenatal physical activity, birth weight, and DNA methylation at genomically imprinted domains in a multiethnic newborn cohort. Epigenetics. 2015;10:597–606.
Hoyo C, Murtha AP, Schildkraut JM, Forman MR, Calingaert B, Demark-Wahnefried W, et al. Folic acid supplementation before and during pregnancy in the Newborn epigenetics STudy (NEST). BMC Public Health. 2011;11:46.
Kaur D, Lee SM, Goldberg D, Spix NJ, Hinoue T, Li H-T, et al. Comprehensive evaluation of the Infinium human MethylationEPIC v2 BeadChip. Epigenetics Commun. 2023;3:6.
Ding W, Kaur D, Horvath S, Zhou W. Comparative epigenome analysis using Infinium DNA methylation BeadChips. Brief Bioinform. 2023;24:bbac617.
Minfi. a flexible and comprehensive Bioconductor package for the analysis of Infinium DNA methylation microarrays | Bioinformatics | Oxford Academic. https://academic.oup.com/bioinformatics/article/30/10/1363/267584. Accessed 6 Sep 2023.
Hop PJ, Zwamborn RAJ, Hannon EJ, Dekker AM, van Eijk KR, Walker EM, et al. Cross-reactive probes on Illumina DNA methylation arrays: a large study on ALS shows that a cautionary approach is warranted in interpreting epigenome-wide association studies. NAR Genomics Bioinforma. 2020;2:lqaa105.
Chen Y, Lemire M, Choufani S, Butcher DT, Grafodatskaya D, Zanke BW, et al. Discovery of cross-reactive probes and polymorphic CpGs in the Illumina Infinium HumanMethylation450 microarray. Epigenetics. 2013;8:203–9.
Bibikova M, Le J, Barnes B, Saedinia-Melnyk S, Zhou L, Shen R, et al. Genome-wide DNA methylation profiling using Infinium® assay. Epigenomics. 2009;1:177–200.
Bibikova M, Barnes B, Tsan C, Ho V, Klotzle B, Le JM, et al. High density DNA methylation array with single CpG site resolution. Genomics. 2011;98:288–95.
Pidsley R, Zotenko E, Peters TJ, Lawrence MG, Risbridger GP, Molloy P, et al. Critical evaluation of the Illumina MethylationEPIC BeadChip microarray for whole-genome DNA methylation profiling. Genome Biol. 2016;17:208.
Cassidy SB, Schwartz S. Prader-Willi and Angelman syndromes. Disorders of genomic imprinting. Med (Baltim). 1998;77:140–51.
Horsthemke B, Wagstaff J. Mechanisms of imprinting of the Prader-Willi/Angelman region. Am J Med Genet A. 2008;146A:2041–52.
Eggermann T, Begemann M, Binder G, Spengler S. Silver-Russell syndrome: genetic basis and molecular genetic testing. Orphanet J Rare Dis. 2010;5:19.
Prasasya R, Grotheer KV, Siracusa LD, Bartolomei MS. Temple syndrome and Kagami-Ogata syndrome: clinical presentations, genotypes, models and mechanisms. Hum Mol Genet. 2020;29:R107–16.
Acknowledgements
We thank the Newborn Epigenetics Study (NEST) families for their participation. We also thank Dr. Andrew Lui of the Duke Memory Clinic for enrolling Alzheimer’s disease cases and controls.
Funding
This work was supported by NIH: R01ES093351, R01HD098857, R01MD011746, and R21HD093351. DDJ is supported with The CHHE grant P30ES025128.
Author information
Authors and Affiliations
Contributions
RS, CH, RLJ, and DAS conceived and designed the study. NCG, VBD, and DDJ performed the bioinformatic analyses. DAS and TLM analyzed the samples at the lab. AP and WZ performed validation of the analyses to ensure accuracy of the results. All authors drafted and edited the manuscript.
Corresponding authors
Ethics declarations
Ethics approval and consent to participate
The study protocol from the NEST and Alzheimer’s Disease study were approved by the Duke University Institutional Review Board. Autopsy specimens were exempted from IRB review by Duke and NC State University IRBs.
Competing interests
NC, VBD, RS, and TLM are employees of TruDiagnostic. The other authors declare no conflict of interest.
Additional information
Publisher’s Note
Springer Nature remains neutral with regard to jurisdictional claims in published maps and institutional affiliations.
Electronic supplementary material
Below is the link to the electronic supplementary material.
Rights and permissions
Open Access This article is licensed under a Creative Commons Attribution 4.0 International License, which permits use, sharing, adaptation, distribution and reproduction in any medium or format, as long as you give appropriate credit to the original author(s) and the source, provide a link to the Creative Commons licence, and indicate if changes were made. The images or other third party material in this article are included in the article’s Creative Commons licence, unless indicated otherwise in a credit line to the material. If material is not included in the article’s Creative Commons licence and your intended use is not permitted by statutory regulation or exceeds the permitted use, you will need to obtain permission directly from the copyright holder. To view a copy of this licence, visit http://creativecommons.org/licenses/by/4.0/. The Creative Commons Public Domain Dedication waiver (http://creativecommons.org/publicdomain/zero/1.0/) applies to the data made available in this article, unless otherwise stated in a credit line to the data.
About this article

Cite this article
Carreras-Gallo, N., Dwaraka, V.B., Jima, D.D. et al. Creation and validation of the first infinium DNA methylation array for the human imprintome. Epigenetics Commun. 4, 5 (2024). https://doi.org/10.1186/s43682-024-00028-6
Received:
Accepted:
Published:
DOI: https://doi.org/10.1186/s43682-024-00028-6