
Abstract
The use of wind energy worldwide has overgrown in recent years to reduce greenhouse gas emissions. Wind power is free, but the installation and maintenance of wind turbines remain very costly. The size of the installation of the wind turbine is not only determined by wind statistics at a given location, but also by turbine infrastructure and maintenance costs. The payback time of the turbine is dependent on turbine energy costs. This study estimates the wind power generation capacity of Northern and Southern Oman and discusses the selection of the most economical, efficient and reliable wind turbines in Oman. HOMER Pro Software was used in this paper to evaluate the wind energy data in the north and south of Oman and to provide well-informed guidance on the most suitable turbines for the power needs of each area. Six different standard wind turbines were measured and compared in terms of the cost of energy and performance. The simulation analysis reveals that the DW54 turbine is the best possible turbine to generate electricity in northern Oman at $0.119/kW. Due to the difference in the wind regime between the north and the south of Oman, the simulation showed that the Hummer H25.0–200 kW turbine is the best option for south Oman with power generation at $0.070/kW. The northern wind turbine plant can efficiently contribute to decarbonization of the energy sector in Oman, with a potential reduction of CO2 emission approximately 19,000 tons/year in comparison to natural gas and 28,000 tons/year in comparison to diesel. In the Southern Power Plant, carbon emissions are reduced by 18,000 and 12,000 tons/year compared to diesel and natural gas.
Introduction
The rise in global temperature and severe climate change worldwide has increased environmental concerns. Nowadays, more than 90% of the world’s electricity comes from fossil fuels (World-Bank 2015), and that energy production plays a vital role in global warming. Any changes in this field can have a significant impact on the environment. Numerous researchers, therefore, have attempted to change or alleviate the negative impacts of global warming, with much of this effort coming from the energy sector (Ghodsi et al. 2019; Khare et al. 2016; Sahu et al. 2018). In comparison to fossil fuels, the impact of renewable energy sources on the environment is negligible. These sources, for example, have no direct CO2 or NOx emissions. From solar panels to wind turbine generators, a wide range of devices can convert ambient energy into a more useful form, like electricity (Charabi et al. 2019). Among these devices, wind turbines are some of the most popular and accessible methods of converting ambient energy to electricity (Yang et al. 2018). However, wind energy, like most other sources of renewable energy, has high capital costs, but during the past decade, this trend has changed tremendously. Statics show that the cost of wind production has dropped enormously in recent years, from two million dollars per M.W. to one million in the last decade (Moné 2017). This achievement has made it possible to see wind power plants with increasing frequency in both developed and develo** countries (Sahu 2018).
As a Middle Eastern, oil-dependent country, Oman has started in a new direction on its path of development. The country is trying to change its electricity production industry from one that is entirely oil-based to one that is more reliant on sustainable “greener” energy sources (Abdul-Wahab et al. 2019a; Al-Suleiman et al. 2019). The main two options for this plan are solar and wind energy. Although Oman’s sunny weather provides a unique opportunity for solar energy generation, the country’s wind power potential must not be neglected. As of this article’s writing, Oman has no industrial wind power stations, and the country’s wind turbines are mainly used for research purposes. However, this situation is changing, beginning with develo** an understanding of the country’s wind power potential. An incorrect estimation of wind energy needs or the use of low-performance equipment not only reduces the benefits of the project, but also might lead to economic disaster (Dolatabadi et al. 2017).
Over the last decade, considerable information on wind resource map** across Oman has been accumulated to stimulate the deployment of wind power (Al-Yayai and Charabi 2015; Al-Yahyai et al. 2012, 2013; Charabi et al. 2011; Al Yahyai el al. 2010). Despite the availability of wind map** information, the deployment of wind energy across Oman is still lagging due to the lack of accurate information on turbine energy cost. Without access to sound information on the cost of wind power technology, it is difficult for decision-makers, if not impossible; to evaluate which wind turbine technologies will most fit their national circumstances. The fast growth and cost reductions in the installed wind energy technologies mean that even data aged one or 2 years will substantially overestimate the cost of power from wind energy technologies. There is also a significant amount of perceived knowledge about the cost and performance of wind power generation technologies that are not accurate or is misleading. Significant knowledge of the cost and performance of wind generation technologies is also viewed that is not right or misleading. This paper fills a significant information gap because there is a lack of precise, comparable, and the latest data on the costs and performance of wind turbines in Oman.
Studies on the viability and economic potential of wind energy have recently spread worldwide.
Kumar and Gaddada (2015) have explored the outputs of four statistical methods to evaluate Weibull parameters for wind energy applications in four selected sites, located in northern Ethiopia. Gaddada and Kodicherla (2016) have evaluated wind power capacity and wind energy cost estimates for electricity generation systems in eight selected locations in Tigray (Ethiopia). Kodicherla et al. (2017) explored the potential of wind energy and developed an economic assessment of the water pum** system in various wind power conversion systems. In three selected Fiji Island stations, Kodicherla et al. (2018) have investigated the potential of wind power-assisted wind hydrogen production using different types of turbines. The literature also reflects different foci around wind turbines. Many researchers have worked on defining the shape and structure of wind turbines and their effects on aerodynamics (Cai 2019; Nema et al. 2009; Akpinar and Akpinar 2006). Others have tried to improve the performance of current turbines by optimizing placement and hub height (Abdul-Wahab et al. 2019b; Elkinton et al. 2008).
Despite these efforts, the stochastic nature of wind speed makes wind energy generation difficult for some places (Padrón et al. 2019). A deep understanding of the specifications of each wind turbine and complete statistical data on wind velocity in any given location can begin to address this problem. These data must be processed and matched to a potential turbine to give a realistic and feasible answer to the suitability of any given piece of wind power equipment. In this paper, HOMER Pro software (HOMER Energy L.L.C., Boulder, Colorado, U.S.A.) was used to analyze wind data for the north and south of Oman and make a well-informed recommendation on the most suitable turbines for each region’s power needs. HOMER Pro software can combine data associated with wind regime, the specifications of wind turbines, and the power demands of consumers to estimate the cost of producing energy using different generators.
In this study, the researchers tried to estimate the potential for wind energy production in Oman’s north and south and suggest the feasibility of using wind turbines in the country. To this end, the performance of six different popular wind turbines was calculated and compared. By considering the performance and cost of energy (C.O.E.), suggestions on the best possible turbines for the north and south of Oman are provided.
Study areas
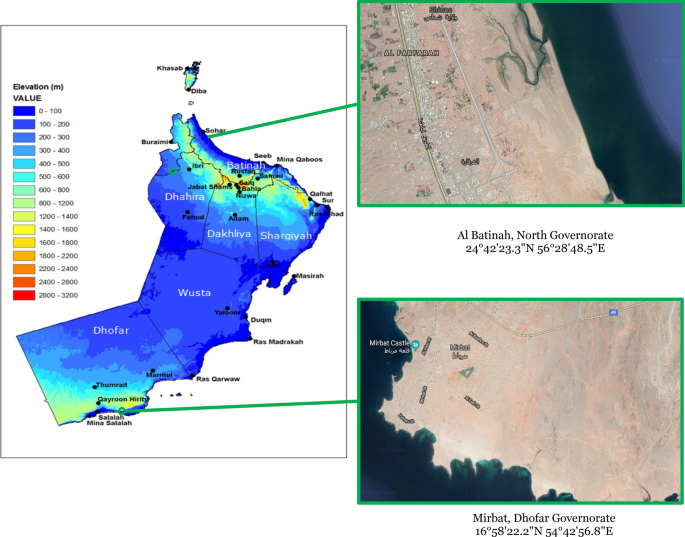
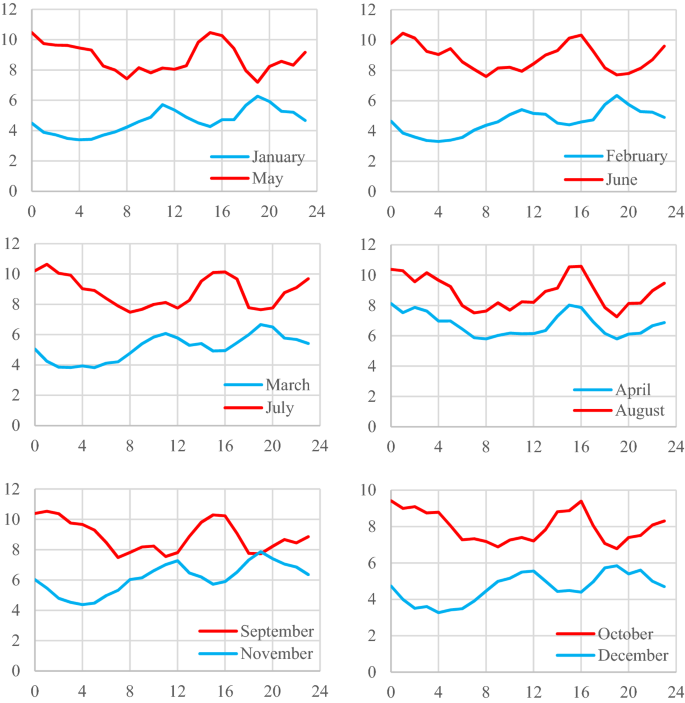
As has been mentioned previously, two locations were selected for the wind power plants. The northern site was located in Al Batinah North Governorate (24° 42′ 23″ N 56° 28′ 48″ E). The southern site was Mirbat, Dhofar Governorate (16° 58′ 22″ N 54° 42′ 56″ E) (Fig. 1). Both plants are located in rural areas with low populations and, therefore, low power demands. Population, power consumption per capita and power consumption patterns change power demands in an area. Demand also changes daily, hourly, and even in the summer and winter. The last reported data from Oman show that each Omani annually consumes around 6550 kWh on average (S.A.O.C 2017). Based on this information and the population of the area, the size of the wind power plant is considered at 10 MW. This size can cover current electricity consumption and any possible future growth. Even with a highly accurate prediction, real conditions can have unexpected variations. In order to consider this variation, the monthly 2% day-to-day random variability and 2% time-to-time step of random variability was considered. Figure 2 shows the power consumption patterns in Oman’s households. As can be seen in the figure, April to October is Oman’s summer season and has high electricity demand, while in wintertime, November to March, the power demand decreases significantly. The high demand for energy by cooling systems in the long summer of Oman is the main reason for this trend.
The location of the wind farms in north and south of Oman
Monthly average of power demand (MW)
HOMER software
Wind turbine performance analysis
A realistic estimation of power production requires accurate statistical data on wind velocity for an extended period, like a year or more, if possible. The accuracy of the output results entirely depends on the accuracy of this information. Wind velocity is usually measured on an hourly basis. Due to the high number of measurements in a calendar year, however, further processing for such an extended period would be time-consuming and difficult. Therefore, when making calculations based on such large data sets, the average wind velocity is usually used to reduce the processing load. Although using the monthly average seems practical, such a simple average can be misleading. For instance, by using a wind velocity of 0 m/s for 50% of the time and using a velocity of 6 m/s for the rest of the time, the simple average of the wind velocity would be 3 m/s.
Considering a wind turbine with a maximum output power of 3 m/s, the output performance would be wrongly calculated at 100% all day long. Such a system would have 100% output at 50% of the time at best. In order to address such miscalculations, in this research, the two-parameter Weibull distribution was used (Wang et al. 2018). In this method, both wind velocity and its probability over time are considered, and the distribution of the wind velocity is used for the following calculations (Moein et al. 2018). The probability density (f) and cumulative distribution (F) of the wind based on Weibull distribution are:
where c is the Weibull scale (m/s), and k is the Weibull shape factor.
The different wind turbines on the market have very different specifications. Considering and analyzing all of these turbines in this paper is not possible. Six of the most popular turbines on the market were selected and analyzed in order to make the article descriptive, rational, and practical. In some countries, other brands and models of turbines might be more popular, but the present approach can be used in those countries, too. In making this comparison, the C.O.E. production for each turbine must be calculated and compared carefully. Moreover, the whole system of a wind power plant consisting of one or more turbines must be able to handle the load demand of consumers with no or limited access to the main power line, for such a scenario where there is no access to the power grid, the power generation system has to be equipped with a sufficiently sized battery bank or a fossil fuel generator to cover non-windy hours or days. In order to simplify the problem and eliminate the calculation of fossil fuel generators, the system under consideration was conceptualized as having up to a 10% deficiency in a limited number of days. In real conditions, this amount of energy can be obtained from the main power lines (if accessible) or local generators. However, in this article, further calculations based on these generators were not considered.
Wind speed calculations represent the first phase of the HOMER Pro simulation. The wind velocity was measured and recorded every hour for 1 year. The system measured wind speed at a 10-m height above the sea level, which is the standard height for the measurement. Table 1 shows a sample of the measurements from the northern site for 1 week. For the calculation of the velocity at a different height (based on the height of each wind turbine), the measured values must be modified as in Eq. (3):
where \(V_{\text{Turbine}}\) and \(V\) show the wind velocity at the turbine and standard anemometer height, \(Z_{\text{Turbine}}\) and \(Z_{\text{anm}}\) are the height of the turbine and the anemometer (m) and \(Z_{0}\) is the surface roughness (m). Surface roughness characterizes the roughness of the field around the turbine. In this project, based on the local properties of the site location, \(Z_{0}\) was considered 0.03 m, which indicates a smooth field with some crops and no trees or buildings in the surrounding area (Homer-Energy 2016).
By combining the Weibull equation and Eq. (3), the average wind velocity can be written as:
And the output power in a wind turbine can be written in the form:
where \(\tau\) is the time, \(C_{p}\) is the turbine’s nominal capacity, and \(f_{v}\) is the wind velocity distribution.
The producers also provide the power curve of each turbine by testing different wind velocities. The power curve shows the real output power of the system in different ranges of wind velocity. Figure 3 shows the power curves of the six selected turbines with data extracted from the producers’ datasheet for the following turbine models:
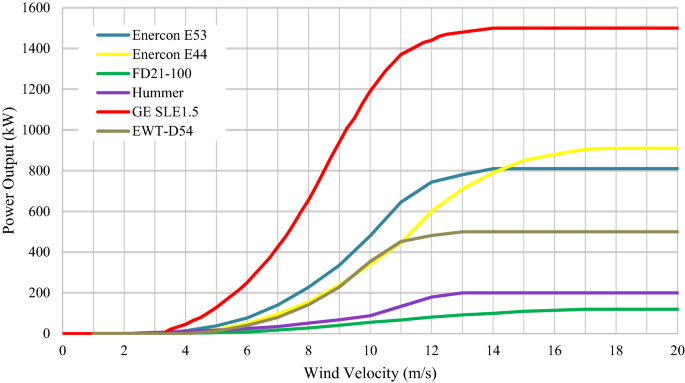
The power curves of the selected turbines
-
GE 1.5 SLE (GE Power, Schenectady, New York, USA).
-
Enercon E44 (Enercon, Aurich, Germany).
-
Enercon E53 (Enercon, Aurich, Germany).
-
FD21-100 (Enercon, Aurich, Germany).
-
EWT DW54 (Emergya Wind Turbines Pvt. Ltd., Amersfoort, The Netherlands);
-
Hummer H25.0–200 kW (Anhui Hummer Dynamo Co., Ltd., Hefei, Anhui, People’s Republic of China).
Economic analysis
In project planning, economic analysis is the most critical factor in decision-making. In this study, an economic analysis was the only indicator considered to show the feasibility of wind projects. Economic feasibility incorporates long-term performance, pointing to the best possible option among the wind turbines. In order to make an accurate estimation of economic feasibility, the total cost of the project must be calculated, including the capital cost (initial cost of the construction and devices), replacement cost as necessary, and maintenance costs. Operation costs should also be considered for the whole project. However, due to the low cost of operation in wind turbines, the operation cost can be considered part of maintenance costs. By accurately estimating these costs, the price of power generation per kW can be estimated. This price is a suitable indicator for choosing the best possible turbine for a wind power plant. In this research, the cost of energy (C.O.E.) per kW was the distinguishing feature considered among the turbines studied. HOMER sensitivity and optimization algorithms were used to select the best wind turbine (Pahlavan et al. 2018; Vahdatpour et al. 2017). The equations of the method of optimal system measuring, which has a minimum amount of total net present cost (N.P.C.), are as follows:
where Cann,total, C.R.F. i and Rproj are the total annual cost, cost recovery factor, real interest rate and lifetime of the project, respectively.
All costs and incomes are evaluated at a constant interest rate over the year. The actual interest rate resulting from inflation is calculated and the effect of the change in interest rate on final N.P.C. is applied to purpose of influencing inflation in calculations. The cost recovery factor (C.R.F.), which indicates the cost recovery over the N years, is calculated as follows:
Software is able to calculate the annual interest rate through the following equation:
Also, the cost of per kW of energy during the lifetime of the project is obtained by software from the following equation:
In the above equation, ELoad served is the real electric load in the hybrid system by unit kW/year.
Table 2 shows all costs associated with the selected turbines and which include:
-
The Capital cost is the initial purchase price,
-
The Replacement cost is the cost of replacing the generator at the end of its lifetime, the O&M cost is the annual cost of operating and maintaining the generator.
No energy battery storage system storage was taken into consideration for the current simulation focusing on the selection of the best wind turbine, and an annual interest rate of 6% was taken into account.
Results and discussion
Comparison between the proposed wind turbines
Implementing big data associated with turbine measurements and specifications is difficult. HOMER Pro helps analyze this data and simulate plans for 20 years. The results of the simulation for each turbine are presented in Table 3.
The main findings from the turbines simulation were as follows:
-
(a)
G.E. Energy 1.5 SLE This turbine is designed and manufactured by G.E. Power, a subsidiary of the General Electric Energy Company, and is a 1500-kW-rated power producer. This model has the highest power output among the selected turbines. It has a three-blade rotor with a 77-m diameter and 85-m hub height. The cut-in wind velocity for this model is 3 m/s, and the cut-off speed is 25 m/s. Cut-in and cut-off velocities can have a significant impact on the performance of the turbine. A turbine with a lower cut-off speed has the advantage of generating power in lower wind speed locations, like the north of Oman. The results of the simulation show that the C.O.E. for this turbine is USD$0.171 for each kW of energy in the north and USD$0.089 in the south. This cost contains the USD$1.75 million dollar maintenance cost for 20 years of operation and a capital cost of USD$3.38 million.
-
(b)
Enercon E44 This turbine, produced in Germany, has the second-highest power output of those considered, with a 900-kW-rated generator, 55-m hub height, and 44-m blade size. This Enercon production has a minimum cut-off wind velocity of 3 m/s, and a 28 m/s maximum cut-off. The HOMER Pro results showed that, by considering the capital cost of USD$2.34m and a maintenance cost of around USD$1 million, the C.O.E. would be USD$0.303 for each kW of energy in the north and USD$0.135/kW in the south.
-
(c)
Enercon E53 This turbine has a 53-m rotor diameter and 800 kW power production potential. Due to the lower power output, this model has lower capital and maintenance costs. Considering all of the costs of the turbine, the system would be able to generate power at USD$0.163/kW and USD$0.088/kW in the north and south, respectively.
-
(d)
FD21-100 This Enercon model uses GHREPOWER production with 100-kW output power. The lower output power makes it suitable for smaller wind power plants. FD21-100 has a 3–25 m/s range of working speed, and its highest possible hub height is 42 m. The HOMER Pro software simulation for this turbine showed that the C.O.E. would reach up to USD$0.290 per kW in the north and USD$0.144 kW in the south. In comparison to other turbines, this model has the highest cost of power generation for both locations.
-
(e)
DW54 This turbine is a 500-kW generator designed and produced by Energy Wind Technology (E.W.T.) in Amersfoort, The Netherlands. It has a 54-m rotor diameter and a working velocity between 3 and 10 m/s. With a USD$1.2 million capital cost and USD$750,000 maintenance cost over 20 years, the power generation cost would be USD$0.119/kW. This cost is the lowest possible for generating power in the north of Oman. However, the simulation showed that, due to differences in the wind regime in the north and south, this model is not the best possible option for the south. Each kW of energy produced in the south would cost USD$0.071. However, with its C.O.E., this model is the second best possible turbine for Oman’s north.
-
(f)
Hummer H25.0–200 K.W. This model is a 200-kW-rated wind turbine produced by the Anhui Hummer Dynamo Company of Hefei, China. In comparison to other analyzed turbines, this model has a lower cut-in wind velocity by 2.5 m/s and a smaller blade size (12 m). The simulation showed that while the capital cost of the turbine could be as low as USD$300,000, this model’s C.O.E. is not the best for all situations. In the north, power production would cost USD$0.132/kW. While this price is not the best possible option for the north, the results for the south are different. The simulation showed that the turbine would have the best possible results in the south among the selected models, generating power at USD$0.070/kW.
Considering the above-mentioned findings, the DW54 turbine is the best possible turbine for the north of Oman. On the other hand, the Hummer H25.0–200 KW turbine is the best option for Oman’s south. These models can generate electricity at the lowest possible cost. Figure 4 shows the graph of energy production cost for each turbine in the northern and southern sites.
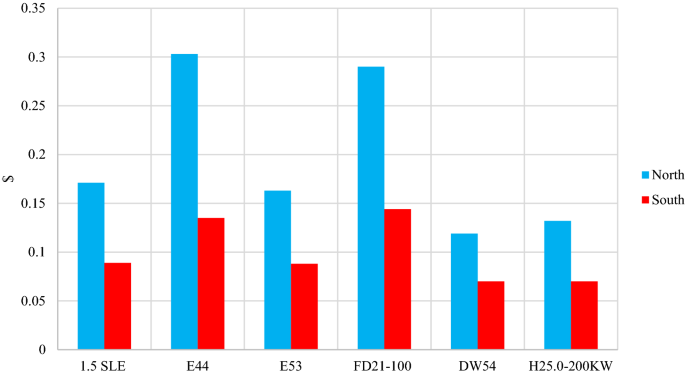
Cost of electricity for different turbines
Advantages of provided wind turbines over natural gas and diesel generators
The current power plants in Oman mostly use natural gas for electricity production. On the other hand, for off-grid consumers (some rural regions), the diesel generators are the primary source of electricity. It is clear that fossil fuel generators emit pollutant gases into the atmosphere and have negative impacts on the environment. In short, the diesel generator’s gas emission is calculated using the same energy production as the best wind turbines. For comparison, the unmet electrical load of wind turbines is considered (Fig. 5). Table 4 shows the emitted pollutant gases over one year of use. As it can be seen in Table 3, the wind turbine power plant in the north can stop the CO2 emission approximately 19,000 ton/year in comparison to natural gas and 28,000 ton/year in comparison to diesel. In the southern power plant, the reduced gas emission in comparison to diesel and natural gas are 18,000 and 12,000 ton/year, respectively.
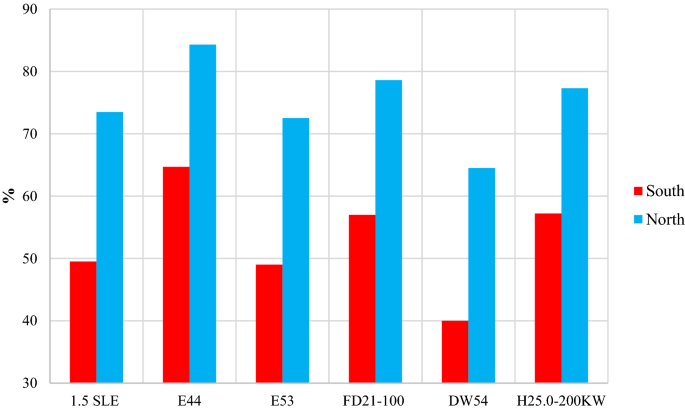
Unmet electrical loads for different turbines
Conclusion
In this study, the feasibility of using wind energy as a source of power production was calculated by collecting and analyzing hourly data on wind regimes over a 1-year period. HOMER Pro software was used to calculate the C.O.E. production of six different wind turbines, in order to select the most suitable wind turbine for two distinct locations in the north and south of Oman. The study’s main findings can be summarized as follows:
-
DW54 turbine produced by Energy Wind Technology in Amersfoort, The Netherlands, would have the best performance for Oman’s northern regions and can generate the cheapest possible energy from wind at $0.119/kW.
-
H25.0–200 kW turbine manufactured by the Anhui Hummer Dynamo Company of Hefeit, China, gives the best C.O.E. production for the southern regions of Oman and the lowest possible wind energy can be produced at $0.70/KW.
-
The difference of the wind regime between the northern and southern parts of Oman and the power curves of the turbines are the main reasons for the selection of two different wind turbines form different manufacturers.
-
The northern wind turbine plant is estimated to decrease CO2 emissions by around 19,000 tons per year, compared to natural gas, while diesel emissions by around by 28,000 tons per year.
-
The southern wind turbines have a potential carbon emission reduction of about 18,000 and 12,000 tons per year compared to diesel and natural gas.
The application of the turbine selection using the HOMER Model described in this paper determined that the H25.0–200 kW turbine selected for the southern parts of Oman has a C.O.E. that is 58.8% lower than the DW54 turbine that was selected for the northern parts of the country. The application of the method followed in this research by developers during the planning stage could significantly improve the financial performance of their investment. Similarly, such techniques could be added to tools such as WAsP to improve decision-making during the initial planning stage.
Availability of data and materials
Data are openly available with HOMER software. HOMER uses the monthly average wind speeds, plus four parameters (Weibull k, 1-h autocorrelation factor, Diurnal pattern strength and Hour of peak wind speed) to synthesize wind data for simulation.
Change history
17 January 2021
An amendment to this paper has been published and can be accessed via the original article.
References
Abdul-Wahab, S., Charabi, Y., Al-Mahruqi, A. M., et al. (2019a). Selection of the best solar photovoltaic (P.V.) for Oman. Solar Energy, 188, 1156–1168.
Abdul-Wahab, S., Fessehaye, M., Yetilmezsoy, K., et al. (2019b). Optimization of an inverted multi-stage double slope solar still: An environmentally friendly system for seawater purification. Desalination and water treatment, 141, 42–50.
Akpinar, E. K., & Akpinar, S. (2006). An assessment of wind turbine characteristics and wind energy characteristics for electricity production. Energy Sources, Part A433A: Recovery, Utilization, and Environmental Effects + A465, 28, 941–953.
Al-Suleiman, S., Fessehaye, M., Yetilmezsoy, K., Al-Ghafir, A., Al-Brashdi, A., Al-Hajri, N., & Al-Bulushi, S. (2019). Optimization of an inverted multi-stage double slope solar still: an environmentally friendly system for seawater purification. Desalination and Water Treatment, 141, 42–50. https://doi.org/10.5004/dwt.2019.23474.
Al-Yahyai, S., Charabi, Y., Al Badi, A., & Gastli, A. (2013). Wind resource assessment using numerical weather prediction models and multi-criteria decision making technique: Case Study Masirah Island, Oman. International Journal of Renewable Energy Technology.. https://doi.org/10.1504/IJRET.2013.051070.
Al-Yahyai, S., Charabi, Y., Gastli, A., & Al-Badi, A. (2012). Wind farm land suitability indexing using multi-criteria analysis. Renewable Energy, 44, 80–87. https://doi.org/10.1016/j.renene.2012.01.004.
Al-Yayai, S., & Charabi, Y. (2015). Assessment of large-scale wind energy potential in the emerging city of Duqm (Oman). Renewable and Sustainable Energy Reviews, 47, 438–447. https://doi.org/10.1016/j.rser.2015.03.024.
Cai X, Zhang Y, Ding W, et al. (2019) The aerodynamic performance of H-type darrieus V.A.W.T. rotor with and without winglets: C.F.D. simulations. Energy Sources, Part A: Recovery, Utilization, and Environmental Effects: 1–12.
Charabi, Y., Al Hinai, A., Al-Yahyai, S., et al. (2019). Offshore wind potential and wind atlas over the Oman Maritime Zone. Energy, Ecology and Environment, 4, 1–14.
Charabi, Y., Al-Yhyai, S., & Gastli, A. (2011). Evaluation of NWP performance for wind energy resources assessment in Oman. Renewable and Sustainable Energy Reviews, 15(3), 1545–1555. https://doi.org/10.1016/j.rser.2010.11.055.
Dolatabadi, A., Mohammadi-Ivatloo, B., Abapour, M., et al. (2017). Optimal stochastic design of wind integrated energy hub. IEEE Transactions on Industrial Informatics, 13, 2379–2388.
Elkinton, C. N., Manwell, J. F., & McGowan, J. G. (2008). Algorithms for offshore wind farm layout optimization. Wind Engineering, 32, 67–84.
Gaddada, S., & Kodicherla, S. P. K. (2016). Wind energy potential and cost estimation of wind energy conversion systems (W.E.C.S.s) for electricity generation in the eight selected locations of Tigray region (Ethiopia). Renewables, 2016(3), 10. https://doi.org/10.1186/s40807-016-0030-8.
Ghodsi, M., Ziaiefar, H., Mohammadzaheri, M., et al. (2019). Modeling and characterization of permendur cantilever beam for energy harvesting. Energy, 176, 561–569.
Homer-Energy (2016) HOMER pro version 3.7 user manual. HOMER Energy: Boulder, CO, U.S.A.
Khare, V., Nema, S., & Baredar, P. (2016). Solar–wind hybrid renewable energy system: A review. Renewable and Sustainable Energy Reviews, 58, 23–33.
Kodicherla, S. P. K., Gaddada, S., & Shaik, N. (2017). Wind energy potential and economic evaluation of WPS using WECSs in three selected locations of Northern Ethiopia. African Journal of Science Technology Innovation and Development., 9(2), 179–187. https://doi.org/10.1080/20421338.2017.1303990.
Kodicherla, S. P. K., Kan, C., & Nanduri, P. M. B. R. K. (2018). Likelihood of wind energy assisted hydrogen production in three selected stations of Fiji Islands. International Journal of Ambient Energy, 41(7), 823–832. https://doi.org/10.1080/01430750.2018.1492444.
Kumar, K. S. P., & Gaddada, S. (2015). Statistical scrutiny of Weibull parameters for wind energy potential appraisal in the area of northern Ethiopia. Renewables, 2, 14. https://doi.org/10.1186/s40807-015-0014-0.
Moein, M., Pahlavan, S., Jahangiri, M., & Alidadi Shamsabadi, A. (2018). Finding the minimum distance from the national electricity grid for the cost-effective use of diesel generator-based hybrid renewable systems in Iran. Journal of Renewable Energy and Environment, 5(1), 8–22. https://doi.org/10.30501/jree.2018.88377.
Moné C, Hand M, Bolinger M, et al. (2017) 2015 cost of wind energy review. National Renewable Energy Lab.(NREL), Golden, CO (United States).
Nema, P., Nema, R., & Rangnekar, S. (2009). A current and future state of art development of hybrid energy system using wind and PV-solar: A review. Renewable and Sustainable Energy Reviews, 13, 2096–2103.
Padrón, I., Avila, D., Marichal, G. N., et al. (2019). Assessment of hybrid renewable energy systems to supplied energy to autonomous desalination systems in two islands of the Canary Archipelago. Renewable and Sustainable Energy Reviews, 101, 221–230.
Pahlavan, S., Jahangiri, M., Sahamsabadi, A. A., & Ariae, A. R. (2018). Assessment of PV-based CHP system: The effect of heat recovery factor and fuel type. Journal of Energy Mangement and Technology., 3(1), 40–47.
Sahu, B. K. (2018). Wind energy developments and policies in China: A short review. Renewable and Sustainable Energy Reviews, 81, 1393–1405.
S.A.O.C. (2017) 7 Years Statement of Oman Power & Water Production. Oman Power & Water Procurement Co.
Sahu A, Gupta S, Singh VK, et al. (2018) Design of permanent magnet synchronous generator for wind energy conversion system. Advances in Smart Grid and Renewable Energy. Springer, 23–32.
Vahdatpour, S., Adfar, S. B., Siampour, L., Veisi, E., & Jahangiri, M. (2017). Evaluation of off-grid hybrid renewable systems in the four climate regions of Iran. Journal of Renewable Energy and Environment., 4(1), 61–70.
Wang, L., Yuan, J., Cholette, M. E., et al. (2018). Comparative study of discretization method and Monte Carlo method for wind farm layout optimization under Weibull distribution. Journal of Wind Engineering and Industrial Aerodynamics, 180, 148–155.
World-Bank. (2015). Renewable energy consumption (% of total final energy consumption). World Bank: Sustainable Energy for All database.
Yang, B., Yu, T., Shu, H., et al. (2018). Robust sliding-mode control of wind energy conversion systems for optimal power extraction via nonlinear perturbation observers. Applied Energy, 210, 711–723.
Acknowledgements
The authors would like to thank the anonymous reviewers for their insightful suggestions and careful reading of the manuscript.
Funding
The authors received no specific funding for this work.
Author information
Authors and Affiliations
Contributions
The first and the second author contributed to the design and implementation of the research, to the analysis of the results and to the writing of the manuscript. All authors read and approved the final manuscript.
Corresponding author
Ethics declarations
Competing interests
The authors declare no competing interests.
Additional information
Publisher's Note
Springer Nature remains neutral with regard to jurisdictional claims in published maps and institutional affiliations.
Rights and permissions
Open Access This article is licensed under a Creative Commons Attribution 4.0 International License, which permits use, sharing, adaptation, distribution and reproduction in any medium or format, as long as you give appropriate credit to the original author(s) and the source, provide a link to the Creative Commons licence, and indicate if changes were made. The images or other third party material in this article are included in the article's Creative Commons licence, unless indicated otherwise in a credit line to the material. If material is not included in the article's Creative Commons licence and your intended use is not permitted by statutory regulation or exceeds the permitted use, you will need to obtain permission directly from the copyright holder. To view a copy of this licence, visit http://creativecommons.org/licenses/by/4.0/.
About this article

Cite this article
Charabi, Y., Abdul-Wahab, S. Wind turbine performance analysis for energy cost minimization. Renewables 7, 5 (2020). https://doi.org/10.1186/s40807-020-00062-7
Received:
Accepted:
Published:
DOI: https://doi.org/10.1186/s40807-020-00062-7