Abstract
Background
High levels of serum lipopolysaccharide (LPS) were observed in sepsis patients with liver injury and high mortality. However, the role of liver in modulation LPS induced inflammatory injury was ill investigated. In the present study, the severity of LPS induced inflammatory response was observed after liver resection or portal branch occlusion to decreasing functional liver mass. The local and systemic damage was observed to investigate the role of liver in modulation inflammatory injury.
Methods
First, 30%, 70%, and 90% partial hepatectomy (PH) were performed, and serum TNF-α, survival rate, and hepatic LPS uptake was observed. Second, LPS-exposure of the functional liver mass was decreased by selectively blocking the RL prior to LPS-injection, which was given 30 min before a 70% PH, and the inflammatory response was compared in the occluded and the non-occluded liver. The control group was subjected to LPS injection 30 min prior to liver resection without blocking the RL transiently. The serum TNF-α, ALT, AST, creatinine levels, and urea levels, survival rate, hepatic LPS uptake, and hepatic inflammatory cytokines was observed.
Results
The decreasing of functional liver mass after 90%, 70%, and 30% PH was associated with decreased serum TNF-α, survival rate, and increased hepatic LPS uptake after LPS injection. Occluding the right lobes (RL) prior to LPS administration reversed the liver injury caused by 70% PH, indicated by 100% survival rate and decreased liver and kidney injury, and systemic inflammatory response. The induction of inflammatory response in occluding liver lobes were lower than un-occluding liver lobes.
Conclusions
The severity of the LPS-induced systemic inflammatory injury is determined by functional liver volume. This observation suggests that the liver is the central organ for the initiation of the inflammatory response, and is involved in causing a severe SIRS with systemic damage and death.
Introduction
SIRS leads to multi-organ dysfunction (MOD), such as the hepato-renal and hepatopulmonary syndrome. Initiation and course of MOD is not well understood. It is not known which organ primarily triggers the LPS-response and induces the damage and functional impairment in other organs. The standard model of SIRS is the endotoxemia model. Typically, endotoxemia is induced by intraperitoneal or intravenous injection of LPS. In these models, the inflammatory injury can be observed on a systemic level.
LPS is the main component of gram negative bacteria, and induces an inflammatory response in mammalian species [1]. LPS binds to LPS binding protein (LBP), and CD14, which initiates the inflammatory response by triggering the production of inflammatory cytokines via activation of the TLR4 signal pathway [2].
The activation of inflammatory response is beneficial for inducing LPS and bacterial clearance. However, the inflammatory response may become deleterious if circulatory LPS become abundant, leading to tissue damage, multi-organ dysfunction, and death [3].
The contributions of the individual organ such as the liver to the systemic inflammatory response remain unclear. The pathophysiological relationship between endotoxemia, SIRS, and multi-organ dysfunction is not well explored, in part because of the lack of suitable animal models.
In the present study, we established a new model to investigate the role of liver in triggering and modulating the LPS induced systemic response and injury. In this model, the hepatic LPS uptake was increased by either removing or occluding liver lobes. Our results indicated that decreasing hepatic LPS uptake by transient occlusion of the right liver lobes of a rat decreased the local hepatic as well as the systemic injury, and the over-all mortality.
Materials and methods
Experimental design
The relationship between liver mass and induction of inflammatory response was explored by performing partial hepatectomy (PH) removing 30%, 70%, and 90% of the liver mass immediately before LPS administration (2 mg/kg, intravenous injection, E. coli serotype O55:B05 type, Sigma-Aldrich, St. Louis, USA). Survival rate at 24 h was observed (n = 6 per group). In order to investigate the induction of inflammatory response, rats were sacrificed 1 h after LPS injection (n = 3 per group), and the histology, serum TNF-α levels, and hepatic LPS uptake were used as read-out parameter.
In order to investigate the effect of liver volume and LPS exposure on the severity of inflammatory injury, a novel surgical model was designed. The hepatic LPS exposure was inhibited by occlusion of the right liver lobes immediately before LPS injection. The 70% PH was performed 30 min after LPS injection (Additional file 1: Figure S1). In control group, the LPS was injected, and the 70% liver mass was recected without RL occlusion. Survival rate was determined within a 24 h observation period (n = 6). In order to investigate the effect of hepatic LPS exposure on inflammatory severity, a kinetic experiment was performed. The LPS (2 mg/kg) was injected, and the rats were sacrificed at 0.5 h, 1 h, 6 h, and 24 h (n = 6 per group). Blood samples as well tissue samples from liver, and kidney were taken for further investigation. Induction and severity of the inflammatory response in terms of survival rate, systemic and local inflammatory injury was compared.
Animals
Male Lewis rats (12 weeks old, body weight 250 ± 50 g; Charles River, Sulzfeld, Germany) were used in this study. All animals were housed under standard animal care conditions and had free access to water and rat chow ad libitum. Animals were allowed to adapt to laboratory conditions for 7 days. The permission for animal experiments was given by the “Thüringer Landesamt für Verbraucherschutz; AZ: 2226840402026/13), and were performed under inhalation anesthesia with 3% isoflurane (Sigma Delta, London, UK).
Surgical model
Liver resection was performed by removing the left lateral lobe (30%PH) and the median lobe (about 70% liver volume) and the right lobes (90%PH). Blood samples were taken repeatedly every 15 min until 90 min for assessment of systemic TNF-a level. One group of animals was observed for up to 24 h to determine the survival rate.
In the clam** experiment, the rats were divided to LPS + 70% PH group and liver occlusion+LPS + 70% PH group. In LPS + 70% PH group, the rats received an intravenous LPS-injection (2 mg/kg) immediately after removing of 70% liver mass (median lobe + left lateral lobe). In liver occlusion+LPS + 70%PH group, the blood flow to right lobes was blocked by clam** the portal branch of right lobes (20% liver mass). After right lobes ischemia, LPS (2 mg/kg) was injected intravenously. Then, the right lobes were re-perfused 30 min after LPS injection, and 70% of liver mass (median lobes + left lateral lobe) was resected at the same time (Additional file 1: Figure S1).
Organ injury
Liver injury was investigated by measuring the serum level of liver enzymes (AST, and ALT) using an Automated Chemical Analyzer (Bayer Advia 1650; Leverkusen, Germany). Kidney damage was assessed by measuring serum creatinine and urea levels using the Automated Chemical Analyzer.
Histological staining
Liver, kidney tissues were fixed in 4.5% buffered formalin for 48 h, and were embedded by paraffin. Sections of 4 μm thickness were cut and stained with Hematoxylin-Eosin. The stained slides were digitalized using a slides scanner (Hamamatsu Electronic Press Co., Ltd., Lwata, Japan), and evaluated by one experienced pathologist (OD), and two experienced scientists (FH, and LA), according to a standardized semi-quantitative scoring system as described before [4].
LPS-immunohistochemistry (IHC)
Liver sections were used for LPS staining. The antigen retrieval was performed by using 10 mM Citrate buffer (pH 6.0) for 20 min at room temperature. Sections were washed 3 times with TBST, and incubated with the hydrogen peroxide for 5 min. After another 3 washes with TBST, sections were incubated with protein blocking buffer. After protein blocking, the slides were incubated with polyclonal mouse anti-LPS antibody (1:100, Abcam, Cambridge, UK) for 15 min. Signals were amplified by using CSAII system (Dako, Glostrup, Denmark), and the counterstaining was performed by dip** the slides into Hematoxylin for 5 min. The stained sections were digitalized using the slide scanner, and evaluated as described before [5]. A semi-quantitative system was used to evaluate the LPS staining: negative staining = < 10% positive cells; less positive staining = 10–40% positive cells; moderate positive staining = 40–70% positive cells; positive staining = 70–100% positive cells.
Naphthol-AS-D-chloroacetate Esterase (ASDCL) staining
Hepatic neutrophil infiltration was evaluated by ASDCL staining as reported previously. The neutrophil infiltration was evaluated by selecting 10 high-power fields (HPF) pictures with the magnification of 200 × randomly, followed by manual counting of all positively staining neutrophils. The results were analyzed by calculating the mean number of ASDCL positive neutrophils per HPF.
Enzyme-linked Immunosorbent Assay (ELISA)
The commercially available ELISA kits (R&D Systems, Minneapolis, US) were used for detecting serum TNF-α level. The procedure was done according to the manufacturers suggestions. The plates were measured by using an ELx 808 ELISA reader (Bio-Tek Instruments Inc., Winooski, VT, US) at 450 nm.
Quantitative polymerase chain reaction (PCR)
Total RNA was isolated from liver, and kidney tissues using the RNeasy kit (Qiagen, Hilden, Germany), and the complementary DNA was synthesized using the First-Strand cDNA synthesis kit (Invitrogen, Carlsbad, USA). The quantitative PCR reaction was performed by using 1 μg of cDNA, and Brilliant qPCR Master Mix kit (Agilent, Santa Clara, USA). The sequences of primers and probes were listed: hypoxanthine guanine phosphoribosyltransferase (HPRT): GACCGGTTCTGTCATGTCG, ACCTGGTTCATCATCACTAATCAC, and Probe #95; TNF-α: TGAACTTCGGGGTGATCG, GGGCTTGTCACTCGAGTTTT, and Probe #63; IL-6: CCTGGAGTTTGTGAAGAACAACT, GGAAGTTGGGGTAGGAAGGA, and Probe #106; CCL2: AGCATCCACGTGCTGTCTC, GATCATCTTGCCAGTGAATGAG, and Probe #62; CCL3: GCGCTCTGGAACGAAGTCT, GAATTTGCCGTCCATAGGAG, and Probe #40. The standard curve was generated using a serial dilution of a normal sample. Gene expression was normalized using hypoxanthine guanine phosphoribosyltransferase (HPRT) [Full size image
A kinetic experiment was performed to investigate the local inflammatory response. In the kinetic experiment, the local expression of pro-inflammatory cytokines was compared between the occluded liver lobes and non-occluded liver lobes 0.5 h, 1 h, 6 h, and 24 h after the re-perfusion. The results revealed that the expression of TNF-α, IL-6, CCL-2, and CCL-3 mRNA was significantly higher in non-occluded lobes compared to the occluded lobes (Fig. 3a-d). Moreover, the infiltration of neutrophils as visualized by ASDCL staining in non-occluded liver lobes was also significantly higher than in the occluded liver lobes (Fig. 3e).

The systemic inflammatory response and organ damage was decreased by reducing LPS-load in the liver. a-b liver occlusion inhibited the LPS induced hepatic TNF-a (a), and IL-6 (b) mRNA expression. c-d The expression of CCL-2 and CCL-3 mRNA levels in liver tissues. LPS induced upregulation of hepatic CCL-2 (c) and CCL-3 (d) mRNA expression was inhibited by liver occlusion. e The hepatic influx of neutrophil was analyzed by counting ASDCL positive cells. The neutrophil infiltration to occluded liver lobes was significantly lower compared to non-occluded lobes. *P<0.05, **P<0.01
The systemic inflammatory response and organ damage was decreased by reducing the LPS-load in the liver
Using samples from the same experiment, the systemic inflammatory response, and tissue injury was compared. As shown in Fig. 4a, the serum TNF-α levels in LPS + 70%PH + liver occlusion group were significantly lower than in LPS only group, and LPS + 70%PH group. Occlusion of RLs decreased the liver and kidney damage, as indicated by decreased serum ALT, Creatinine, and urea acid levels (Fig. 4b-d) The organ damage was also evaluated by the morphological changes in liver, and kidney (Fig. 4e), respectively. Rat subjected to LPS injection followed by 70% PH showed severe organ damage after 6 h observation time in liver, and kidney, such as marked vacuolar degeneration of tubular cells in kidney, sinusoidal dilatation and erythrocyte congestion in liver. Blockade of LPS hepatic uptake by liver occlusion was associated with substantially less damage as indicated by the minimal histopathological changes.
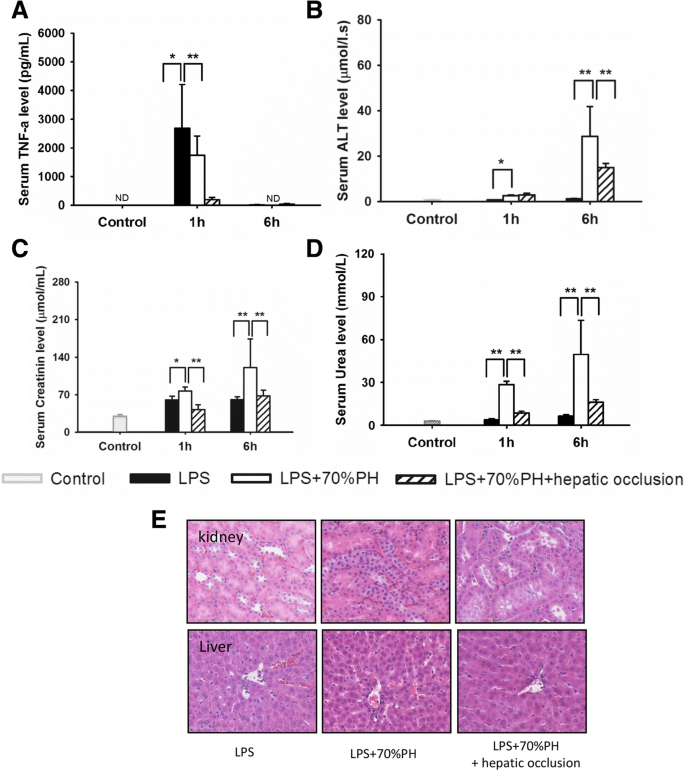
Blockade of hepatic LPS uptake by liver occlusion decreased systemic inflammatory response. a Blockade of hepatic LPS uptake by liver occlusion decreased the serum TNF-a levels. b Blockade of hepatic LPS uptake by liver occlusion decreased the release of liver enzyme ALT. c-d blockade of hepatic LPS uptake by liver occlusion decreased the creatinine (c), and urea (d) levels. e The morphological changes was evaluated by performing HE staining in kidney, and liver. Representative images from 6 rats per group were selected. Original magnification × 200. *p < 0.05, **p < 0.01 Data are shown as mean ± SD
