
Abstract
In modern fossil and nuclear power plants, the components are subjected to creep, fatigue, and creep-fatigue (CF) due to frequent start-up and shut-down operations at high temperatures. The CF interaction on the in-service P92 steel welded joint was investigated by strain-controlled CF tests with different dwell times of 30, 120, 300, 600 and 900 s at 650 °C. Based on the observations of the fracture surface by scanning electron microscope (SEM), the characteristic microstructure of fatigue-induced damage was found for the CF specimens with short dwell times (30 and 120 s). The hardness, elastic modulus and creep deformation near the fracture edges of four typical CF specimens with 30, 120, 600 and 900 s dwell times were measured by nanoindentation. Compared to specimens with post-weld heat treatment (PWHT), lower hardness and creep strength were found for all CF specimens. In addition, significant reductions in hardness, elastic modulus, and creep strength were measured near the fracture edges for the CF specimens with short dwell times compared to the PWHT specimens. Compared to PWHT specimens (0.007), the increased strain rate sensitivities (SRS) of 0.010 to 0.17 were estimated from secondary creep. The increased values of SRS indicate that the room temperature creeps behavior is strongly affected by the decrease in dislocation density after the CF tests.
1 Introduction
Creep-fatigue (CF) interaction is an important type of damage for the design of high temperature components and the evaluation of the structural integrity of nuclear power plants and fossil fuels [1]. It’s a complex loading resulting from creep deformation during long-term operation at high temperatures and accumulated fatigue damage due to frequent start-up and shutdown operations. The creep failure is promoted by the formation and growth of creep voids at the grain boundaries [2, 3], while the fatigue failure is mainly due to the initiation and transgranular propagation of surface cracks [4, 5]. The linkage and interaction of the two types of damage lead to accelerated fracture of alloys. In strain-controlled CF experiments, creep damage is produced in the dwell time (holding time) at peak tensile or compressive strains. The effect of dwell time on the high-temperature CF behavior of alloys has been widely studied in recent years [4, 6,7,8]. Chen et al. [4] suggested that creep-fatigue strain increases local deformation, leading to internal intergranular cracking and accelerated failure of Ni-based alloys. Alsmadi et al. [6] found that the lifetime of CF decreased with increasing holding time, indicating higher crack initiation and growth rate of Alloy 709. Nevertheless, there are few studies on the behavior of heterogeneous materials or structures related to holding time of CF.
A355 P92 steel is widely used in the main steam lines of ultra-supercritical generators at 650 °C due to its excellent creep resistance [9]. However, it’s been frequently reported that welded joints made of P92 steel fractured prematurely under creep or creep-fatigue loading at 600–650 °C [10, 11]. This is a critical problem that threatens the safety of operating power plants and confuses the evaluation of structural integrity. The phenomenon of premature fracture can be qualitatively explained by the inhomogeneity of the welded joint, which consists of the base the metal (BM), the weld metal (WM), and the heat-affected zone (HAZ). The heat-affected zone can be divided into the fine-grain heat-affected zone (FGHAZ) and coarse-grain heat-affected zone (CGHAZ) depending on the grain size. Researchers found that the premature fracture occurred in the BM region of Cr-Mo steel weldment under low-cycle fatigue (LCF) [12, 13], while it occurred in the FGHAZ region after long-term creep referred to IV-type fracture [10, 11]. In the interaction between creep and fatigue, the fracture position of the welded joint strongly depends on the prevailling damage (fatigue or creep). During the propagation of a fatigue crack, the change in mechanical properties near the crack tip has great influence on the propagation rate. It’s generally accepted that creep voids form and grow more easily near the crack tip [14, 15], which reduces the mechanical properties near the crack tip and acceleretes the propagation speed. In addition, the materials are subjected to high stresses, as a high stress concentration may occur around the crack tips and creep voids if they remain for a long time. This local high stress level could promote the accumulation of creep deformation around the main cracks and creep voids. Therefore, the local creep behavior near main cracks or creep voids should be investigated. However, there’s not enough reseach on the creep behavior near main cracks (fracture edges) at the micro level. Nanoindentation technique is widely used to study the mechanical properties such as hardness, elastic modulus and creep deformation at room temperature of films, high entropic alloys, ceramics and heterogeneous materials at micro/nanoscale [16,17,18,19,20,21]. Due to the high stress field under the nanoindentation indenter, the time-dependent deformation (creep) was clearly observed within only 500 s at room temperature [16,17,18,19,20]. This creep deformation could sufficiently reflect the local creep resistance near cracks or creep voids under high stress. In Refs. [22,23,24], the room-temperature creep behavior and strain rate sensetivity (SRS) were investigated in the BM, FGHAZ, CGHAZ and WM of P92 steel welds under prior CF loading. On the other hand, the creep behavior near the fracture edge (main cracks) of the CF-tested P92 steel welded joint has not been sufficiently investigated.
In this paper, the interaction between creep and fatigue of P92 steel welds is investigated by performing a series of strain-controlled CF tests with dwell times of 30, 120, 300, 600, 900 s at 650 °C. The hardness, elastic modulus and creep deformation were measured near the fracture edges of four typical CF specimens with dwell times of 30, 120, 600 and 900 s by nanoindentation. The strain rate sensetivities were estimated from secondary creep. Based on the observation of the fracture surface by scanning electron microscope (SEM), the intercation between creep and fatigue on the local creep behavior near the fracture edges of the P92 welded joint were systematically investigated.
2 Materials and Experimental Procedure
2.1 Materials
In this paper, we’re concerned with a commercial Chinese P92 steel pipe whose cross sections have a diameter, thickness and length of 840 mm × 80 mm × 600 mm. Two pipes were welded together using gas tungsten arc welding (GTAW) and submerged arc welding (SAW). The welded pipe was subjected to the post-weld heat treatment (PWHT) at 760 °C for 2 h followed by air cooling. Non-destructive testing was then performed to ensure that the welded joint met industrial requirements. The typical chemical composition range for P92 steel and the specific compositions of the alloy and filler metal are listed in Table 1.
To observe the microstructural inhomogeneity, the weld of P92 steel was etched with a mixture of 92 mL water, 4 mL hydrofluoric acid and 4 mL nitric acid. The microstructures of all regions (BM, FGHAZ, CGHAZ and WM) were examined by confocal laser scanning microscopy (LSCM, OLYMPUS OLS4500), as shown in Figure 1.

Microstructures in the (a) BM, (b) FGHAZ, (c) CGHAZ and (d) WM regions for PWHT weld joint
2.2 Creep-fatigue Experiment Details
The initial mechanical properties of the specimens are different for the five sampling sites of the 9%Cr welded joint [23]. Therefore, all specimens were cut at the same weld location using electrical discharge machining (EDM) to ensure similar initial mechanical properties. Figure 2 shows a schematic diagram of the specimen removal position for the test specimens. The CF tests were performed in the electronic high-temperature creep fatigue testing machine (RPL 300), whose maximum loading capacity was 100 kN. Trapezoidal waveforms were used for the CF tests. Strain amplitudes were set constant at 0.2% and strain rates at 0.001 s-1. The compression dwell time was 30 s, while the tensile dwell time was set as 30, 120, 300, 600, and 900 s, respectively. The instantaneous deformation in the gauge length of the specimen was measured during the CF tests using a strain transducer (Epsilon), where the initial gauge length was 25 mm and the data acquisition frequency was set as 10 Hz. All specimens were stored at a test temperature of 650 °C for at least half an hour before the experiments began. During the test, the temperature variation was strictly maintained at 1 °C using three S-type thermocouples attached to the top, middle and bottom of the specimen.

The illustration of the position and geometry of CF specimens from the P92 steel welded joint
2.3 Details of Nanoindentation Experiment
The nanoindentation experiments were carried out using an Agilent Nano Indenter G200 at room temperature. The samples for nanoindentation were cut from the PWHT and CF-tested samples using the EDM method. Prior to nanoindentation, all samples were polished to a specular surface using a polishing machine (MP-1A). The surface roughness (Ra) of the polished samples was less than 1 nm. A typical surface topography diagram for an area of 489.5 × 489.5 μm2 is shown in Figure 3. Four test positions were plotted based on the distance to the fracture edge at 50, 150, 250, and 350 μm, as shown in Figure 4. Using a standard Berkovich indenter, the hardness and elastic modulus of each region were first measured using the continuous stiffness modulus (CSM) at a constant strain rate of 0.05 s−1. The maximum penetration depth was 2000 nm. Then, the constant load holding method was used to investigate the local creep behavior. Since pronounced creep deformation is caused by higher initial penetration depth during nanoindentation [19, 24], all initial penetration depths were fixed at 1000 nm. The nanoindentation creep tests were performed for 500 s with a strain rate of 0.05 s−1 for the PWHT and the typical CF test specimens. To ensure the reliability of the nanoindentation results, eight indentations were made in each area, and the distance between two adjacent indentations was more than 50 μm. The nanoindentation tests were performed until the thermal drift was < 0.05 nm/s. The thermal drift correction was strictly calibrated to 10% of the maximum load after the unloading period.
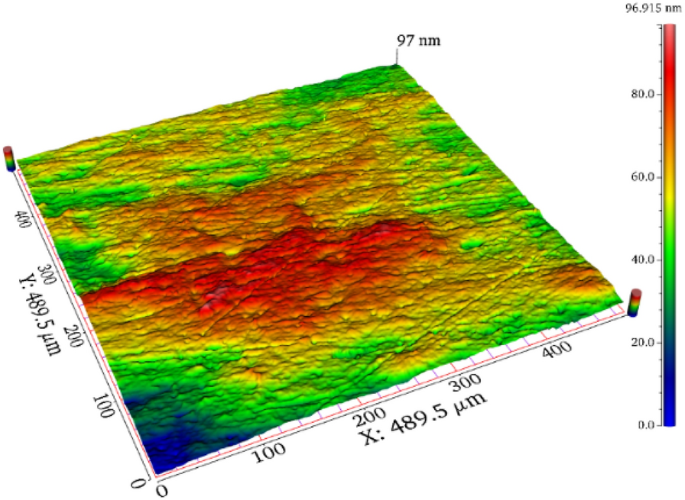
The typical micro-surface topography in the area of 489.5×489.5 μm2 for the polished sample prior to nanoindentation
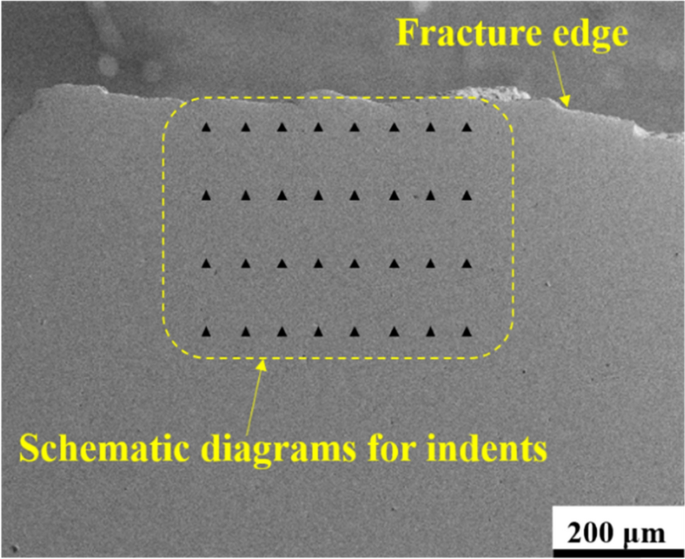
Schematic diagrams of nanoindentation position for CF-tested specimens
3 Results and Discussion
3.1 Microstructural Evolutions Under Creep-fatigue Interaction
The changes in CF life as a function of dwell times (30, 120, 300, 600 and 900 s) for the welds are shown in Figure 5. All CF-tested specimens fractured in the BM region. Since it’s tedious and time consuming to perform nanoindentation for each specimen in Figure 5, the four typical specimens (whose CF lifetimes are close to the average) were selected for different dwell times (30, 120, 600 and 900 s). The CF samples with a dwell time of 300 s were not selected because the remarkable discreteness of their CF life. The CF lifetimes of four typical specimens were 1803 for dwell time of 30 s, 2312 for dwell time of 120 s, 967 for dwell time of 600 s and 417 for dwell time of 900 s, respectively. It is clear that the lifetime of CF decreased with increasing dwell time in the range of 120 to 900 s. This observation is consistent with the change in CF lifetime with increasing dwell time for P92 steel [15]. Nevertheless, the improved CF lifetime with increasing dwell time is observed in the range of 30 to 120 s dwell times. This phenomenon is not reported for the P92 steel welded joint due to the limited data for CF testing.
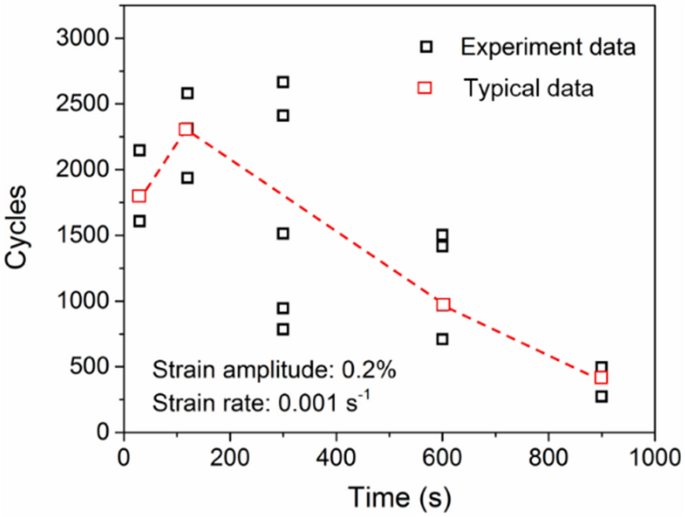
The effect of dwell time (30, 120, 300, 600 and 900 s) on the number of cycles to failure for 9%Cr steel welded joint at 650 °C
To investigate the change in CF life with different dwell times, the peak tensile stress per cycle was plotted as a function of normalized CF life (N / Nf ) for the four typical CF samples in Figure 6. N is the number of instantaneous cycles, and Nf represents the number of failure cycles. Figure 6 shows two different softening behaviors for long dwell times (600 and 900 s) and short dwell times (30 and 120 s). For the CF specimens with short dwell times, three levels can be seen in Figure 6. To illustrate the CF samples with a dwell time of 30 s: in the first stage (0–10% CF lifetime), the peak tensile stress decreases from about 255 to 200 MPa. Then, a stationary stage (10%–60%) occurs where the peak tensile stress decreases slightly from 200 to 155 MPa. The third stage of the CF specimen starts at 60% of the life, and finally the specimen breaks. This softening behavior was also observed by Zhang et al. [15] when working on P92 steel in the circumferential direction. It is also observed that the stress level of the CF specimen with 120 s dwell times is slightly lower than that of the specimen with 30 s dwell time in all phases. However, only two stages are observed for the CF specimens with long dwell times, as shown in Figure 6. For the sample CF with 900 s dwell, the peak tensile stress decreases rapidly from 270 to 225 MPa in first 10% of the lifetime. The decreasing rate becomes slow and remains almost constant, and the stress is then linearly reduced from 225 to 200 MPa during the remaining CF lifetime. It is also observed that the peak tensile stress level (from 250 to 200 MPa at the first stage, from 200 to 175 MPa at the second stage) is lower in CF with 600 s dwell time at both stages than with 900 s dwell time. The excessive stress level of CF specimen with long dwell times may exceed the capacity of cyclic resistance of P92 steel welded joint and eventually lead to premature fracture. The inelastic strains for the four typical specimens were estimated from their hysteresis loops at a 50% lifetime fraction. The inelastic strains of the different dwell times were 0.251% (30 s dwell), 0.247% (120 s dwell time), 0.281% (600 s dwell time) and 0.282% (900 s dwell time). The increased inelastic strain could be the reason that the long dwell time leads to high peak tensile stress. Moreover, the significantly increased inelastic strain from 120 s dwell time to 600 s dwell time could also lead to the two cyclic softening processes.
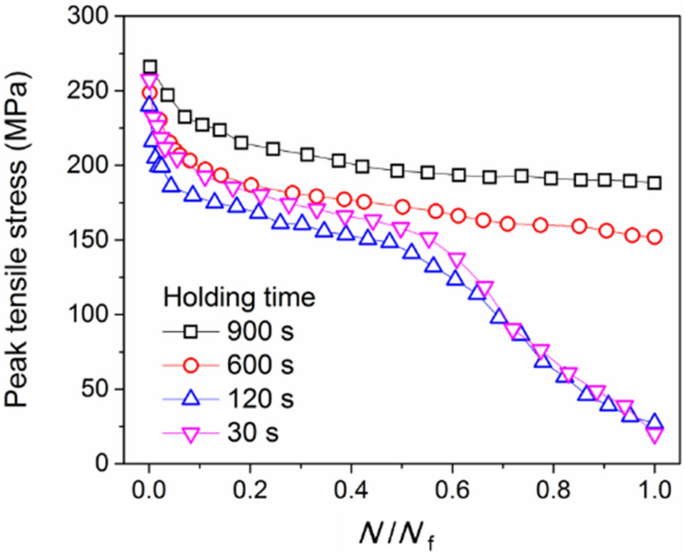
Cyclic softening curves during creep-fatigue (CF) tests at different dwell time
Stress relaxation is considered a process of creep damage accumulation in strain-controlled CF experiments. On the other hand, the stress-strain behavior response of the first cycle and the cyclic loading corresponding to 50% of the CF life are two representative behaviors to show the interaction between creep and fatigue in alloys [26,27,28]. Therefore, the stress relaxation histories of the first cycle and the 50% CF life (901 for a dwell time of 30 s, 1506 for a dwell time of 120 s, 483 for a dwell time of 600 s, and 208 for a dwell time of 900 s) are shown in Figure 7. For the first cycle of four typical specimens, a good overlap of the stress relaxation behavior can be seen in Figure 7(a). The stress decreases rapidly from 270 to 125 MPa in the first 40 s. After that, the stress slowly decreases and slightly decreases to 80 MPa with the dwell time. At the cyclic loading corresponding to 50% life (CF), the peak tensile stress values were different for the four specimens: 160 MPa at a dwell time of 30 s, 155 MPa at a dwell time of 120 s, 175 MPa at a dwell time of 600 s and 200 MPa at a dwell time of 900 s, as shown in Figure 7(b). At the end of the dwell time, the stress was 110 MPa at a dwell time of 30 s, 70 MPa at a dwell time of 120 s, 80 MPa at a dwell time of 600 s and 110 MPa at a dwell time of 900 s. Since the dwell time for a typical specimen is only 30 s, the stress is not completely relieved even in the first 40 s of stress relaxation. The stress level of CF specimen with a dwell time of 30 s is the highest among the four typical specimens in the first cycle and at 50% lifetime. For the remaining three samples, the stress level increases with increasing dwell time at 50% CF lifetime. This observation indicates that the higher stress level contributes to the lower CF lifetime at longer dwell time. In addition, the excessively high stress level in the CF sample with 30 s dwell time leads to a shorter CF lifetime than in the CF sample with 120 s dwell time.
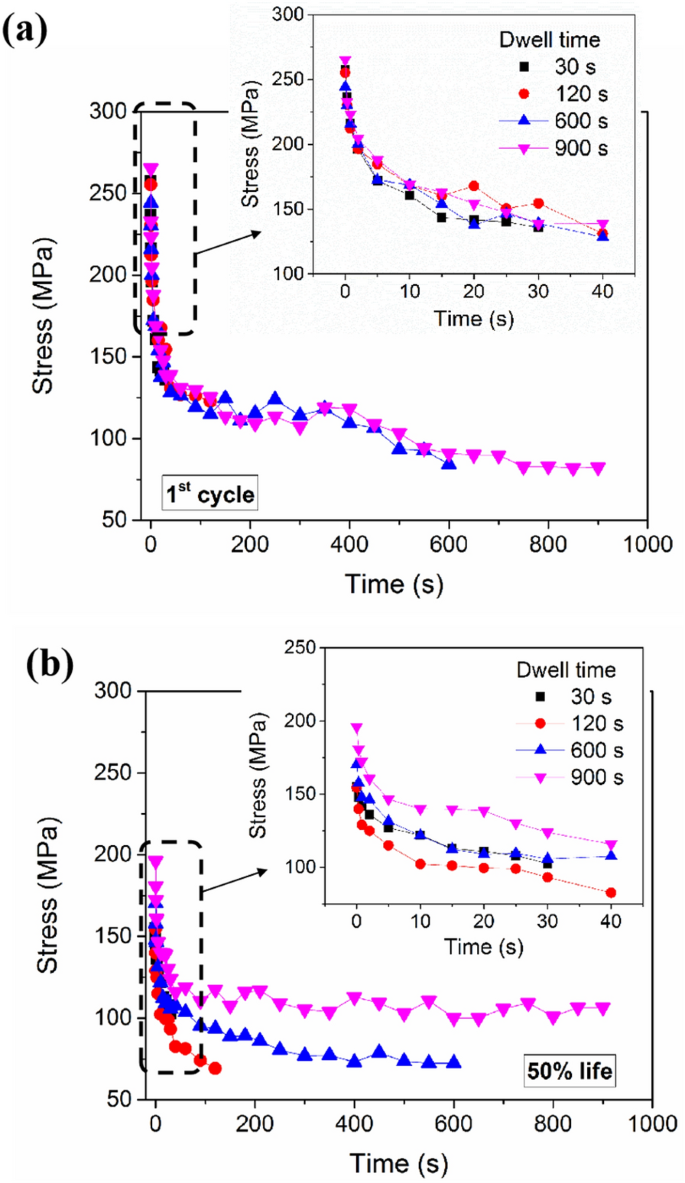
The stress relaxation during the different dwell periods of 1st cycle and 50% life for the typical CF specimens
Using scanning electron microscope (SEM), the fracture morphologies of CF samples with dwell time of 30 s, 120 s, 600 s and 900 s are shown in Figure 8(a)–(d). Figure 8(a) and (b) shows that the fracture surfaces of CF specimens with short dwell time (30 s and 120 s), have fatigue striations, while no creep voids are seen in the fracture morphology. This indicates that fatigue is the predominant damage mechanism for the CF short dwell time specimens. In contrast, creep voids were observed in the fracture surfaces of the CF short dwell time specimens (600 s and 900 s), as shown in Figure 8(c) and (d). The size of the creep voids increase with the increasing dwell time, about 20 μm at dwell time of 600 s and 40 μm at dwell time of 900 s. On the other hand, the creep voids were surrounded by fatigue striations, as shown in Figure 8(c) and (d). This observation suggests that the interaction between creep and fatigue is the dominant damage mechanism for CF specimens with long dwell time. Figure 9(a) and (b) shows the two fracture mechanisms schematically. In Figure 9(a), the fatigue cracks developed in the surface of the specimens with short dwell time and then propagated transgranularly until the specimen fractured. For the specimens with long dwell time, the fatigue cracks also formed at the surface, while the creep voids formed at the grain boundaries. During the creep-fatigue process, the fatigue cracks met the large creep voids and propagated until the specimen fractured, as shown in Figure 9(b). This interactive creep-fatigue fracture mechanism was able to accelerate the propagation rate of the cracks and led to premature failure of the P92 welded joint.
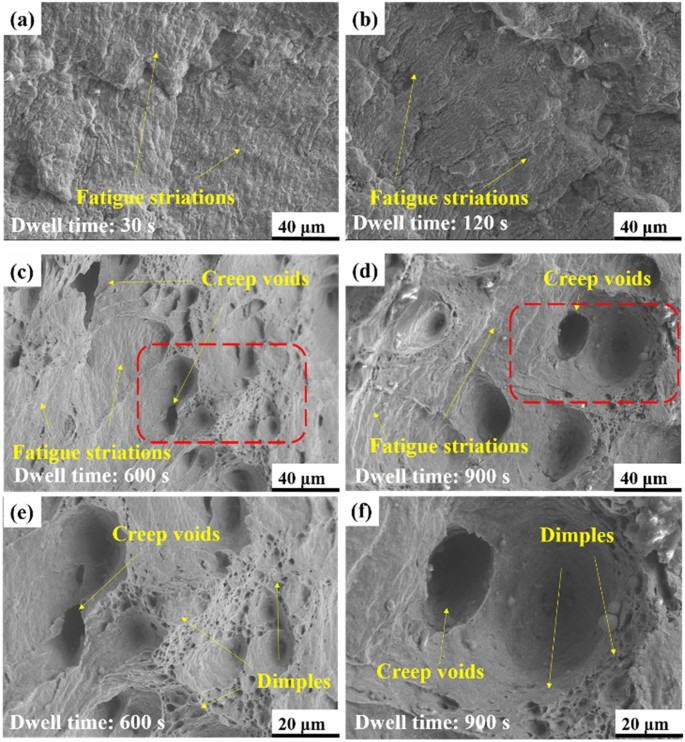
Fracture morphologies of CF specimens with dwell time of (a) 30 s; (b) 120 s; (c) 600 s and (d) 900 s; (e) and (f): the fracture morphologies of the areas, which were surrounded by red dash lines in (c, d) at high magnification
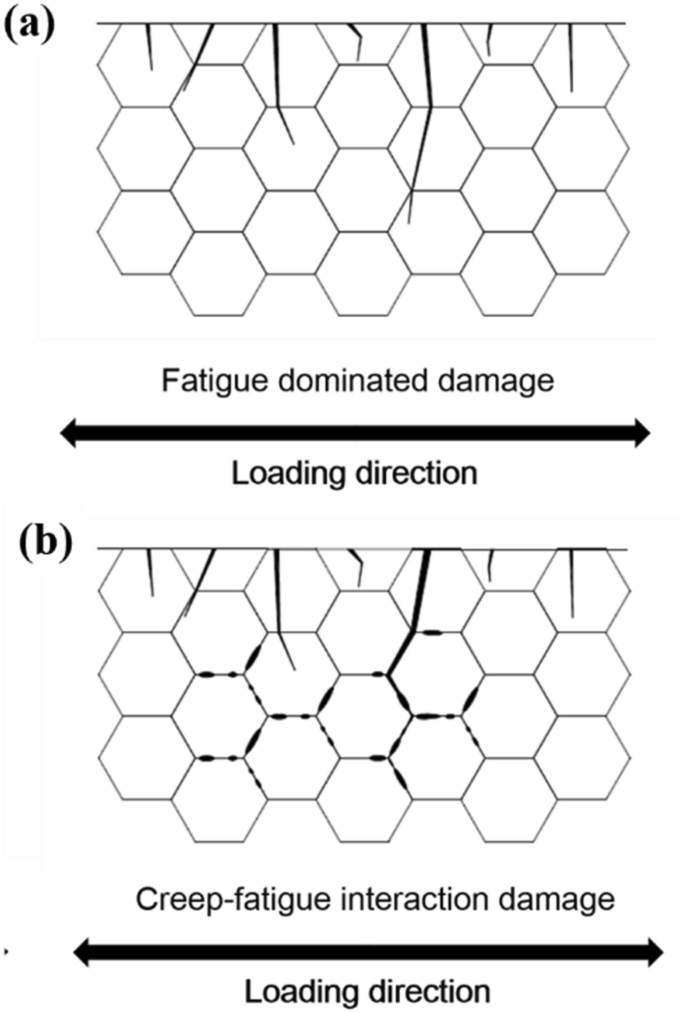
The schematic diagram of two creep-fatigue fracture mechanisms of CF-tested P92 steel welded joint under prior creep-fatigue damages with short dwells (30 and 120 s) or long dwells (600 and 900 s)
In retrospect, the specimens used in this work have all experienced prior CF loading before nanoindentation. Figure 10 shows the hardness and elastic modulus values measured at the fracture edges of PWHT and CF-tested specimen with 30, 120, 600 and 900 s dwell times. To reduce the effect of indentation size in this material [29], the hardness and elastic modulus were measured at 800 μm for all specimens. From Figure 10, the effects of spacing from the fracture edge (ranging from 50 to 350 μm) on the hardness and elastic modulus are negligible for all CF specimens. Compared with the BM for PWHT samples (3.05 GPa), the hardness measured near the fracture edge is slightly reduced for CF samples with 600 and 900 s dwell times (2.81 and 2.90 GPa), as shown in Figure 10(a). In contrast, the hardness at the fracture edge decreases significantly to 2.61 and 2.06 GPa for the CF samples with 30 and 120 s dwell times. A similar observation (Figure 10(b)) is also obtained for elastic the modulus, which is almost unchanged at long-term dwell times (208 GPa for PWHT, 202 GPa at 600 s dwell time and 206 GPa at 900 s dwell time) and significantly reduced at short-term dwell times (71 GPa at 30 s dwell time and 63 GPa at 120 s dwell time). Note that the CF specimens with short-term dwell times remain at the third softening stage before fracture, while the specimens with long -term dwell times are stay at the steady softening stage (Figure 6). The stress level at the third stage is much lower than at the stable stage (Figure 6), which could lead to the remarkable reduction in hardness in the CF samples with short-term dwells. Moreover, the two CF specimens with short dwell time were subjected to more cyclic loading (1803 and 2312 cycles) than those with long dwells (967 and 417 cycles). In the CF-tested specimens, microvoids form during cyclic loading at high temperatures, which then lead to nano- to micro-scale defects. The author speculates that these microvoids/defects could increase the pore volume fraction in the tiny nanoindentation test area, thus decreasing the elastic modulus. On the other hand, it is reported that the cyclic softening behavior of P92 steel at high temperatures is caused by the lower dislocation density and the decreasing ability of grain boundaries impede the dislocation motion [22,23,24]. Normally, this microstructural evolution should lead to a significant deterioration in deformation resistance [30, 31]. The reduced resistance to deformation would lead to increased deformation at the same stress level, thus deteriorating the elastic modulus. Based on the characteristics of the fracture surface (Figure 8), the significant reduction in hardness and elastic modulus could be caused by fatigue-induced damage.
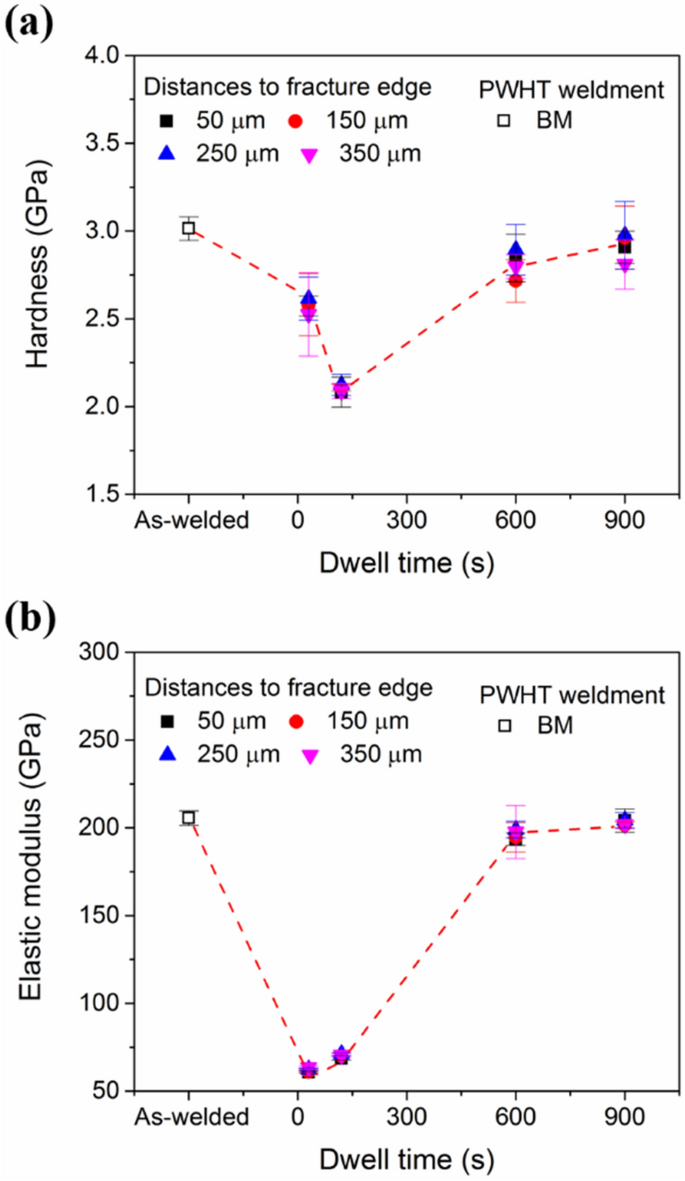
Comparison between (a) nanoindentation hardness, (b) elastic modulus as a function of dwell times, which are measured in different distance to fracture edges for CF specimens as well as PWHT specimen
3.2 Nanoindentation Characterization
The representative load-displacement (P-h) curves measured during nanoindentation creep near the fracture edge are shown in Figure 11(a) for the CF specimens with 30, 120, 600 and 900 s dwells. The initial holding displacements of the different typical P-h curves are 1003.5 nm (30 s dwell), 1011.6 nm (120 s dwell), 1004.2 nm (600 s dwell) and 1003.5 nm (900 s dwell). It is observed that the holding forces are higher for longer CF dwells except for 120 s dwell time where the holding force is lowest. The corresponding creep displacement determined from the nanoindentation depth during the dwell time is shown in Figure 11(b). Two common primary and secondary stages of nanoindentation are also observed. The creep displacement increases rapidly while the creep rate decreases rapidly at the primary stage. The creep displacement increases almost linearly with the holding time, and the creep rate remains constant at the secondary stage.
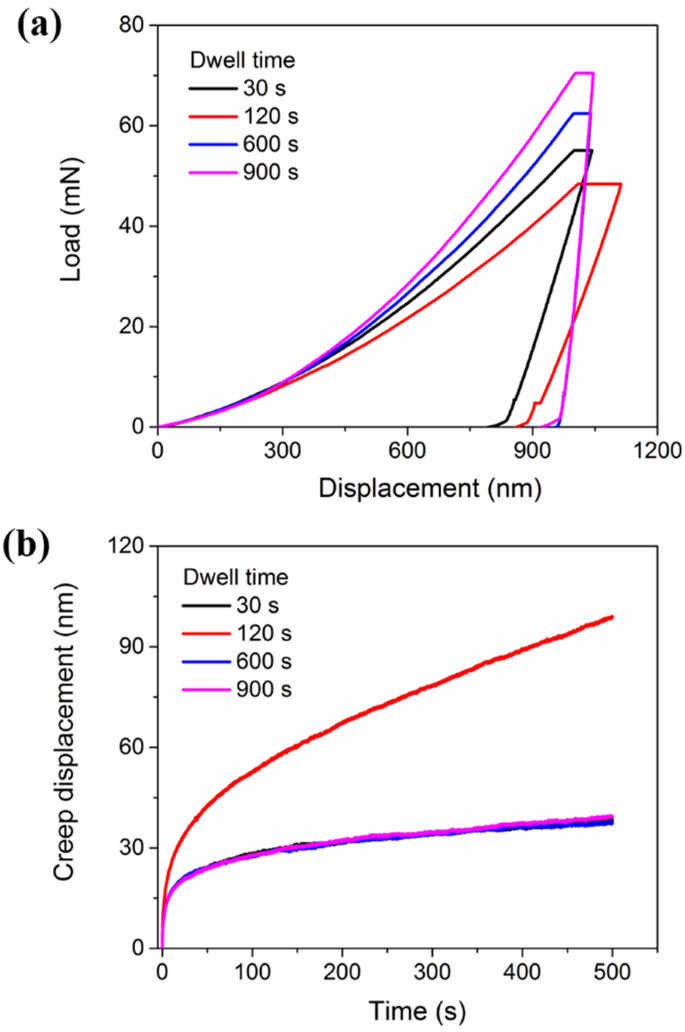
(a) representative load-displacement curves and (b) creep curves measured in the fracture edge of the CF-tested specimens with different dwell times
Figure 12 shows that the creep displacement as a function of the dwell times measured at different distances from the fracture edge for PWHT and CF-tested specimens. It can also be seen that the effects of the distances from the fracture edge (ranging from 50 to 350 μm) on the creep displacements are negligible for all CF-tested specimens. Compared to the BM in the PWHT specimen (29.3 nm), the creep displacements (36.8 nm at 30 s dwell, 36.9 nm at 600 s dwell and 36.4 nm at 900 s dwell) are slightly increased at longer CF dwell times except for the 120 s dwell time, which results in a significant creep displacement (98.4 nm), as shown in Figure 12. Hardness is generally considered as the ability of alloys to resist creep deformation [32]. From Figure 10(a) and Figure 12, it can be seen that the CF specimen with lower hardness have relatively high creep deformation. Although the CF specimens with 30, 600 and 900 s dwell times have almost the same creep deformation at room temperature, the decrease in their hardness is different. It can be seen that the creep resistance of CF specimens with long-term dwell times is lowered compared to 30 s dwell time. This conclusion is consistent with the high temperature creep-fatigue behavior that longer dwell time can lead to more creep damage which decreases the creep resistance. Since the hardness of the CF sample decreases significantly with a dwell time of 120 s, its creep resistance cannot be directly compared to the other three CF specimens. It should be noted that this sample was subjected to the most cyclic loading among the four typical samples. On the other hand, the dwell time of this CF sample also longer than that of another fatigue loaded CF sample with only 30 s dwell time per cycle (Figure 8(a) and (b)). During the dwell time, the grain boundary (GB) is in a pronounced relaxation process due to the lower stress level in the CF samples with 120 s dwell time. During this process, the dislocations at the GBs were annihilated [23, 24], reducing the stress fields generated by the dislocation-GBs interaction. This relaxation process on the GBs also led to a deterioration of the deformation resistance and interacted with a lower hardness, which promoted creep deformation at room temperature. Moreover, the decreased elastic modulus due to cyclic loading also leads to decreased deformation resistance of the CF specimens with short dwell times(Figure 10(b)). It is also possible to affect room temperature creep if the deformation mechanism is due to dislocation activities. To verify this, the deformation mechanism of room temperature creep should be investigated.
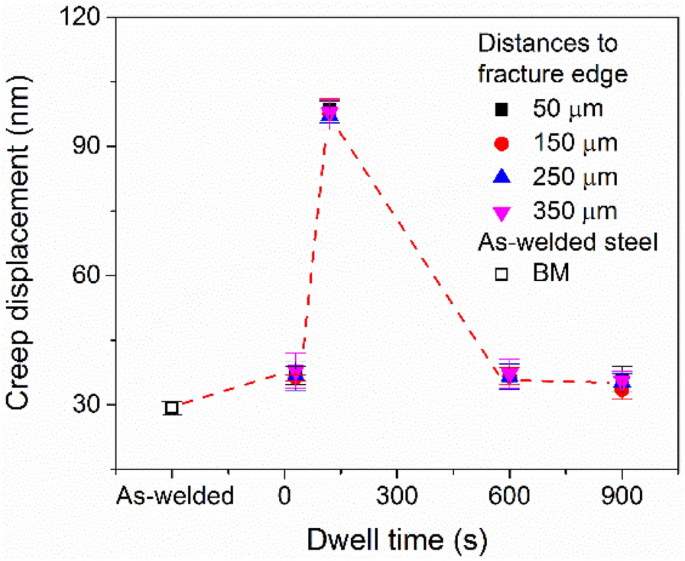
Comparison between creep displacement as function of dwells, which are measured in different distances to fracture edge CF-tested specimens as well as PWHT specimen
3.3 Strain Rate Sensitivity
Nanoindentation creep has been widely used to estimate strain rate sensitivity (SRS), which can be used to reveal the creep mechanism [33, 34]. The SRS value (m) under the self-similar Berkovich indenter can be approximately estimated by Eq. (1) [35].
The creep curve can be fitted with high reliability (R2 > 0.99) by an empirical equation:
where h0 and t0 are the initial holding depth and time at the beginning of the holding period, and A, B, and K are the fitting constants.
Based on the data of the fitting curves, the change of hardness H during the holding period can be estimated as follows:
where P and hc are the holding load and contact displacement of Berkovich indenter. The hc measured by the Berkovich indenter can be expressed as follows:
where h is the displacement of the indentation and the contact displacement, S is the stiffness deduced from the unloading curve. Furthermore, the strain rate \(\dot{\varepsilon }\) can be estimated as follows:
As an example of the usefulness of this method, Figure 13(a) shows the fit (R2 > 0.99) obtained by this method to describe the creep curve at the fracture edge of the CF specimen with 120 s holding time. From Figure 13(b), the strain rates stabilize at 6.23×10⁻⁴ s−1 after decreasing significantly during the hold time of 0.012 s−1. Figure 13(c) shows the decrease in nanoindentation hardness as a function of holding time. A natural logarithmic correlation between the nanoindentation hardness and the creep strain rate is shown in Figure 13(d). Thus, the value of SRS could be estimated by a linear relationship in the secondary creep phase.
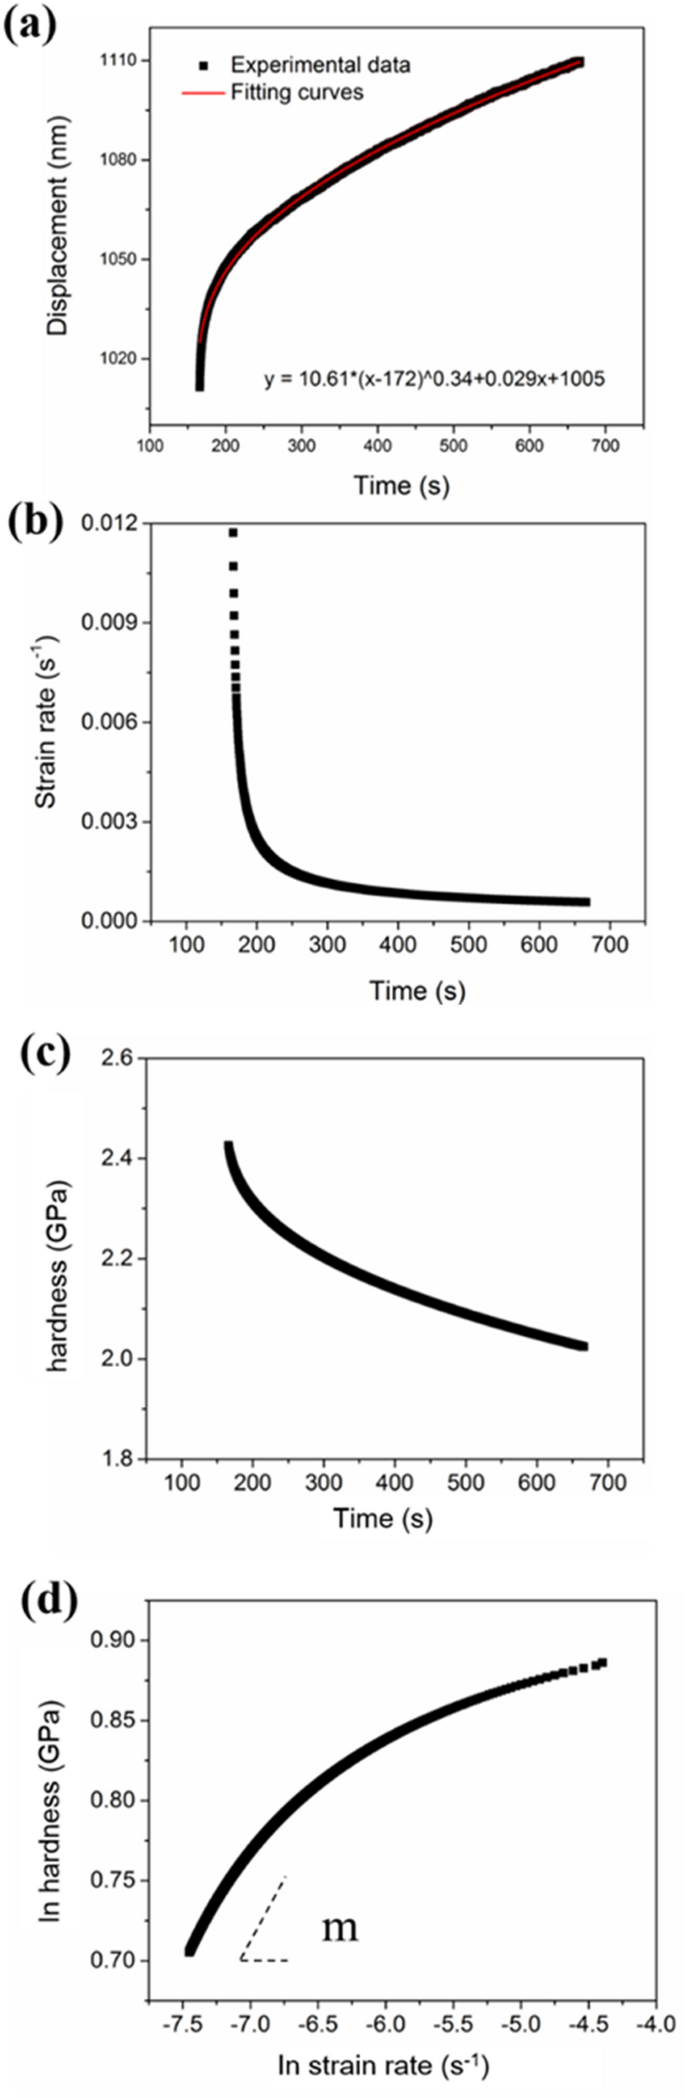
Figure 14 shows the variation of SRS (m) for the fracture edge in PWHT and CF specimens with different dwell times. The values of SRS estimated from the CF specimens with long-term dwells (0.0105 for 600 s dwell and 0.0108 for 900 s dwell) are slightly increased in comparison to the BM in PWHT specimen (0.0075) [23], as plotted in Figure 14. For the CF specimens with short-term dwells, a significant increase in SRS value is observed at 30 s dwell time (0.0278) and especially at 120 s dwell time (0.1709). In general, the values of m less than 0.3 indicate that the mechanism of creep at room temperature is dislocation activities. The m can be expressed as a function of dislocation density as suggested in Ref. [22].
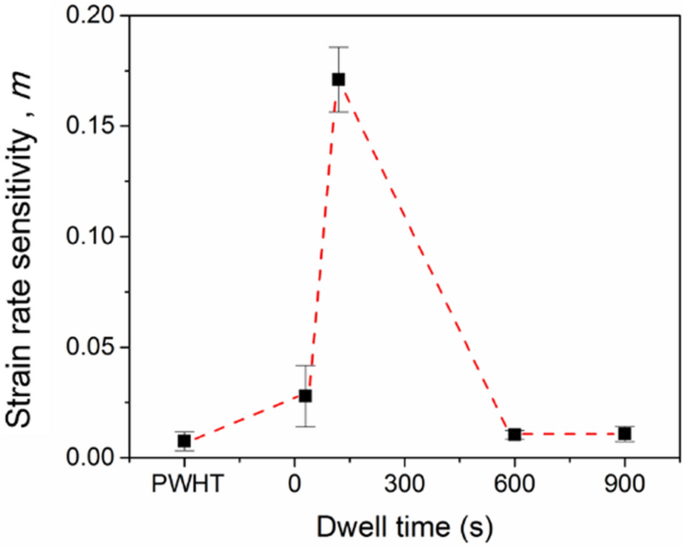
Variation in SRS (m) for fracture edge in the P92 steel welded joint with different dwell time
where ρ is the dislocation; V* is the activation volume; kb is the Boltzmann constant; T is the temperature in Kelvin, and a, μ, b, c are constants for a given material.
Eq. (6) shows that the SRS is inversely proportional to the square root of the dislocation density when a, μ, b, c, and V* are positive for a given material. Under CF loading, the reduction in dislocation density was observed, and enhanced SRS was also estimated in Refs. [22, 23]. For coarse-grain materials, the deformation typically occurs within the grain, and grain boundary can act as sinks for dislocation motions [36, 37]. Therefore, the stress field is produced by dislocation-dislocation and dislocation-GB interactions during deformation. The annihilation of dislocation reduces the dislocation density during the dwell period and enhances SRS for the four typical specimens. As for long-term dwells (600 and 900 s), the relaxation process is saturated due to the stable stress level after the first 40 s (Figure 7). Furthermore, the decrease in dislocation density and increased SRS are also reported to occur after fatigue loading [38]. Compared with long-term dwells (600 and 900 s), the higher number of cyclic loading history could result in lower dislocation density for the CF specimens with short-term dwells (30 and 120 s). Consequently, the significantly enhanced SRS was estimated in CF specimens with short dwells.
Finally, it should be noticed that the fracture mechanisms are different between long-term dwell and short-term dwell, as shown in Figures 8 and 9. For CF specimens with short-term dwells, the fracture mechanism was fatigue-dominate. The softening behaviors were serious in short-term dwells, which caused a remarkable reduction in hardness and lower dislocation density, which could significantly increase local SRS. As for long-term dwells, the long dwell time led to long thermal-mechanical aging time, which could result in nucleation and growth of creep voids, increase of grain size [23, 24], and coarsening of precipitates. The growth of creep voids would reduce the effective load area of specimens, which eventually caused the specimen rupture, namely the creep-fatigue-dominated fracture mechanism. In this fracture mechanism, the grain size increased for a long thermal-mechanical aging time, which could induce the slight reduction of local hardness and enhancement of SRS [20].
4 Conclusions
To investigate the interaction between creep and fatigue (CF) of the welded of A355 P92 steel welded, a welded structure for the main stream pipe of ultra-supercritical units, strain-controlled CF tests were conducted with dwell times ranging from 30 s to 900 s with a symmetrical triangular waveform at 650 °C. The hardness, elastic modulus and creep deformations were measured at the fracture edge of four typical CF specimens with dwell times of 30, 120, 600 and 900 s, respectively. The strain rate sensitivities (SRS) were estimated for these four CF specimens based on the nanoindentation results. Based on the microstructures of the fracture surface, the following conclusion can be drawn.
-
(1)
The lifetime of CF decreased with increasing dwell time in the range of 120 to 900 s, while it was proportional to increasing holding time ranging from 30 to 120 s. Based on the characteristic microstructures of the fracture surfaces, the CF specimens with short dwell times (30 and 120 s) were fractured by fatigue-induced damage, while the specimens with long dwell times (600 and 900 s) were fractured by creep-fatigue interaction.
-
(2)
Since the damage mechanisms of CF are different at long (600 and 900 s) and short (30 and 120 s) dwell times, two different cyclic softening behaviors were observed at high temperatures for these two types of CF specimens.
-
(3)
Compared with the BM of the PWHT sample, lower hardness and higher creep deformation were measured at the fracture edges of the CF samples at room temperature. The significant reductions in hardness and elastic modulus were observed for the fatigue- damaged specimens (30 and 120 s dwell times). The relatively pronounced creep deformation in these two specimens indicates that the room temperature creep is strongly influenced by the hardness and deformation resistance of the P92 steel weldment.
-
(4)
The values obtained for the SRS (0.07–0.17) indicate that the mechanism of creep at room temperature is dominated by dislocation-related activities. Compared to the PWHT specimen (0.07), the increased SRS (0.10–0.17) could be explained by the lower dislocation density caused by fatigue and creep loading.
References
J K Wright. Next generation nuclear plant steam generator and intermediate heat exchanger materials research and development plan. Idaho National Laboratory, 2010: 993192.
C Y Lu, C J Wu, Y M He, et al. Deformation mechanism-based true-stress creep model for SA508 Gr.3 steel over the temperature range of 450-750°C. Journal of Nuclear Materials, 2019, 526: 151776.
Z L Gao, C Y Lu, Y M He, et al. Influence of phase transformation on the creep deformation mechanism of SA508 Gr.3 steel for nuclear reactor pressure vessels. Journal of Nuclear Materials, 2019, 519: 292–301.
X Chen, Z Q Yang, M A Sokolov, et al. Low cycle fatigue and creep-fatigue behavior of Ni-based alloy 230 at 850 °C. Materials Science and Engineering: A, 2013, 563: 152–162.
C Wang, T J Luo, Y S Yang. Low cycle fatigue behavior of the extruded AZ80 magnesium alloy under different strain amplitudes and strain rates. Journal of Magnesium and Alloys, 2016, 4(3): 181–187.
Z Y Alsmadi, A Alomari, N Kumar, et al. Effect of hold time on high temperature creep-fatigue behavior of Fe-25Ni-20Cr (wt.%) austenitic stainless steel (Alloy 709). Materials Science and Engineering: A, 2020, 771(13): 138591.1–138591.10.
X C Zhang, S T Tu, F Z Xuan. Creep-fatigue endurance of 304 stainless steels. Theoretical and Applied Fracture Mechanics, 2014, 71: 51–66.
W Z Wang, P Buhl, A Klenk, et al. Influence of high-temperature dwell time on creep-fatigue behavior in a 1000 MW steam turbine rotor. Engineering Fracture Mechanics, 2016, 166: 1–22.
L Susmel, D Taylor. Two methods for predicting the multiaxial fatigue limits of sharp notches. Fatigue & Fracture of Engineering Materials & Structures, 2010, 26(9): 821–833.
M Matsui, M Tabuchi, T Watanabe, et al. Degradation of creep strength in welded joint of 9% Cr steel. ISIJ International, 2001, 41: 126–130.
S K Albert, M Matsui, T Watanabe, et al. Variation in the type IV cracking behavior of a high Cr steel weld with post weld heat treatment. International Journal of Pressure Vessels & Pi**, 2003, 80(6): 405–413.
W Zhang, X W Wang, X Li, et al. Influence of prior low cycle fatigue on microstructure evolution and subsequent creep behavior. International Journal of Fatigue, 2018, 109: 114–125.
X Wang, W Zhang, J Gong, et al. Experimental and numerical characterization of low cycle fatigue and creep fatigue behaviour of P92 steel welded joint. Fatigue & Fracture of Engineering Materials & Structures, 2018, 41(3): 611–624.
W Zhang, T Y Zhang, X W Wang, et al. Remaining creep properties and fracture behaviour of P92 steel welded joint under prior low cycle fatigue loading. Journal of Materials Research and Technology, 2020, 9(4): 7887–7899.
W Zhang, X W Wang, H F Chen, et al. Evaluation of the effect of various prior creep-fatigue interaction damages on subsequent tensile and creep properties of 9% Cr steel. International Journal of Fatigue, 2019, 125: 440–453.
Y Ma, G J Peng, D H Wen, et al. Nanoindentation creep behavior in a CoCrFeCuNi high-entropy alloy film with two different structure states. Materials Science & Engineering A, 2015, 621: 111–117.
Y L Yu, Y Ma, X W Huang, et al. Annealing effect on the structure relaxation and mechanical properties of a Polytetrafluoroethylene film by RF-magnetron sputtering. Surface and Coating Technology, 2021, 405: 126591.
Y Ma, G J Peng, Y H Feng, et al. Nanoindentation investigation on the creep mechanism in metallic glassy films. Materials Science and Engineering: A, 2016, 651: 548–555.
Y L Yu, X Q Xu, C D Lu, et al. Investigation on the microstructural and mechanical properties of a Polytetrafluoroethylene thin film by Radio Frequency magnetron sputtering. Thin Solid Films, 2020, 712: 138302.
Y X Song, X W Huang, Z L Gao, et al. Nanoindentation creep behavior of RPV’s weld joint at room temperature. Mechanics of Time-Dependent Materials, 2020, 24: 253–263.
Y Ma, X W Huang, W Hang, et al. Nanoindentation size effect on stochastic behavior of incipient plasticity in a LiTaO3 single crystal. Engineering Fracture Mechanics, 2020, 226: 106877.
Z L Gao, Y X Song, Z X Pan, et al. Nanoindentation investigation on the creep behavior of P92 steel weld joint after creep-fatigue loading. International Journal of Fatigue, 2020, 134: 105506.
Y X Song, F R Qin, J N Chen, et al. On the microstructural evolution and room-temperature creep behavior of 9%Cr steel weld joint under prior creep-fatigue interaction. Fatigue & Fracture Engineering Materials & Structures, 2020, 44(2): 444–460.
Y X Song, Z X Pan, J N Chen, et al. The effects of prior creep-fatigue on the strain rate sensitivity of a P92 welded joint. Journal of Materials Science, 2021, 56(11): 7111–7128.
Y Ma, Y X Song, T H Zhang. Revealing nanoindentation size-dependent creep behavior in a La-based metallic glassy film. Nanomaterials, 2019, 9(12): 1712.
L Zhao, L Y Xu, Y D Han, et al. Analysis on stress-strain behavior and life prediction of P92 steel under creep-fatigue interaction conditions. Fatigue & Fracture Engineering Materials & Structures, 2020, 43: 2731–2743.
R Z Wang, X Z Zhang, S T Tu, et al. A modified strain energy density exhaustion model for creep-fatigue life prediction. International Journal of Fatigue, 2016, 90: 12–22.
X M Zhu, R Z Wang, C C Zhang, et al. Creep-fatigue life prediction and interaction diagram in nickel-based GH4169 superalloy at 650°C based on cycle-by-cycle concept. International Journal of Fatigue, 2017, 97: 114–123.
A Elmustafa, D S Stone. Nanoindentation and the indentation size effect: Kinetics of deformation and strain gradient plasticity. Journal of the Mechanics & Physics of Solids, 2003, 51(2): 357–381.
K Takasawa, R Ikeda, N Ishikawa, et al. Effects of grain size and dislocation density on the susceptibility to high-pressure hydrogen environment embrittlement of high-strength low-alloy steels. International Journal of Hydrogen Energy, 2012, 37: 2669–2675.
C G Panait, A Zielińska-Lipiec, T Koziel, et al. Evolution of dislocation density, size of subgrains and MX-type precipitates in a P91 steel during creep and during thermal ageing at 600°C for more than 100,000 h. Materials Science and Engineering: A, 2010, 527: 4062–4069.
K Fujiyama, K Mori, T Matsunaga, et al. Creep-damage assessment of high chromium heat resistant steels and weldments. Materials Science and Engineering: A, 2009, 510: 195–201.
K L Johnson. Contact mechanics. Cambridge University Press, 1987.
W B Li, J L Henshall, R M Hooper, et al. The mechanisms of indentation creep. Acta Metallurgica Materialia, 1991, 39: 3099–3110.
I C Choi, Y J Kim, Y M Wang, et al. Nanoindentation behavior of nanotwinned Cu: influence of indenter angle on hardness, strain rate sensitivity and activation volume. Acta Materialia, 2013, 61: 7313–7323.
F Humphreys, G S Rohrer. Recrystallization and related annealing phenomena. Materials and corrosion, 1997, 48(9): 648–649.
M R Staker, D L Holt. The dislocation cell size and dislocation density in copper deformed at temperatures between 25 and 700°C. Acta Metallurgica, 1972, 20(4): 569–579.
N V Nguyena, T H Phamb, S E Kim. Strain rate sensitivity behavior of a structural steel during low-cycle fatigue investigated using indentation. Materials Science and Engineering: A, 2019: 744.
Funding
Supported by National 13th Five-Year Key Technologies R&D Program of China (Grant No. 2016YFC0801902), National Natural Science Foundation of China (Grant No. 11727803, 11672356, 52075490), Fundamental Research Funds for the Provincial Universities of Zhejiang (Grant No. RF-A2020010).
Author information
Authors and Affiliations
Contributions
YS wrote the manuscript and performed tests; YM assisted with sampling and laboratory analyses and revised the manuscript, ZP assisted with creep-fatigue test, TZ revised the manuscript, ZG was in charge of the whole trial. All authors read and approved the final manuscript.
Authors’ Information
Yuxuan Song, born in 1992, is currently a doctoral candidate at Institute of Process Equipment and Control Engineering and Institute of Micro/Nano-Mechanical Testing Technology & Application of Zhejiang University of Technology. His research interests include creep-fatigue interaction and mechanics of nanoindentation. E-mail: songyux@zjut.edu.cn
Yi Ma, born in 1987, is currently a professor at Institute of Micro/Nano-Mechanical Testing Technology & Application of Zhejiang University of Technology. His research interests include experiment mechanics, surface and interface mechanics, damage mechanics. E-mail: may@zjut.edu.cn
Zhouxin Pan, born in 1995, is currently a master candidate at Institute of Process Equipment and Control Engineering of Zhejiang University of Technology. His research interests include creep-fatigue interaction, structural integrity and reliability. E-mail: zhouxinpan@zjut.edu.cn
Yuebing Li, born in 1987, is currently a professor at Institute of Process Equipment and Control Engineering of Zhejiang University of Technology. His research interests include fracture mechanics, structural integrity and reliability. E-mail: ybli@zjut.edu.cn
Taihua Zhang, born in 1966, is a professor at Institute of Solid Mechanics of Beihang University. His research interests include mechanical instrument research and development, mechanics of micro- and nano-materials. E-mail: zhangth66@buaa.edu.cn
Zengliang Gao, born in 1960, is currently a professor at Institute of Process Equipment and Control Engineering of Zhejiang University of Technology and Engineering Research Center of Process Equipment and Re-manufacturing of the Ministry of Education. His research interests include structural integrity assessment and process equipment design. E-mail: zlgao@zjut.edu.cn
Corresponding authors
Ethics declarations
Competing Interests
The authors declare no competing financial interests.
Rights and permissions
Open Access This article is licensed under a Creative Commons Attribution 4.0 International License, which permits use, sharing, adaptation, distribution and reproduction in any medium or format, as long as you give appropriate credit to the original author(s) and the source, provide a link to the Creative Commons licence, and indicate if changes were made. The images or other third party material in this article are included in the article's Creative Commons licence, unless indicated otherwise in a credit line to the material. If material is not included in the article's Creative Commons licence and your intended use is not permitted by statutory regulation or exceeds the permitted use, you will need to obtain permission directly from the copyright holder. To view a copy of this licence, visit http://creativecommons.org/licenses/by/4.0/.
About this article

Cite this article
Song, Y., Ma, Y., Pan, Z. et al. Nanoindentation Characterization of Creep-fatigue Interaction on Local Creep Behavior of P92 Steel Welded Joint. Chin. J. Mech. Eng. 34, 131 (2021). https://doi.org/10.1186/s10033-021-00661-5
Received:
Revised:
Accepted:
Published:
DOI: https://doi.org/10.1186/s10033-021-00661-5