
Abstract
Computed tomography pulmonary angiography (CTPA) is usually used for pulmonary embolism (PE) detection. However, the determination of scan timing remains a challenge due to the short scan duration of CTPA. We aimed to develop an optimized test bolus to determine scan delay in CTPA. The time-enhancement curves were obtained by measuring the enhancement within a region of interest in the main pulmonary artery and vein. A total of 70 patients were randomly divided into two groups (n = 35 each): the control group underwent CTPA using the test bolus approach and the test group underwent CTPA using the biphasic time-enhancement curves approach. Tube voltages of 100 kVp and 80 kVp and 20 ml and 10 ml contrast agent were adopted in the control and test groups, respectively. The CT numbers, image quality, PE detection was evaluated. There was a point of intersection between the pulmonary artery and vein test bolus enhancement curves. The scan delay time (TDELAY) was obtained based on the time at intersection (TCROSS) and the scan duration (TSD): TDELAY = TCROSS − TSD. The mean CT numbers for pulmonary vein in the control were higher than those in the test group (all p < 0.001). The image quality for the pulmonary arteries in the test group was better than that in the control group (p < 0.01), with artifact reduction in the superior vena cava. Segmental PE could be detected using the optimized protocol. The radiation dose and iodine load in the test group were all lower than those in the control (p < 0.01). We established an approach to calculate the scan delay of CTPA, and this approach could be used for CTPA at 80 kVp with 10 ml contrast agent.
Introduction
Computed tomography pulmonary angiography (CTPA) is a critical imaging approach for pulmonary embolism (PE) detection with high specificity and sensitivity1,2. Most of the previous studies used the bolus tracking system (hounsfield unit of the region of interest positioned within the main pulmonary artery) or a test bolus to start the scan3,4. The scan protocols are complex and challenging due to the application of multidetector CT3. The optical scanning time is difficult to predict because the hemodynamic profile of patients are unknown4. The contrast material arrival time was regarded as the diagnostic scan delay in a single-detector CT angiographic scan5. In addition, the peak arterial enhancement can be missed when the scan delay is excessively extended4. For fast multidetector CT, an additional delay is usually used6. Low kilovoltage scanning based on a small volume of contrast media also affects the determination of the scanning time7. Moreover, venous contamination usually occurred in the bolus tracking system8. Subclavian vein (SV) and superior vena cava (SVC) artifacts influence on the PE detection. However, the methods of determining the delay varies for different investigators.
Efforts have been made to reduce the radiation dose, such as using automated tube current modulation dose systems and reductions in the voltage from 120 kVp to 100 or 80 kVp9,10,11. Moreover several studies have also investigated the image quality of CTPA using both low-voltage scanning and low doses of contrast medium11. The risk of contrast-induced nephropathy (CIN) is low12. However, one should practice caution for patients with high risk, such as those with severe chronic kidney disease, because contrast-induced nephropathy (CIN) may occur13,14,15,16. The European Society of Urogenital Radiology guidelines recommend the avoidance of unnecessarily high doses of contrast media17. Recently, several studies reported that CT angiography with a reduced iodine load (20–30 ml) was also available in CTPA without compromising diagnostic image quality11,18,19. However, no studies using a reduced amount of contrast agent have been reported.
The test bolus method was based on the attenuation of the main pulmonary artery. To the best of our knowledge, the attenuation of the pulmonary vein during the scanning has not been considered. We hypothesized that it may supply information to determine the time of scan start and may be valuable for personalized CTPA, which is the current trend in individualized dianostic18. In the present study, we established a protocol to determine the scan delay time by using the biphasic time-enhancement curve in the pulmonary artery and vein. We tested it using a very low volume of contrast media (10 ml).
Results
The characteristics of patients
The characteristics of the patients are listed in Supplementary Table s1. There were no significant differences in gender, age, height, weight and BMI between the test group and the control group.
The time-enhancement curves
The time-enhancement curves of the pulmonary artery and vein are shown in Fig. 1. The curves varied in different patients. To finish all scans before the point of intersection (TCROSS), we established the following equation: scan delay time (TDELAY) = TCROSS− scan duration (TSD). We calculated the TDELAY in six patients based on the time-enhancement curves (Fig. 1, Supplementary Table s2). The data showed that the TDELAY varied in different patients (3–7 s). We also calculated the scan delay using the test bolus methods. There were differences in TDELAY between the test bolus method and our protocol.

The time-enhancement curves in control (A) and test group (B–F). The time-enhancement curves were obtained by measuring the enhancement within a region of interest in pulmonary artery and vein. The biphasic time-enhancement curves were obtained in test group (B–F). There was an intersection between the two curves. In order to decrease the vein enhancement, the scan should be finished before the time at cross point. The scan delay (TDELAY) was calculated by using the following equation: Time at cross point (TCROSS)-scan duration (TSD). Line 1 was the time-enhancement curves of pulmonary artery; Line 2 was the time-enhancement curves of pulmonary artery of vein.
Image quality evaluation
Table 1 illustrates the subjective evaluation of image quality of PA, image quality at the lung window and PV artifact in the two groups. No significant differences were observed in the image quantity at the lung window (Fig. 2). Both readers showed that the image quality of PA in the test group was better than that in the control group (p < 0.001). Moreover, fewer artifacts in SVC and SV were observed in the test group than in the control group (p < 0.001) (Table 1. Figs. 3, 4). Figure 4 shows a case of CTPA images with pulmonary venous contamination in the control group.

Lung window images in the control and test groups. Axial (upper) and coronal (lower) lung window CT image both clearly show the image quality was similar between the control and test groups. CA: contrast agent.

Axial (upper) and maximum intensity projection (lower) computed tomography pulmonary angiography (CTPA) images in the control (a 76-year-old man) and test groups (a 77-year-old man). Artifacts of superior vena cava (SVC) was observed in the control group (arrow) and the CT number of SVC was 403. The CT number of SVC (78.4HU) in test group (arrow head) was lower than that in the control group. In addition, the CT number of pulmonary vein in upper and lower lung lobes in control group were all higher than those in control group. CA: contrast agent.

Computed tomography pulmonary angiography (CTPA) (A: coronal; B: axial) of a 77-year-old female in the control group using test bolus method. The scan start was delayed. The venous contamination was severe.
Subsequently, we also compared the CT values, signal noise ratio (SNR) and contrast noise ratio (CNR) of the main pulmonary artery (MPA), left and right pulmonary artery (LPA and RPA), left upper and lower lobe pulmonary arteries, the apical segment in the left upper lobe and the companion veins, and the basal segment in left lower lobe and the companion veins (Table 2). The CT values, SNR and CNR of the above arteries and veins in the test group were all lower than those in the control group (all p < 0.001). In addition, no significant differences were found in the CT values and SNR of the lung, image noise or CT values of the muscle between the two groups.
Detection of PE
PE was detected in 6 and 5 patients in the test and control groups, respectively. The number of PE is listed in Table 3. PE in the lobar PA and segmental PA both could be detected using the optimized protocol (test group) and the test bolus method (control group). We showed a patient who underwent CTPA using both the test bolus method and the optimized protocol (Fig. 5). The SVC artifacts occurred in the axial and curve plane reformation images which influenced embolism detection. The CTPA images indicated that they had similar detection performance.
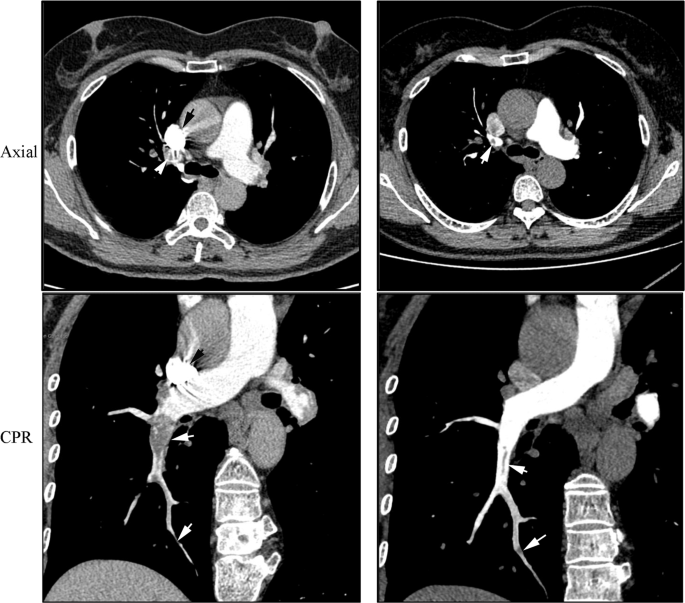
A 58-years old female patient who underwent computed tomography pulmonary angiography (CTPA) examinations both using test bolus method (Left) and the optimized protocol (right). She firstly underwent the CTPA using test bolus method. The artifacts of superior vena cava (SVC) were occurred (black arrow) in axial and curve plane reformation (CPR) images which influenced embolism detection (arrow head). During the follow-up at 6th month, the CTPA was performed using the optimized protocol (biphasic time-enhancement curve). No artifacts of SVC was observed. The two methods both detected the pulmonary embolism at lobar PA and segmental PA (white arrow).
Discussion
The CT timing is critical for CTPA, especially for fast multidetector CT. It would be better to individually and precisely obtain the delay scan. In the present study, we optimized the protocol of CTPA by using the biphasic time-enhancement curves and the TDELAY could be obtained by subtracting TSD from TCROSS. Our data further showed that the personalized protocol could be used for CTPA examinations at 80 kVp with 10 ml contrast agent to obtain sufficient image quality and a low iodinate load (10 ml). PE in the segmental PA could be clearly shown using the optimized protocol.
The bolus tracking system and a test bolus are commonly used to start a scan3,20,21. However, the time obtained from those two techniques are not the scan delay6. The diagnostic delay is required to optimize the scan delay6. The diagnostic delay is related to several factors, including the injection duration, scan duration, and hemodynamics.3 In addition, the diagnostic delay may vary for different CT scanners.3 A equation was proposed by Bae3: TDELAY = Time to peak contrast enhancement (TPEAK) − (1/2) × TSD. The TPEAK for CTPA is determined by the injection duration (TID) and contrast material arrival time (TARR)14 and TPEAK = TID + TARR −53. He further demonstrated that this equation may work well in fast multidetector CT. For slow scans or scans with prolonged injection of the contrast agent, a modification is required because the TPEAK and TSD both increase. However, this equation is relatively complex. Various modifications have been reported in the literature.22 In our protocol, we found that TDELAY is determined by TCROSS and TSD. The TDELAY calculated with our equation is simpler than that determined by using Bae’s equation. Moreover, our results showed that the image quality of the pulmonary arteries was better in test group than that in the control group (all score >3). The CT number of pulmonary veins in the upper and lower lobes in the test group were both significantly lower than those in the control group. Our optimized protocol could improve the image quality by diminishing the intervention of vein enhancement. Moreover, our data showed that PE in the segmental PA could be identified using this optimized protocol which indicated that this protocol was useful for PE detection.
CIN is another issue that limits the clinical application of CTPA, particular in patients with severe chronic kidney disease (CKD). Contrast volume reduction strategies have been used in CTPA11,13,23,24,25,26,27. Usually, 20–75 ml contrast agent were used in previous studies. To the best of our knowledge, few studies have used volume of contrast agent as low as 10 ml, in CTPA. The iodinate load in our study was lower than data previously reported11,28. The low tube voltage, such as 80 kVp can result in higher intravascular CT attenuation than 120 kVp3,11. Moreover, our scanning protocol may provide an accurate delay time, which is crucial for opacification of the pulmonary vasculature11. In addition, respiratory coordination and “ breath holding without taking the deep inspiration” were used during the scanning which can improve contrast enhancement in pulmonary arteries29,30. We used a small FOV, from diaphragm to 2 cm above the aortic arch, which may be one of the reasons for acceptable image quality using such a low iodinate load. Some strategies for iodinate reduction have also been recommended in literature31,32. Our optimized protocol using such a low volume of contrast agent is helpful for patients with CKD when they require CTPA examinations. However, for patients with BMIs > 28 kg/m2 or body weights > 80 kg, we speculated that a small additional volume of contrast media are required. Further evaluation are needed.
Iterative reconstruction at a low tube voltage, such as 80 kVp, has been widely used as a strategy for radiation reduction, especially for CTPA2,26,33. An 80 kVp was also used in our study. High pitch CTPA with 70 kVp in dual-energy CT or high-end CT also have been reported in several studies28,34,35. In our study, a 64 multidetector CT was used because it is more widely used in the world than dual-energy CT or high-end CT, which indicated that our optimized protocol could be widely used in CTPA examinations. Although the CT numbers in the test groups were lower than those in the control group, the image quality of pulmonary arteries were all sufficient for imaging diagnosis. Residual contrast material in the superior vena cava can result in streak artifacts36. Our results showed that the artifacts of SV and SVC were significantly decreased in the test group.
Our study also has several limitations. First, the sample size in the test group was relatively small, and our study was a single-center observational study. Second, patients with BMIs > 28 kg/m2 and body weights > 80 kg were not included in our study. Further studies are required to test whether our optimized protocol is also applicable in those patients. Third, our protocol may not be applicable for patients with severe asthma because it is difficult to measure the CT numbers of pulmonary veins. Consequently, it is difficult to obtain the time-enhancement curves in veins. Fourth, we did not compare our optimized protocol to the bolus tracking technique. Finally, our protocol may not be used for aortic or systemic arteries because there is no enhancement in those tissues.
In conclusion, we established an optimized protocol for CTPA examinations using biphasic time-enhancement curves. Our protocol could be used for CTPA at 80 kVp with 10 ml contrast agent to obtain improved image quality and a low iodinate load. Our optimized protocol may contribute to personalized CTPA examinations.
Methods
Patient selection
This prospective study was approved by the Institutional Review Board of the Affiliated Hospital of Nan**g University of Chinese Medicine (2018NL-085-01) and informed consent was obtained from each individual. The Declaration of Helsinki was followed during this study.
We enrolled 70 subjects who were suspected to suffer from PE. Subjects with body mass index (BMI) > 28 kg/m2, weight > 80 kg, III-IV cardiac function, severe arrhythmia, liver or renal failure or iodine allergy were excluded. They were randomly divided into two groups: the test group and control group. There were 25 men and 45 women. The mean age was 65.2 ± 13.4 years (age range, 27–88).
CT protocol
All the patients in this study underwent contrast-enhanced CT with a 64-row GE Optima CT670 (GE Healthcare Tokyo Japan). The CT protocols are listed in Table 4. The patients were asked to perform “breath holding without taking the deep inspiration” during the scan to decrease the transient interruption of contrast arrival due to change in intra-thoracic pressures due to Valsalva maneuvers or changes in heart output. The test bolus in the control group received 10 ml nonionic iodinated contrast material (Omnipaque, 350 mg I/ml, GE Healthcare, USA) at a rate of 5.0 ml/s via a pump injector (Ulrich Missouri XD2001, Ulrich GmbH & Co.KG Germany) followed by 20 ml of normal saline. The monitoring scans started after the beginning of the injection and performed every two seconds. Then, we supervised the main pulmonary artery and obtained the time-enhancement curve. The TDELAY was based on the curve and calculated as the sum of the contrast material arrival time plus an additional delay (also called diagnostic delay, 1–2 s). Then, the patients in the control group received 20 ml nonionic iodinated contrast material at a rate of 4.0 ml/s via a pump injector followed by 30 ml of normal saline.
The CT protocols in the test group are listed in Table 4. The test group first received 5 ml nonionic iodinated contrast material (Omnipaque, GE Healthcare, USA or Iodixanol, Yangtze River Phar Co., Ltd, Taizhou, China) via a pump injector followed by 45 ml of normal saline. The regions of interests were placed in both the pulmonary artery and vein. Then, the biphasic time-enhancement curve was obtained by measuring the enhancement within a region of interest (Fig. 6). The monitoring scans were stopped when the ascending aorta was enhanced. The two curves had a meeting point and the time at this point was set as TCROSS. The scan delay for the test group was calculated based on the biphasic time-enhancement curves. The scan should be finished before the intersection. In addition, we also calculated the TSD. BMI and weight both affect contrast enhancement8. Subjects with BMIs <24 kg/m2 and weights <60 kg received 10 ml iodixanol (270 mg I/ml). Subjects with BMIs between 24 and 28 kg/m2 and weights between 60 and 80 kg received 10 ml Omnipaque (350 mg I/ml).

The biphasic time-enhancement curves. The region of interest was placed on main pulmonary artery and vein (A–H). The time-enhancement curves were obtained automatically (H). Line 1 was the time-enhancement curves of pulmonary artery; Line 2 was the time-enhancement curves of pulmonary vein.
The CT scanning parameters were as follows: tube voltage, 100 (control group) or 80 (test group) KVp; tube current, 100–400 mA; helical pitch, 1.375 ; section thickness, 0.625 mm; gantry rotation time, 0.5 s. The adaptive statistical iterative reconstruction (ASiR) was 50%, which mean 50% filtered back projection (FBP) plus 50% ASiR.
Image quality evaluation
Two chest radiologists (HZ and BQ) with 5 and 10 years of CT experience, respectively, independently evaluated the subjective image quality. All images were evaluated in the workstation. We obtained the maximum intensity projection (MIP) and curved plane reformation (CPR) images. The following vascular enhancement was evaluated quantitatively: MPA, LPA and RPA, left upper and lower lobe pulmonary artery, the apical segment in the left upper lobe and the companion vein, the basal segment in the left lower lobe and the companion vein. The regions of interest (ROI) measured with a size of 80 ± 5 mm2 in the MPA and 60 ± 5 mm2 in the LPA and RPA. If there was a lesion, measurements were performed in adjacent slices or the contralateral vessel. The CT numbers of the bilateral pulmonary lobes and paraspinal muscle were also measured with an ROI of 30 ± 2 mm2 at the level of the pulmonary trunk. We calculated the SNR using the following formulas: SNR = CT number of target artery/background noise, CNR = (CT number of target artery - CT number of paraspinal muscle)/background noise. Three independent measurements were performed, and the mean was calculated.
We also subjectively evaluated the image quality. The overall image quality of the PA was scored on a five-point scale: 5, good to excellent, the arterial branches are clearly demonstrated and the pulmonary veins were not enhanced; 4, good, pulmonary artery was clear and the pulmonary veins were indistinctly observed; 3, the enhancement of arteries and veins were similar; 2, the enhancement of veins were higher than the arteries; 1, nondiagnostic quality, the images could not be used for diagnosis because of poor contrast opacification. The artifacts of SV and SVC were also recorded (Yes or No). The quality of the lung window images was scored on a three-point scale: 1, excellent image quality; 2, good image quality; 3, a nondiagnostic examination.
PE detection
Two chest radiologists (with 8 and 12 years of CTA experience, respectively) who were blinded to the patient medical histories and clinical data independently evaluated the images. PEs were considered if there were luminal filling defects or non-visualization of segmental pulmonary and subsegmental arteries compared to the contralateral side. We counted the number of PE in the MPA, LPA, RPA, lobar PA, segmental PA and subsegmental PA.
Statistical analysis
The SPSS for Windows (version 19.0; SPSS Inc., Chicago, IL, USA) was used in statistical analysis. We first performed Kolmogorov-Smirnov test for normal distribution of the data. For those data with normal distribution, the independent t-test was used for comparing continuous variables. Mann-Whitney U test was used for continuous data with abnormal distribution. The chi-squared test or Fisher’ test was used for the categorical variables. The significance level was set at P < 0.05.
Data availability
All data generated or analyzed during this study are included in this published article (and its Supplementary Information Files).
References
Di Nisio, M., van Es, N. & Büller, H. R. Deep vein thrombosis and pulmonary embolism. Lancet 388, 3060–3073 (2016).
Zhang, L. J. et al. Computed tomography of acute pulmonary embolism: state-of-the-art. European Radiology 25, 2547–2557 (2015).
Bae, K. T. Intravenous contrast medium administration and scan timing at CT: considerations and approaches. Radiology 256, 32–61 (2010).
Henzler, T. et al. Dual-energy CT angiography of the lungs: comparison of test bolus and bolus tracking techniques for the determination of scan delay. European Journal of Radiology 81, 132–138 (2012).
Sheiman, R. G., Raptopoulos, V., Caruso, P., Vrachliotis, T. & Pearlman, J. Comparison of tailored and empiric scan delays for CT angiography of the abdomen. American Journal of Roentgenology 167, 725–729 (1996).
Bae, K. T. Test-bolus versus bolus-tracking techniques for CT angiographic timing. Radiology 236, 369–370 (2005).
Hinzpeter, R. et al. CT angiography of the aorta: contrast timing by using a fixed versus a patient-specific trigger delay. Radiology 291, 531–538 (2019).
Wang, M., Li, W., Lun-Hou, D., Li, J. & Zhai, R. Optimizing computed tomography pulmonary angiography using right atrium bolus monitoring combined with spontaneous respiration. European Radiology 25, 2541–2546 (2015).
Mamlouk, M. D. et al. Pulmonary embolism at CT angiography: implications for appropriateness, cost, and radiation exposure in 2003 patients. Radiology 256, 625–632 (2010).
Pontana, F. et al. Reduced-dose low-voltage chest CT angiography with sinogram-affirmed iterative reconstruction versus standard-dose filtered back projection. Radiology 267, 609–618 (2013).
Lu, G. M. et al. High-pitch computed tomography pulmonary angiography with iterative reconstruction at 80 kVp and 20 mL contrast agent volume. European Radiology 24, 3260–3268 (2014).
Wichmann, J. L. et al. Contrast-induced nephropathy. Circulation 132, 1931–1936 (2015).
Newhouse, J. H. & Roychoudhury, A. Quantitating contrast medium-induced nephropathy: controlling the controls. Radiology 267, 4–8 (2013).
Yazıcı, S. et al. Relation of contrast nephropathy to adverse events in pulmonary emboli patients diagnosed with contrast CT. American Journal of Emergency Medicine 34, 1247–1250 (2016).
McDonald, J. S. et al. Acute Kidney Injury After Intravenous Versus Intra-Arterial Contrast Material Administration in a Paired Cohort. Investigative Radiology 51, 804–809 (2016).
Schönenberger, E. et al. Kidney injury after intravenous versus intra-arterial contrast agent in patients suspected of having coronary artery disease: A randomized trial. Radiology 292, 664–672 (2019).
Stacul, F. et al. Contrast induced nephropathy: updated ESUR Contrast Media Safety Committee guidelines. European Radiology 21, 2527–2541 (2011).
Hendriks, B. M. F. et al. Optimizing Pulmonary Embolism Computed Tomography in the Age of Individualized Medicine: A Prospective Clinical Study. Investigative Radiology 53, 306–312 (2018).
Wu, C. C., Lee, E. W., Suh, R. D., Levine, B. S. & Barack, B. M. Pulmonary 64-mdct angiography with 30 ml of iv contrast material: vascular enhancement and image quality. American Journal of Roentgenology 199, 1247–1251 (2012).
Kerl, J. M. et al. Intravenous contrast material administration at high-pitch dual-source CT pulmonary angiography: test bolus versus bolus tracking technique. European JouRnal ofRadiology 81, 2887–2891 (2012).
Rodrigues, J. C. L., Mathias, H., Negus, I. S., Manghat, N. E. & Hamilton, M. C. Intravenous contrast medium administration at 128 multidetector row CT pulmonary angiography: bolus tracking versus test bolus and the implications for diagnostic quality and effective dose. Clinical Radiology 67, 1053–1060 (2012).
Bae, K. T. Peak Contrast enhancement in CT and MR angiography: when does it occur and why? pharmacokinetic study in a porcine model. Radiology 227, 809–816 (2003).
Goble, E. W. & Abdulkarim, J. A. CT pulmonary angiography using a reduced volume of high-concentration iodinated contrast medium and multiphasic injection to achieve dose reduction. Clinical Radiology 69, 36–40 (2014).
Laqmani, A. et al. CT Pulmonary Angiography at Reduced Radiation Exposure and Contrast Material Volume Using Iterative Model Reconstruction and iDose4 Technique in Comparison to FBP. PLoS One 11, e0162429 (2016).
Yuan, R. et al. Reduced iodine load at CT pulmonary angiography with dual-energy monochromatic imaging: comparison with standard CT pulmonary angiography–a prospective randomized trial. Radiology 262, 290–297 (2012).
Szucs-Farkas, Z. et al. Detection of pulmonary emboli with CT angiography at reduced radiation exposure and contrast material volume: comparison of 80 kVp and 120 kVp protocols in a matched cohort. Investigative Radiology 44, 793–799 (2009).
Faggioni, L. et al. 80-kV pulmonary CT angiography with 40 mL of iodinated contrast material in lean patients: comparison of vascular enhancement with iodixanol (320 mg I/mL) and iomeprol (400 mg I/mL). American Journal of Roentgenology 199, 1220–1225 (2012).
Meier, A. et al. Dual energy ct pulmonary angiography with 6g iodine-a propensity score-matched study. PLoS One 11, e0167214 (2016).
Murphy, D. J., Aghayev, A. & Steigner, M. L. Vascular CT and MRI: a practical guide to imaging protocols. Insights Imaging 9, 215–236 (2018).
Li, Y. J., Lau, K. K., Ardley, N. & Lau, T. Efficacy of ‘breath holding at ease’ during CTPA in the improvement of contrast enhancement in pulmonary arteries. Journal of Medical Imaging and Radiation Oncology 57, 415–422 (2013).
Min, W., Wen, L., Dai, L. H., Li, J. & Zhai, R. Optimizing CTPA using right atrium bolus monitoring combined with spontaneous respiration. European Radiology 25, 2541–2546 (2015).
Saade, C. et al. An optimised patient-specific approach to administration of contrast agent for CT pulmonary angiography. European Radiology 23, 3205–3212 (2013).
Schueller-Weidekamm, C., Schaefer-Prokop, C. M., Weber, M., Herold, C. J. & Prokop, M. CT angiography of pulmonary arteries to detect pulmonary embolism: improvement of vascular enhancement with low kilovoltage settings. Radiology 241, 899–907 (2006).
Albrecht, M. H. et al. State-of-the-art pulmonary CT angiography for acute pulmonary embolism. American Journal of Roentgenology 208, 495–504 (2017).
Wichmann, J. L. et al. 70 kVp computed tomography pulmonary angiography potential for reduction of iodine load and radiation dose. Journal of Thoracic Imaging 30, 69–76 (2015).
Sabel, B. O. et al. High-Pitch CT Pulmonary Angiography in Third Generation Dual-Source CT: Image Quality in an Unselected Patient Population. PLoS One 11, e0146949 (2016).
Acknowledgements
This study was funded by Primary Research & Developement Plan of Jiangsu Province (BE2017772) and natural science foundation of Jiangsu province (BK20161609). Project of the Afilliated Hospital of Nan**g University of Chinese Medicine (Y18013).
Author information
Authors and Affiliations
Contributions
H.W., J.C., and Z.P. acquired the data. H.W., X.C., H.Z. and B.Q. analyzed the data. H.W. and X.C. wrote the main manuscript text. H.W., X.C., and Z.W. explained the results and revised the manuscript. All authors reviewed the manuscript.
Corresponding author
Ethics declarations
Competing interests
The authors declare no competing interests.
Additional information
Publisher’s note Springer Nature remains neutral with regard to jurisdictional claims in published maps and institutional affiliations.
Supplementary information
Rights and permissions
Open Access This article is licensed under a Creative Commons Attribution 4.0 International License, which permits use, sharing, adaptation, distribution and reproduction in any medium or format, as long as you give appropriate credit to the original author(s) and the source, provide a link to the Creative Commons license, and indicate if changes were made. The images or other third party material in this article are included in the article’s Creative Commons license, unless indicated otherwise in a credit line to the material. If material is not included in the article’s Creative Commons license and your intended use is not permitted by statutory regulation or exceeds the permitted use, you will need to obtain permission directly from the copyright holder. To view a copy of this license, visit http://creativecommons.org/licenses/by/4.0/.
About this article

Cite this article
Wu, H., Chen, X., Zhou, H. et al. An optimized test bolus for computed tomography pulmonary angiography and its application at 80 kV with 10 ml contrast agent. Sci Rep 10, 10208 (2020). https://doi.org/10.1038/s41598-020-67145-9
Received:
Accepted:
Published:
DOI: https://doi.org/10.1038/s41598-020-67145-9
- Springer Nature Limited