

Abstract
In the ongoing debates about eukaryogenesis—the series of evolutionary events leading to the emergence of the eukaryotic cell from prokaryotic ancestors—members of the Asgard archaea play a key part as the closest archaeal relatives of eukaryotes1. However, the nature and phylogenetic identity of the last common ancestor of Asgard archaea and eukaryotes remain unresolved2,3,4. Here we analyse distinct phylogenetic marker datasets of an expanded genomic sampling of Asgard archaea and evaluate competing evolutionary scenarios using state-of-the-art phylogenomic approaches. We find that eukaryotes are placed, with high confidence, as a well-nested clade within Asgard archaea and as a sister lineage to Hodarchaeales, a newly proposed order within Heimdallarchaeia. Using sophisticated gene tree and species tree reconciliation approaches, we show that analogous to the evolution of eukaryotic genomes, genome evolution in Asgard archaea involved significantly more gene duplication and fewer gene loss events compared with other archaea. Finally, we infer that the last common ancestor of Asgard archaea was probably a thermophilic chemolithotroph and that the lineage from which eukaryotes evolved adapted to mesophilic conditions and acquired the genetic potential to support a heterotrophic lifestyle. Our work provides key insights into the prokaryote-to-eukaryote transition and a platform for better understanding the emergence of cellular complexity in eukaryotic cells.
Main
Understanding how complex eukaryotic cells emerged from prokaryotic ancestors represents a major challenge in biology1,5. A main point of contention in refining eukaryogenesis scenarios revolves around the exact phylogenetic relationship between Archaea and eukaryotes. The use of phylogenomic approaches with improved models of sequence evolution combined with enhanced archaeal taxon sampling—progressively uncovered using metagenomics—has recently produced strong support for the two-domain tree of life, in which the eukaryotic clade branches from within Archaea6,7,8,9,10. The discovery of the first Lokiarchaeia genome provided additional evidence for the two-domain topology because this lineage was shown to represent, at the time, the closest relative of eukaryotes in phylogenomic analyses2. Moreover, Lokiarchaeia genomes specifically contain many genes that encode eukaryotic signature proteins (ESPs)—proteins involved in hallmark complex processes of the eukaryotic cell—more so than any other prokaryotic lineage. The subsequent identification and analyses of several diverse relatives of Lokiarchaeia, together forming the Asgard archaea superphylum, confirmed that Asgard archaea represent the closest archaeal relatives of eukaryotes1,2,3. Their exact evolutionary relationship to eukaryotes, however, remained unresolved. Specially, it has been unclear whether eukaryotes evolved from within Asgard archaea or whether they represented a sister lineage3. Furthermore, two studies questioned this view of the tree of life altogether, suggesting that Asgard archaea represent a deep-branching Euryarchaea-related clade11,12. These studies suggested that, in accordance with the three-domain tree, eukaryotes represent a sister group to all Archaea; however, this view has been challenged13,14. More recently, a study that included an expanded taxonomic sampling of Asgard archaeal genome data failed to resolve the phylogenetic position of eukaryotes in the tree of life4.
Here we expand the genomic diversity of Asgard archaea by generating 63 new Asgard archaeal metagenome-assembled genomes (MAGs) from samples obtained from 11 locations around the world. By analysing the enlarged genomic sampling of Asgard archaea using state-of-the-art phylogenomics analyses, including recently developed gene tree and species tree reconciliation approaches for ancestral genome content reconstruction, we firmly place eukaryotes as a clade nested within the Asgard archaea. By revealing key features regarding the identity, nature and physiology of the last Asgard archaea and eukaryotes common ancestor (LAECA), our results represent important, thus far missing pieces of the eukaryogenesis puzzle.
Expanded Asgard archaea genome diversity
To increase the genomic diversity of Asgard archaea, we sampled aquatic sediments and hydrothermal deposits from 11 geographically distinct sites (Supplementary Table 1 and Supplementary Fig. 1). After extraction and sequencing of total environmental DNA, we assembled and binned metagenomic contigs into MAGs. Of these MAGs, 63 belonged to the Asgard archaea superphylum, with estimated median completeness and redundancy values of 83% and 4.2%, respectively (Supplementary Table 1). To assess the genomic diversity in this dataset, we reconstructed a phylogeny of ribosomal proteins encoded in a conserved 15 ribosomal protein (RP15) gene cluster from these MAGs and in all publicly available Asgard archaea assemblies (retrieved 29 June 2021; Fig. 1). These analyses showed that we expanded the genomic sampling across previously described major Asgard archaea clades (that is, Lokiarchaeia, Thorarchaeia, Heimdallarchaeia, Odinarchaeia, Hermodarchaeia, Sifarchaeia, Jordarchaeia and Baldrarchaeia2,3,4,15,16). We also recovered a previously undescribed clade of high taxonomic rank (Candidatus Asgardarchaeia; see Extended Data Fig. 1 and Supplementary Information for a proposed uniformization of Asgard archaea taxonomic classification to which we will adhere throughout the current paper). We observed that the median estimated Asgard archaeal genome size (3.8 Mb) is considerably larger than those of representative genomes from TACK archaea and Euryarchaea (median = 1.8 Mb for both) and DPANN archaea (median = 1.2 Mb) (Supplementary Table 1). Among Asgard archaea, Odinarchaeia displayed the smallest genomes (median = 1.4 Mb), whereas Lokiarchaeales and Helarchaeales contained the largest (median = 4.3 Mb for both). Unlike other major Asgard archaeal clades, Heimdallarchaeia possessed a wide range of genome sizes, spanning from 1.6 to 7.4 Mb (median = 3.5 Mb). This large class contained five clades with diverse features: Njordarchaeales (median genome size = 2.4 Mb); Kariarchaeaceae (median genome size = 2.7 Mb); Gerdarchaeales (median genome size = 3.4 Mb); Heimdallarchaeaceae (median genome size = 3.7 Mb); and Hodarchaeales (median genome size = 5.1 Mb). The smallest heimdallarchaeial genome corresponded to the only Asgard archaeal MAG recovered from a marine surface water metagenome (Heimdallarchaeota archaeon RS678)17. This result is in agreement with the reduced genome sizes typically observed among prokaryotic plankton of the euphotic zone18 .
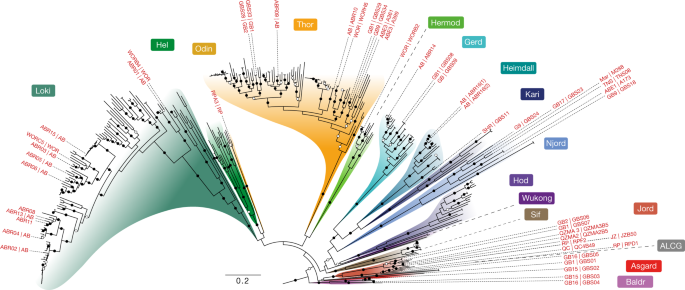
ML tree (IQ-TREE, WAG+C60+R4+F+PMSF model) of concatenated protein sequences from at least 5 genes, encoded on a single contig, of a RP15 gene cluster retrieved from publicly available and newly reported Asgard archaeal MAGs. Bootstrap support (100 pseudo-replicates) is indicated by circles at branches, with filled and open circles representing values equal to or larger than 90% and 70% support, respectively. Leaf names indicate the geographical source and isolate name (inner and outer label, respectively) for the MAGs reported in this study. Only the in-group is shown (263 out of 542 total sequences). Scale bar denotes the average number of substitutions per site. AB, Aarhus Bay (Denmark); ABE, ABE vent field, Eastern Lau Spreading Center; ALCG, Asgard Lake Cootharaba Group; Asgard, Asgardarchaeia; Baldr, Baldrarchaeia; GB, Guaymas Basin (Mexico); Gerd, Gerdarchaeales; Hel, Helarchaeales; Heimdall, Heimdallarchaeaceae; Hermod, Hermodarchaeia; Hod, Hodarchaeales; Jord, Jordarchaeia; JZ, **ze (China); Kari, Kariarchaeaceae; Loki, Lokiarchaeales; Mar, Mariner vent field, Eastern Lau Spreading Center; Njord, Njordarchaeales; Odin, Odinarchaeia; QC, QuCai village (China); QZM, QuZhuoMu village (China); RP, Radiata Pool (New Zealand); SHR, South Hydrate Ridge; Sif, Sifarchaeia; Thor, Thorarchaeia; TNS, Taketomi Island (Japan); WOR: White Oak River (USA); Wukong, Wukongarchaeia.
Identification of phylogenetic conflict
Inferring deep evolutionary relationships in the tree of life is considered one of the hardest problems in phylogenetics. To interrogate the evolutionary relationships within the current set of Asgard archaeal phyla, and between Asgard archaea and eukaryotes, we performed an exhaustive range of phylogenomic analyses. We analysed a pre-existing marker dataset comprising 56 concatenated ribosomal protein sequences (RP56)2,3 for a phylogenetically diverse set of 331 archaeal (175 Asgard archaea, 41 DPANN archaea, 43 Euryarchaea and 72 TACK archaea representatives) and 14 eukaryotic taxa (Supplementary Table 2). Of note, the inclusion of an expanded diversity of 12 new Korarchaeota MAGs among these TACK archaea considerably affected phylogenomic analyses (see below). Initial maximum-likelihood (ML) phylogenetic inference based on this RP56 dataset confirmed the existence of 12 major Asgard archaeal clades of high taxonomic rank (Supplementary Fig. 2). These included the previously described Lokiarchaeia, Odinarchaeia, Heimdallarchaeia and Thorarchaeia2,3, for which we present 36 new genomes here. The clades also included the recently proposed Sifarchaeia16, Hermodarchaeia15, Jordarchaeia19, Wukongarchaeia4 and Baldrarchaeia4, for most of which we also identified new near-complete MAGs. Finally, we identified 15 MAGs that represented the recently described Njordarchaeales102. All 56 trimmed ribosomal protein alignments were concatenated into a RP56-A64 supermatrix (236 taxa including 64 Asgard archaea, 6,332 amino acid positions). Once this taxon set was gathered, we identified homologues of the NM57 gene set as described above, thus generating supermatrix NM57-A64 (236 taxa, 14,847 amino acid positions).
We carried out a large number of phylogenomic analyses on variations of these two RP56-A64 and NM57-A64 datasets with different phylogenetic algorithms. Notably, preparing these datasets must be done with great care and is therefore time-consuming, and subsequent phylogenomic analyses generally require an enormous amount of computational running time. However, the rapid expansion of available Asgard archaeal MAGs, notably in a previous publication4, urged us to update and re-run many of the computationally demanding analyses. As some of the work that was based on a more restrained taxon sampling is still deemed valuable, such as some of the Bayesian phylogenomic analyses and ancestral genome content reconstructions, we retained these in the current study.
An updated Asgard archaeal genomic sequence dataset was constructed by including all 230 Asgard archaeal MAGs and genomes available at the NCBI database as of 12 May 2021, as well as 63 new MAGs described in the current work. All 56 trimmed ribosomal protein alignments were concatenated into an RP56-A293 supermatrix (465 taxa including 293 Asgard archaea, 7,112 amino acid positions), which was used to infer a preliminary phylogeny using FastTree (v.2)103 (Supplementary Fig. 16). Given the high computational demands of the subsequent analyses, we then used this phylogeny to select a subsample of Asgard archaea representatives. For this, we first removed the most incomplete MAGs encoding fewer than 19 ribosomal proteins (that is, one-third of the markers) in the matrix. We also used the preliminary phylogeny to subselect among closely related taxa: among taxa that were separated by branch lengths of <0.1, we only kept one representative. This led to a selection of 331 genomes, including 175 Asgard archaea, 41 DPANN, 43 Euryarchaea and 72 TACK representatives (RP56-A175 dataset). Out of these 175 Asgard archaea, 41 correspond to MAGs newly reported here. Once this taxon set was gathered, we identified homologues of the NM57 gene set as described above, thus generating supermatrix NM57-A175 (15,733 amino acid positions). All datasets and their composition are summarized in Supplementary Table 2.
To test for potential phylogenetic reconstruction artefacts, our datasets were subjected to several treatments. Supermatrices were recoded into four categories using the SR4 scheme25. The corresponding phylogenies were reconstructed using IQ-TREE (using a user-defined previously described model referred to as C60SR4 based on the implemented C60 model and modified to analyse the recoded data3) and Phylobayes (under the CAT+GTR model). We also used the estimated site rate output generated by IQ-TREE (-wsr) to classify sites into 10 categories, from the fastest to the slowest evolving, and we removed them in a stepwise fashion, removing from 10% to 90% of the data. Finally, we combined both approaches by applying SR4 recoding to the alignments obtained after each fast-site removal step. All phylogenetic analyses performed are summarized in Supplementary Table 2. See Supplementary Information for details and discussion.
Analyses of individual proteins
For individual proteins of interest, we gathered homologues using various approaches depending on the level of conservation across taxa. To detect putative Asgard homologues of eukaryotic proteins, we used a combination of tools, including BLASTp104 and the HMMer toolkit (http://hmmer.org/) if HMM profiles were available, and queried a local database containing our 240 archaeal representatives (including all Asgard predicted proteomes). We then investigated the Asgard candidates as following: (1) using them as seed for BLASTp searches against the nr database; (2) 3D modelling using Phyre2 and SwissModel when sequence similarity was low; (3) annotating them using Interproscan (v.5.25-64.0)105, EggNOG mapper (v.0.12.7)106, against the NOG database106, and GhostKoala annotation server107; (4) annotating the archaeal orthologous cluster they belonged to using profile–profile annotation as described above. Eukaryotic homologues were gathered from the UniRef50 database108. Depending on the divergence between homologues, they were aligned using mafft-linsi and trimmed using TrimAl109 (--automated1) or BMGE102, or, in cases where we investigated a specific functional domain, we used the hmmalign tool from the HMMer package with the --trim flag to only keep and align the region corresponding to this domain. When divergence levels allowed, phylogenetic analyses were performed using IQ-TREE with model testing including the C-series mixture models (-mset option)110. Statistical support was evaluated using 1,000 ultrafast bootstrap replicates (for IQ-TREE)109.
Ancestral reconstruction
For the ancestral reconstruction analyses, only a subset of 181 taxa were included (64 Asgard, 74 TACK and 43 Euryarchaea; see Supplementary Table 2 for details). Protein families with more than three members were aligned and trimmed using mafft-linsi (v.7.402)101 and trimAl (v.1.4.rev15) with the --gappyout option109. Tree distributions for individual protein families were estimated using IQ-TREE (v.1.6.5) (-bb 1000 -bnni -m TESTNEW -mset LG -madd LG+C10,LG+C20 -seed 12345 -wbtl -keep-ident)111. The species phylogeny together with the gene tree distributions were subsequently used to compute 100 gene–tree species tree reconciliations using ALEobserve (v.0.4) and ALEml_undated112,113, including the fraction_missing option that accounts for incomplete genomes. The genome copy number was corrected to account for the extinction probability per cluster (https://github.com/maxemil/ALE/commit/136b78e). The missing fraction of the genome was calculated as 1 minus the completeness values (in fraction) as estimated by CheckM (v.1.0.5) for each of the 181 taxa67. Protein families containing only one protein (singletons) were considered as originations at the corresponding leaf. The ancestral reconstruction of 5 protein families that included more than 2,000 proteins raised errors and could not be computed. The minimum threshold of the raw reconciliation frequencies for an event to be considered was set to 0.3 as commonly done114,115,116,117 and recommended by the authors of ALE (G. Szölősi, personal communication).
Ancestral metabolic inferences
Metabolic reconstruction of the Asgard ancestors was based on the inference, annotation and copy number of genes in ancestral nodes. The presence of a given gene was scored if its copy number in the ancestral nodes was above 0.3. A protein family was scored as ‘maybe present’ if the inferred copy number was between 0.1 and 0.3. The protein annotation of each of the clusters containing the ancestral nodes was manually verified for each of the enzymatic steps involved in the pathways, as detailed in Supplementary Table 4.
Reporting summary
Further information on research design is available in the Nature Portfolio Reporting Summary linked to this article.
Data availability
The MAGs reported in this study have been deposited at the DNA Data Bank of Japan, the European Molecular Biology Laboratory and GenBank. BioProject identifiers, BioSample identifiers and GenBank assembly accession numbers are provided in Supplementary Table 1. All raw data underlying phylogenomic analyses (raw and processed alignments and corresponding phylogenetic trees), and all predicted proteomes have been deposited into Figshare (https://doi.org/10.6084/m9.figshare.22678789).
Code availability
Custom code used for data analysis is available at GitHub: https://github.com/laurajjeme/phylogenetics.
Change history
08 March 2024
Editor’s Note: Readers are alerted that technical issues with the phylogenomic analysis using the NM57 dataset (Figure 2 and any related and downstream analyses) in this paper are being evaluated. Appropriate editorial action will be taken once this matter is resolved.
References
Eme, L., Spang, A., Lombard, J., Stairs, C. W. & Ettema, T. J. G. Archaea and the origin of eukaryotes. Nat. Rev. Microbiol. 15, 711–723 (2017).
Spang, A. et al. Complex archaea that bridge the gap between prokaryotes and eukaryotes. Nature 521, 173–179 (2015).
Zaremba-Niedzwiedzka, K. et al. Asgard archaea illuminate the origin of eukaryotic cellular complexity. Nature 541, 353–358 (2017).
Liu, Y. et al. Expanded diversity of Asgard archaea and their relationships with eukaryotes. Nature 593, 553–557 (2021).
López-García, P. & Moreira, D. Open questions on the origin of eukaryotes. Trends Ecol. Evol. 30, 697–708 (2015).
Guy, L. & Ettema, T. J. G. The archaeal ‘TACK’ superphylum and the origin of eukaryotes. Trends Microbiol. 19, 580–587 (2011).
Kelly, S., Wickstead, B. & Gull, K. Archaeal phylogenomics provides evidence in support of a methanogenic origin of the Archaea and a thaumarchaeal origin for the eukaryotes. Proc. Biol. Sci. 278, 1009–1018 (2011).
Williams, T. A., Foster, P. G., Cox, C. J. & Embley, T. M. An archaeal origin of eukaryotes supports only two primary domains of life. Nature 504, 231–236 (2013).
Raymann, K., Brochier-Armanet, C. & Gribaldo, S. The two-domain tree of life is linked to a new root for the Archaea. Proc. Natl Acad. Sci. USA 112, (2015).
Cox, C. J., Foster, P. G., Hirt, R. P., Harris, S. R. & Embley, T. M. The archaebacterial origin of eukaryotes. Proc. Natl Acad. Sci. USA 105, 20356–20361 (2008).
Da Cunha, V. et al. Lokiarchaea are close relatives of Euryarchaeota, not bridging the gap between prokaryotes and eukaryotes. PLoS Genet. 13, e1006810 (2017).
Da Cunha, V., Gaia, M., Nasir, A. & Forterre, P. Asgard archaea do not close the debate about the universal tree of life topology. PLoS Genet. 14, e1007215 (2018).
Spang, A. et al. Asgard archaea are the closest prokaryotic relatives of eukaryotes. PLoS Genet. 14, e1007080 (2018).
Williams, T. A., Cox, C. J., Foster, P. G., Szöllősi, G. J. & Embley, T. M. Phylogenomics provides robust support for a two-domains tree of life. Nat. Ecol. Evol. 4, 138–147 (2020).
Zhang, J.-W. et al. Newly discovered Asgard archaea Hermodarchaeota potentially degrade alkanes and aromatics via alkyl/benzyl-succinate synthase and benzoyl-CoA pathway. ISME J. https://doi.org/10.1038/s41396-020-00890-x (2021).
Farag, I. F., Zhao, R. & Biddle, J. F. ‘Sifarchaeota’ a novel Asgard phylum from Costa Rica sediment capable of polysaccharide degradation and anaerobic methylotrophy. Appl. Environ. Microbiol. 87, e02584-20 (2021).
Tully, B. J., Graham, E. D. & Heidelberg, J. F. The reconstruction of 2,631 draft metagenome-assembled genomes from the global oceans. Sci. Data 5, 170203 (2018).
Swan, B. K. et al. Prevalent genome streamlining and latitudinal divergence of planktonic bacteria in the surface ocean. Proc. Natl Acad. Sci. USA 110, 11463–11468 (2013).
Sun, J. et al. Recoding of stop codons expands the metabolic potential of two novel Asgardarchaeota lineages. ISME Commun. 1, 30 (2021).
**e, R. et al. Expanding Asgard members in the domain of Archaea sheds new light on the origin of eukaryotes. Sci. China Life Sci. 65, 818–829 (2022).
Ramulu, H. G. et al. Ribosomal proteins: toward a next generation standard for prokaryotic systematics? Mol. Phylogenet. Evol. 75, 103–117 (2014).
Petitjean, C., Deschamps, P., López-García, P. & Moreira, D. Rooting the domain Archaea by phylogenomic analysis supports the foundation of the new kingdom Proteoarchaeota. Genome Biol. Evol. 7, 191–204 (2014).
Anishchenko, I., Ovchinnikov, S., Kamisetty, H. & Baker, D. Origins of coevolution between residues distant in protein 3D structures. Proc. Natl Acad. Sci. USA 114, 9122–9127 (2017).
Foster, P. G. & Hickey, D. A. Compositional bias may affect both DNA-based and protein-based phylogenetic reconstructions. J. Mol. Evol. 48, 284–90 (1999).
Susko, E. & Roger, A. J. On reduced amino acid alphabets for phylogenetic inference. Mol. Biol. Evol. 24, 2139–2150 (2007).
Brown, M. W. et al. Phylogenomics demonstrates that breviate flagellates are related to opisthokonts and apusomonads. Proc. R. Soc. B Biol. Sci. 280, 20131755 (2013).
Jeffroy, O., Brinkmann, H., Delsuc, F. & Philippe, H. Phylogenomics: the beginning of incongruence? Trends Genet. 22, 225–231 (2006).
Viklund, J., Ettema, T. J. G. & Andersson, S. G. E. Independent genome reduction and phylogenetic reclassification of the oceanic SAR11 clade. Mol. Biol. Evol. 29, 599–615 (2012).
Narrowe, A. B. et al. Complex evolutionary history of translation elongation factor 2 and diphthamide biosynthesis in Archaea and Parabasalids. Genome Biol. Evol. 10, 2380–2393 (2018).
Wang, L. & Dobberstein, B. Oligomeric complexes involved in translocation of proteins across the membrane of the endoplasmic reticulum. FEBS Lett. 457, 316–322 (1999).
Pfeffer, S. et al. Dissecting the molecular organization of the translocon-associated protein complex. Nat. Commun. 8, 14516 (2017).
Bai, L., Wang, T., Zhao, G., Kovach, A. & Li, H. The atomic structure of a eukaryotic oligosaccharyltransferase complex. Nature 555, 328–333 (2018).
Klinger, C. M. et al. Tracing the archaeal origins of eukaryotic membrane-trafficking system building blocks. Mol. Biol. Evol. 33, 1528–1541 (2016).
Rout, M. P. & Field, M. C. The evolution of organellar coat complexes and organization of the eukaryotic cell. Annu. Rev. Biochem. 86, 637–657 (2017).
Seaman, M. N. J. The retromer complex—endosomal protein recycling and beyond. J. Cell Sci. 125, 4693–4702 (2012).
Liewen, H. et al. Characterization of the human GARP (Golgi associated retrograde protein) complex. Exp. Cell. Res. 306, 24–34 (2005).
Villaseñor, R., Kalaidzidis, Y. & Zerial, M. Signal processing by the endosomal system. Curr. Opin. Cell Biol. 39, 53–60 (2016).
Hatano, T. et al. Asgard archaea shed light on the evolutionary origins of the eukaryotic ubiquitin–ESCRT machinery. Nat. Commun. 13, 3398 (2022).
Imachi, H. et al. Isolation of an archaeon at the prokaryote–eukaryote interface. Nature 577, 519–525 (2020).
Rodrigues-Oliveira, T. et al. Actin cytoskeleton and complex cell architecture in an Asgard archaeon. Nature https://doi.org/10.1038/s41586-022-05550-y (2022).
López-García, P. & Moreira, D. The Syntrophy hypothesis for the origin of eukaryotes revisited. Nat. Microbiol. 5, 655–667 (2020).
Spang, A. et al. Proposal of the reverse flow model for the origin of the eukaryotic cell based on comparative analyses of Asgard archaeal metabolism. Nat. Microbiol. 4, 1138–1148 (2019).
Betts, H. C. et al. Integrated genomic and fossil evidence illuminates life’s early evolution and eukaryote origin. Nat. Ecol. Evol. 2, 1556–1562 (2018).
Seitz, K. W. et al. Asgard archaea capable of anaerobic hydrocarbon cycling. Nat. Commun. 10, 1822 (2019).
Liu, Y. et al. Comparative genomic inference suggests mixotrophic lifestyle for Thorarchaeota. ISME J. 12, 1021–1031 (2018).
Bulzu, P.-A. et al. Casting light on Asgardarchaeota metabolism in a sunlit microoxic niche. Nat. Microbiol. 4, 1129–1137 (2019).
Sabath, N., Ferrada, E., Barve, A. & Wagner, A. Growth temperature and genome size in bacteria are negatively correlated, suggesting genomic streamlining during thermal adaptation. Genome Biol. Evol. 5, 966–977 (2013).
Savelieff, M. G. et al. Experimental evidence for a link among cupredoxins: red, blue, and purple copper transformations in nitrous oxide reductase. Proc. Natl Acad. Sci. USA 105, 7919–7924 (2008).
Akıl, C. & Robinson, R. C. Genomes of Asgard archaea encode profilins that regulate actin. Nature 562, 439–443 (2018).
Orsi, W. D. et al. Metabolic activity analyses demonstrate that Lokiarchaeon exhibits homoacetogenesis in sulfidic marine sediments. Nat. Microbiol. 5, 248–255 (2020).
Akıl, C. et al. Insights into the evolution of regulated actin dynamics via characterization of primitive gelsolin/cofilin proteins from Asgard archaea. Proc. Natl Acad. Sci. USA 117, 19904–19913 (2020).
Williams, T. A. et al. Inferring the deep past from molecular data. Genome Biol. Evol. https://doi.org/10.1093/gbe/evab067 (2021).
Vosseberg, J. et al. Timing the origin of eukaryotic cellular complexity with ancient duplications. Nat. Ecol. Evol. 5, 92–100 (2021).
Hua, Z.-S. et al. Genomic inference of the metabolism and evolution of the archaeal phylum Aigarchaeota. Nat. Commun. 9, 2832 (2018).
Chen, L.-X. et al. Candidate phyla radiation Roizmanbacteria from hot springs have novel and unexpectedly abundant CRISPR–Cas systems. Front. Microbiol. 10, 928 (2019).
Langmead, B. & Salzberg, S. L. Fast gapped-read alignment with Bowtie 2. Nat. Methods 9, 357–359 (2012).
Kang, D. D., Froula, J., Egan, R. & Wang, Z. MetaBAT, an efficient tool for accurately reconstructing single genomes from complex microbial communities. PeerJ 3, e1165 (2015).
Dick, G. J. et al. Community-wide analysis of microbial genome sequence signatures. Genome Biol. 10, R85 (2009).
Brown, C. T. et al. Unusual biology across a group comprising more than 15% of domain Bacteria. Nature 523, 208–211 (2015).
Flores, G. E. et al. Inter-field variability in the microbial communities of hydrothermal vent deposits from a back-arc basin. Geobiology 10, 333–346 (2012).
Bolger, A. M., Lohse, M. & Usadel, B. Trimmomatic: a flexible trimmer for Illumina sequence data. Bioinformatics 30, 2114–2120 (2014).
Crusoe, M. R. et al. The khmer software package: enabling efficient nucleotide sequence analysis. F1000Res. 4, 900 (2015).
Li, D., Liu, C.-M., Luo, R., Sadakane, K. & Lam, T.-W. MEGAHIT: an ultra-fast single-node solution for large and complex metagenomics assembly via succinct de Bruijn graph. Bioinformatics 31, 1674–1676 (2015).
Li, D. et al. MEGAHIT v1.0: s fast and scalable metagenome assembler driven by advanced methodologies and community practices. Methods 102, 3–11 (2016).
Langmead, B., Trapnell, C., Pop, M. & Salzberg, S. L. Ultrafast and memory-efficient alignment of short DNA sequences to the human genome. Genome Biol. 10, R25 (2009).
Li, H. et al. The Sequence Alignment/Map format and SAMtools. Bioinformatics 25, 2078–2079 (2009).
Parks, D. H., Imelfort, M., Skennerton, C. T., Hugenholtz, P. & Tyson, G. W. CheckM: assessing the quality of microbial genomes recovered from isolates, single cells, and metagenomes. Genome Res. 25, 1043–1055 (2015).
Seitz, K. W., Lazar, C. S., Hinrichs, K.-U., Teske, A. P. & Baker, B. J. Genomic reconstruction of a novel, deeply branched sediment archaeal phylum with pathways for acetogenesis and sulfur reduction. ISME J. 10, 1696–1705 (2016).
Alneberg, J. et al. Binning metagenomic contigs by coverage and composition. Nat. Methods 11, 1144–1146 (2014).
Ounit, R., Wanamaker, S., Close, T. J. & Lonardi, S. CLARK: fast and accurate classification of metagenomic and genomic sequences using discriminative k-mers. BMC Genomics 16, 236 (2015).
Bankevich, A. et al. SPAdes: a new genome assembly algorithm and its applications to single-cell sequencing. J. Comput. Biol. 19, 455–477 (2012).
Peng, Y., Leung, H. C. M., Yiu, S. M. & Chin, F. Y. L. IDBA-UD: a de novo assembler for single-cell and metagenomic sequencing data with highly uneven depth. Bioinformatics 28, 1420–1428 (2012).
Hugoson, E., Lam, W. T. & Guy, L. miComplete: weighted quality evaluation of assembled microbial genomes. Bioinformatics https://doi.org/10.1093/bioinformatics/btz664 (2019).
Karst, S. M., Kirkegaard, R. H. & Albertsen, M. mmgenome: a toolbox for reproducible genome extraction from metagenomes. Preprint at bioRxiv https://doi.org/10.1101/059121 (2016).
Albertsen, M. et al. Genome sequences of rare, uncultured bacteria obtained by differential coverage binning of multiple metagenomes. Nat. Biotechnol. 31, 533–538 (2013).
Dombrowski, N., Teske, A. P. & Baker, B. J. Expansive microbial metabolic versatility and biodiversity in dynamic Guaymas Basin hydrothermal sediments. Nat. Commun. 9, 4999 (2018).
Dombrowski, N., Seitz, K. W., Teske, A. P. & Baker, B. J. Genomic insights into potential interdependencies in microbial hydrocarbon and nutrient cycling in hydrothermal sediments. Microbiome 5, 106 (2017).
Tréhu, A. M. et al. Feeding methane vents and gas hydrate deposits at south Hydrate Ridge. Geophys. Res. Lett. https://doi.org/10.1029/2004gl021286 (2004).
Nunoura, T., Inagaki, F., Delwiche, M. E., Colwell, F. S. & Takai, K. Subseafloor microbial communities in methane hydrate-bearing sediment at two distinct locations (ODP Leg204) in the Cascadia Margin. Microbes Environ. 23, 317–325 (2008).
Inagaki, F. et al. Biogeographical distribution and diversity of microbes in methane hydrate-bearing deep marine sediments on the Pacific Ocean Margin. Proc. Natl Acad. Sci. USA 103, 2815–2820 (2006).
Martin, M. Cutadapt removes adapter sequences from high-throughput sequencing reads. EMBnet J. 17, 10 (2011).
Hug, L. A. et al. Community genomic analyses constrain the distribution of metabolic traits across the Chloroflexi phylum and indicate roles in sediment carbon cycling. Microbiome 1, 22 (2013).
Parks, D. H. et al. A complete domain-to-species taxonomy for Bacteria and Archaea. Nat. Biotechnol. 38, 1079–1086 (2020); author correction 38, 1098 (2020).
Romalde, J. L., Balboa, S. & Ventosa, A. Microbial Taxonomy, Phylogeny and Biodiversity (Frontiers Media, 2019).
Wang, H.-C., Minh, B. Q., Susko, E. & Roger, A. J. Modeling site heterogeneity with posterior mean site frequency profiles accelerates accurate phylogenomic estimation. Syst. Biol. 67, 216–235 (2018).
Seemann, T. Prokka: rapid prokaryotic genome annotation. Bioinformatics 30, 2068–2069 (2014).
Wickham, H. et al. Welcome to the Tidyverse. J. Open Source Softw. 4, 1686 (2019).
Chan, P. P. & Lowe, T. M. in Gene Prediction: Methods and Protocols (ed. Kollmar, M.) 1–14 (Springer New York, 2019).
Sauer, D. B. & Wang, D.-N. Predicting the optimal growth temperatures of prokaryotes using only genome derived features. Bioinformatics https://doi.org/10.1093/bioinformatics/btz059 (2019).
Buchfink, B., **e, C. & Huson, D. H. Fast and sensitive protein alignment using DIAMOND. Nat. Methods 12, 59–60 (2015).
Miele, V., Penel, S. & Duret, L. Ultra-fast sequence clustering from similarity networks with SiLiX. BMC Bioinformatics 12, 116 (2011).
Miele, V. et al. High-quality sequence clustering guided by network topology and multiple alignment likelihood. Bioinformatics 28, 1078–1085 (2012).
Katoh, K. & Toh, H. Recent developments in the MAFFT multiple sequence alignment program. Brief. Bioinformatics 9, 286–298 (2008).
Remmert, M., Biegert, A., Hauser, A. & Söding, J. HHblits: lightning-fast iterative protein sequence searching by HMM-HMM alignment. Nat. Methods 9, 173–175 (2011).
Huerta-Cepas, J. et al. eggNOG 4.5: a hierarchical orthology framework with improved functional annotations for eukaryotic, prokaryotic and viral sequences. Nucleic Acids Res. 44, D286–D293 (2016).
Makarova, K. S., Wolf, Y. I. & Koonin, E. V. Archaeal Clusters of Orthologous Genes (arCOGs): an update and application for analysis of shared features between Thermococcales, Methanococcales, and Methanobacteriales. Life 5, 818–840 (2015).
Finn, R. D. et al. Pfam: the protein families database. Nucleic Acids Res. 42, D222–D230 (2014).
Eddy, S. R. Accelerated profile HMM searches. PLoS Comput. Biol. 7, e1002195 (2011).
Kelley, L. A., Mezulis, S., Yates, C. M., Wass, M. N. & Sternberg, M. J. E. The Phyre2 web portal for protein modeling, prediction and analysis. Nat. Protoc. 10, 845–858 (2015).
Petitjean, C., Deschamps, P., López-García, P., Moreira, D. & Brochier-Armanet, C. Extending the conserved phylogenetic core of archaea disentangles the evolution of the third domain of life. Mol. Biol. Evol. 32, 1242–1254 (2015).
Katoh, K. & Standley, D. M. MAFFT multiple sequence alignment software version 7: improvements in performance and usability. Mol. Biol. Evol. 30, 772–780 (2013).
Criscuolo, A. & Gribaldo, S. BMGE (block map** and gathering with entropy): a new software for selection of phylogenetic informative regions from multiple sequence alignments. BMC Evol. Biol. 10, 210 (2010).
Price, M. N., Dehal, P. S. & Arkin, A. P. FastTree 2—approximately maximum-likelihood trees for large alignments. PLoS ONE 5, e9490 (2010).
Camacho, C. et al. BLAST: architecture and applications. BMC Bioinformatics 10, 421 (2009).
Jones, P. et al. InterProScan 5: genome-scale protein function classification. Bioinformatics 30, 1236–1240 (2014).
Huerta-Cepas, J. et al. Fast genome-wide functional annotation through orthology assignment by eggNOG-Mapper. Mol. Biol. Evol. 34, 2115–2122 (2017).
Kanehisa, M., Sato, Y. & Morishima, K. BlastKOALA and GhostKOALA: KEGG tools for functional characterization of genome and metagenome sequences. J. Mol. Biol. 428, 726–731 (2016).
Suzek, B. E. et al. UniRef clusters: a comprehensive and scalable alternative for improving sequence similarity searches. Bioinformatics 31, 926–932 (2015).
Capella-Gutiérrez, S., Silla-Martínez, J. M. & Gabaldón, T. trimAl: a tool for automated alignment trimming in large-scale phylogenetic analyses. Bioinformatics 25, 1972–1973 (2009).
Nguyen, L.-T., Schmidt, H. A., von Haeseler, A. & Minh, B. Q. Iq-tree: a fast and effective stochastic algorithm for estimating maximum-likelihood phylogenies. Mol. Biol. Evol. 32, 268–274 (2015).
Hoang, D. T., Chernomor, O., von Haeseler, A., Minh, B. Q. & Vinh, L. S. UFBoot2: improving the ultrafast bootstrap approximation. Mol. Biol. Evol. 35, 518–522 (2018).
Szöllõsi, G. J., Rosikiewicz, W., Boussau, B., Tannier, E. & Daubin, V. Efficient exploration of the space of reconciled gene trees. Syst. Biol. 62, 901–912 (2013).
Szöllősi, G. J., Davín, A. A., Tannier, E., Daubin, V. & Boussau, B. Genome-scale phylogenetic analysis finds extensive gene transfer among fungi. Philos. Trans. R. Soc. Lond. B Biol. Sci. 370, 20140335 (2015).
Martijn, J. et al. Hikarchaeia demonstrate an intermediate stage in the methanogen-to-halophile transition. Nat. Commun. https://doi.org/10.1038/s41467-020-19200-2 (2020).
Huang, W.-C. et al. Comparative genomic analysis reveals metabolic flexibility of Woesearchaeota. Nat. Commun. 12, 5281 (2021).
Martijn, J., Vosseberg, J., Guy, L., Offre, P. & Ettema, T. J. G. Phylogenetic affiliation of mitochondria with Alpha-II and Rickettsiales is an artefact. Nat. Ecol. Evol. https://doi.org/10.1038/s41559-022-01871-3 (2022).
Dharamshi, J. E. et al. Gene gain facilitated endosymbiotic evolution of Chlamydiae. Nat. Microbiol. 8, 40–54 (2023).
Kim, E. et al. Implication of mouse Vps26b–Vps29–Vps35 retromer complex in sortilin trafficking. Biochem. Biophys. Res. Commun. 403, 167–171 (2010).
Suzuki, S. W., Chuang, Y.-S., Li, M., Seaman, M. N. J. & Emr, S. D. A bipartite sorting signal ensures specificity of retromer complex in membrane protein recycling. J. Cell Biol. 218, 2876–2886 (2019).
Graham, S. C. et al. Structural basis of Vps33A recruitment to the human HOPS complex by Vps16. Proc. Natl Acad. Sci. USA 110, 13345–13350 (2013).
Jiang, P. et al. The HOPS complex mediates autophagosome–lysosome fusion through interaction with syntaxin 17. Mol. Biol. Cell 25, 1327–1337 (2014).
Balderhaar, H. J. K. & Ungermann, C. CORVET and HOPS tethering complexes—coordinators of endosome and lysosome fusion. J. Cell Sci. 126, 1307–1316 (2013).
Pérez-Victoria, F. J. et al. Structural basis for the wobbler mouse neurodegenerative disorder caused by mutation in the Vps54 subunit of the GARP complex. Proc. Natl Acad. Sci. USA 107, 12860–12865 (2010).
Acknowledgements
We thank S. Köstlbacher, L. Hederstedt, A. Spang and A. J. Roger for discussions; staff at the Uppsala Multidisciplinary Center for Advanced Computational Science (UPPMAX) at Uppsala University and the Swedish National Infrastructure for Computing (SNIC) at the PDC Center for High-Performance Computing for providing computational resources; staff at the Japan Agency for Marine-Earth Science and Technology (JAMSTEC) for taking sediment samples from the Taketomi shallow submarine hydrothermal system; and the crew of the RV Roger Revelle for assisting with the sampling of the ABE and Mariner vent fields along the Eastern Lau Spreading Center during the RR1507 Expedition. The Ngāti Tahu–Ngāti Whaoa Runanga Trust is acknowledged as mana whenua of Radiata Pool and associated samples, and we thank them for their assistance in access and sampling of the Ngatamariki geothermal features. We thank the Kingdom of Tonga for access to the deep-sea hydrothermal vent sites along the ELSC. Sampling in the Eastern Lau Spreading Center and Guaymas Basin (Gulf of California) was supported by the US-National Science Foundation (NSF-OCE-1235432 to A.-L.R. and NSF-OCE-0647633 to A.P.T.). A subset of Guaymas sediments were sequenced by the US Department of Energy Joint Genome Institute, a DOE Office of Science User Facility under contract number DE-AC02-05CH11231 granted to N.D. We thank the captain and crew of RV Aurora for assistance during sampling at Aarhus Bay. Sampling at Aarhus Bay was supported by the VILLUM Experiment project “FISHing for the ancestors of the eukaryotic cell” (grant number 17621 to A.S. and K.U.K.). This work was supported by grants of the European Research Council (ERC Starting and Consolidator grants 310039 and 817834, respectively), the Swedish Research Council (VR grant 2015-04959), the Dutch Research Council (NWO-VICI grant VI.C.192.016), Marie Skłodowska-Curie ITN project SINGEK (H2020-MSCA-ITN-2015-675752) and the Wellcome Trust foundation (Collaborative award 203276/K/16/Z) awarded to T.J.G.E. L.E. was supported by a Marie Skłodowska-Curie IEF (grant 704263) and by funding from the European Research Council (ERC Starting grant 803151). T.N. was supported by JSPS KAKENHI JP19H05684 within JP19H05679. W.-J.L. was supported by the National Natural Science Foundation of China (grant number 91951205 and 92251302). D.T. was supported by the Swedish Research Council (International Postdoc grant 2018-06609). C.W.S. was supported by a Science for Life Laboratory postdoctoral fellowship (awarded to T.J.G.E.) and funding from the Swedish research council (Vetenskaprådet Starting grant 2020-05071 to C.W.S.). J.L. was supported by the Wenner-Gren Foundation (fellowship 2016-0072). J.H.S. was supported by a Marie Skłodowska-Curie IIF grant (331291). This work was also supported by the Moore-Simons Project on the Origin of the Eukaryotic Cell, Simons Foundation 73592LPI to T.J.G.E. and B.J.B. (https://doi.org/10.46714/735925LPI) and Simons Foundation 812811 to L.E. (https://doi.org/10.46714/735923LPI), and NSF Division of Biological Science SBS Biodiversity: Discovery and Analysis program (1753661) to B.J.B. This work made use of the Dutch national e-infrastructure with the support of the SURF Cooperative using grant no. EINF-2953. to T.E.
Funding
Open access funding provided by Uppsala University.
Author information
Authors and Affiliations
Contributions
T.J.G.E. conceived and supervised the study. A.S., K.U.K., W.H.L., Z.-S.H., A.-L.R., W.-J.L., T.N., M.B.S. and A.P.T. collected and provided environmental samples. E.F.C., F.H., J.H.S., N.D., K.W.S., B.J.B., L.-X.C., J.F.B. and E.S.J. performed metagenomic sequence assemblies and metagenomic binning analyses. L.E., D.T., E.F.C., C.W.S., K.W.S., J.L., B.J.B. and T.J.G.E. analysed the genomic data. L.E., D.T., E.F.C. and F.H. performed phylogenomic analyses. L.E., D.T., E.F.C., C.W.S., J.L. and T.J.G.E. investigated ESPs. E.F.C., L.E. and M.E.S. performed ancestral genome reconstruction analyses. V.D.A., C.W.S, B.J.B., L.E. and T.J.G.E. carried out metabolic inferences. L.E., D.T., E.F.C., C.W.S., V.D.A., B.J.B. and T.J.G.E. wrote, and all authors edited and approved, the manuscript.
Corresponding author
Ethics declarations
Competing interests
The authors declare no competing interests.
Peer review
Peer review information
Nature thanks the anonymous reviewers for their contribution to the peer review of this work. Peer reviewer reports are available.
Additional information
Publisher’s note Springer Nature remains neutral with regard to jurisdictional claims in published maps and institutional affiliations.
Extended data figures and tables
Extended Data Fig. 1 Cladogram of proposed taxonomic scheme for the ranks of family, order and class for Asgard archaeal lineages employed in this study.
Equivalent names in GTDB are shown in parentheses. Cases with differing or new names have been highlighted in colored bold italics.
Extended Data Fig. 2 Asgard archaea encode homologs of eukaryotic protein complexes involved in N-glycosylation.
The Sec61, the OST and TRAP complexes are depicted according to their eukaryotic composition and localization. On the right-hand side of the panel, dark-colored subunits represent eukaryotic proteins which have prokaryotic homologs in Asgard archaea newly identified as part of this work; Light-colored subunit homologs have been described previously3. Figure generated using BioRender (https://www.biorender.com).
Extended Data Fig. 3 Identification of previously undetected vesicular trafficking ESPs in Asgard archaea.
Schematic representation of a eukaryotic cell in which ESPs involved in membrane trafficking and endosomal sorting that have been identified in Asgard archaea are highlighted. Colored subunits have been detected in some Asgard archaea while grey ones seem to be absent from all current representatives. Only major protein complexes are depicted. Additional components can be found in Fig. 2. From left to right, top to bottom: RC, Retromer complex. Retromer is a coat-like complex associated with endosome-to-Golgi retrograde traffic35. It is formed by Vacuolar protein sorting-associated protein 35, Vps5, Vps17, Vps26 and Vps29118. During cargo recycling, retromer is recruited to the endosomal membrane via the Vps5-Vps17 dimer. Cargo recognition is thought to be mediated primarily through Vps26 and possibly by Vps35. Finally, the BAR domains of Vps5-Vps17 deform the endosomal membrane to form cargo-containing recycling vesicles. Their distribution is sparse, but we have detected Asgard archaeal homologs of all subunits except for Vps17. Interestingly, the Thorarchaeia Vps5-BAR domain is often fused to Vps28, a subunit of the ESCRT machinery complex I, suggesting a functional link between BAR domain proteins and the thorarchaeial ESCRT complex. The best-characterized retromer cargo is Vps10. This transmembrane protein receptor is known in yeast and mammal cells to be involved in the sorting and transport of lipoproteins between the Golgi and the endosome. The Vps10 receptor releases its cargo to the endosome and is recycled back to the Golgi via the retromer complex119. CORVET: Class C core vacuole/endosome tethering complex; HOPS: Homotypic fusion and protein sorting complex. Endosomal fusion and autophagy depend on the CORVET and HOPS hexameric complexes37; they share the core subunits Vps11, Vps16, Vps18, and Vps33120. In addition, HOPS is composed of Vps41 and Vps39121. Vps39, found associated to late endosomes and lysosomes, promotes endosomes/lysosomes clustering and their fusion with autophagosomes122. AP, Adaptor Proteins. Asgard archaea genomes from diverse phyla encode key functional domains of the AP complexes. The eukaryotic AP tetraheteromeric structure is depicted, each color corresponding to a PFAM functional domain (Medium green: Adaptin, N terminal region; Dark green: Alpha adaptin, C-terminal domain; Light green: Beta2-adaptin appendage, C-terminal sub-domain; Dark pink/clear outline: Clathrin adaptor complex small chain; Light pink/dark outline: C-ter domain of the mu subunit); all five domains were detected in Asgard archaea, although not fused to each other. GARP: Golgi-associated retrograde protein complex. The GARP complex is a multisubunit tethering complex located at the trans-Golgi network where it functions to tether retrograde transport vesicles derived from endosomes36,123. GARP comprises four subunits, VPS51, VPS52, VPS53, and VPS54. ESCRT: Endosomal Sorting Complex Required for Transport system. This complex machinery performs a topologically unique membrane bending and scission reaction away from the cytoplasm. While numerous components of the ESCRT-I, II and III systems have been previously detected in Asgard archaea2,3,38, we here report Asgard homologs for several ESCRT-III regulators Vfa1, Vta1, Ist1, and Bro1. The bottom panel shows where these complexes mainly act in eukaryotic cells. Ub: Ubiquitin; Vps: vacuolar protein sorting. Subunit names in grey indicate that no homologs were detected in Asgard archaea. Domains newly identified as part of this study are indicated with an asterisk. Figure created using BioRender (https://www.biorender.com).
Supplementary information
Supplementary Information
This file contains Supplementary Methods, Supplementary Discussions 1–6, Supplementary References, Supplementary Figs. 1–32, Supplementary Tables 5–7 and Supplementary Data, which provide more details into phylogenomic analyses, Asgard taxonomy, ESP investigations and ancestral genome reconstruction of Asgard archaea. See table of content for details.
Supplementary Table 1
MAG-related metadata containing sampling site information, statistics related to Asgard archaea MAGs and taxonomy information.
Supplementary Table 2
Phylogenomic analysis information, such as the composition of each dataset in taxa and marker proteins and the statistical support for the monophyly of various clades obtained in during ML and Bayesian analyses.
Supplementary Table 3
List of candidates of potential ESPs.
Supplementary Table 4
Annotation and predicted copy number of protein families in selected Asgard ancestors.
Rights and permissions
Open Access This article is licensed under a Creative Commons Attribution 4.0 International License, which permits use, sharing, adaptation, distribution and reproduction in any medium or format, as long as you give appropriate credit to the original author(s) and the source, provide a link to the Creative Commons licence, and indicate if changes were made. The images or other third party material in this article are included in the article’s Creative Commons licence, unless indicated otherwise in a credit line to the material. If material is not included in the article’s Creative Commons licence and your intended use is not permitted by statutory regulation or exceeds the permitted use, you will need to obtain permission directly from the copyright holder. To view a copy of this licence, visit http://creativecommons.org/licenses/by/4.0/.
About this article

Cite this article
Eme, L., Tamarit, D., Caceres, E.F. et al. Inference and reconstruction of the heimdallarchaeial ancestry of eukaryotes. Nature 618, 992–999 (2023). https://doi.org/10.1038/s41586-023-06186-2
Received:
Accepted:
Published:
Issue Date:
DOI: https://doi.org/10.1038/s41586-023-06186-2
- Springer Nature Limited
This article is cited by
-
Metagenomic insights into Heimdallarchaeia clades from the deep-sea cold seep and hydrothermal vent
Environmental Microbiome (2024)
-
Viperin immunity evolved across the tree of life through serial innovations on a conserved scaffold
Nature Ecology & Evolution (2024)
-
Biosynthesis of GMGT lipids by a radical SAM enzyme associated with anaerobic archaea and oxygen-deficient environments
Nature Communications (2024)
-
RNA-guided RNA silencing by an Asgard archaeal Argonaute
Nature Communications (2024)
-
Expanded phylogeny of extremely halophilic archaea shows multiple independent adaptations to hypersaline environments
Nature Microbiology (2024)