
Abstract
Testosterone has complex effects on psychological traits and behavior; it is associated with social dominance and competition and is a potential human sex pheromone. This study aimed to investigate the associations between testosterone levels, aggressive behavior, and manic symptoms using a network analysis among bipolar disorder (BD) patients in psychiatric emergency departments (PED). Data from January 2021 and March 2022 BD patients in PED were analyzed. Manic symptoms were assessed using the Young Mania Rating Scale (YMRS). Aggression was assessed with subscale of the PANSS scale (PANSS-AG). The undirected network structures of testosterone levels, aggressive behavior, and manic symptoms were estimated, and centrality and bridge centrality indices were examined. Network stability was examined using the case-drop** procedure. The Network Comparison Test (NCT) was conducted to evaluate whether network characteristics differed by gender. We recruited a total of 898 BD patients, with the mean YMRS score as 13.30 ± 9.58. The prevalence of level II aggression was 35.6% (95%CI = 32.5%–38.7%), level III aggression was 29.5% (95%CI = 26.3%–32.6%), and level VI aggression was 7.0% (95%CI = 5.4%–8.8%). The male participants had a mean testosterone level of 391.71 (Standard Deviation (SD):223.39) compared to 36.90 (SD:30.50) for female participants in the whole sample. Through network analysis, “Increased motor activity-energy” emerged as the central symptom, with the highest centrality expected influence, followed by “Emotional Instability” and “Disruptive/aggression behavior”. Notably, “Emotional Instability” appeared to be the bridge symptom linking manic symptoms to aggressive behavior. Within the flow network model, “Speech rate and amount” exhibited the strongest positive correlation with testosterone levels, followed closely by “Disruptive/aggression behavior”. The constructed network model demonstrated robust stability, with gender showing no significant impact on the structure. In this study, “Increased motor activity-energy” stood out as the most influential symptom, and “Speech rate and amount” acted as the main bridge symptom linking testosterone levels, aggressive behavior, and manic symptoms. Targeting the central and bridge symptoms may improve the outcomes of aggression interventions implemented among BD patients in psychiatric emergency care.
Introduction
Bipolar disorder (BD) is a potentially lifelong condition characterized by extreme changes in mood with high incidences of hyperactivity, irritability, grandiosity, poor judgment, and other symptoms, all of which are highly likely to lead to aggressive behavior [1]. Impulsive aggression is common amongst BD patients. Notably, aggressive behavior in BD patients show a direct prognostic value, which links to suicidal behaviors, more frequent hospitalizations, higher severity of mania symptoms, mixed symptoms, and comorbid borderline personality disorder [2]. A characteristic of BD emerges as hindrance towards an individual’s ability to perceive risk and protect themselves, which make them vulnerable to physical assault [3]. Given the risk of hurting others and self-harm, patients with BD have profound effects on society and family numbers.
The etiology of BD is unknown; however, factors such as genetics, biological traits, and environment have been proposed for consideration in the pathogenesis of BD [4]. For patients with BD who are experiencing disease episode, emergency departments or psychiatric emergency department (PED) are often their preferred choice for medical treatment. The highest prevalence of aggressive behavior occur in acute care settings (12.5–61.8%) [5, Full size image
Node-specific predictive betweenness measure
Researchers have found that “Testosterone” plays an important role in aggressive behavior in previous studies [22]. Figure 4 shows the node-specific predictive betweenness values for each node in the network. The white dots represent the node-specific predictive betweenness in the study sample, while the black lines represent the variability of the measure across 1000 nonparametric bootstrap iterations. YMRS6 (“Speech–rate and amount”) has the highest node-specific predictive betweenness score, followed by YMRS5 (“Irritability”). This finding suggests that “Speech–rate and amount” and “Irritability” may be the main bridge symptoms between testosterone levels, manic symptoms, and aggression (Fig. 4).
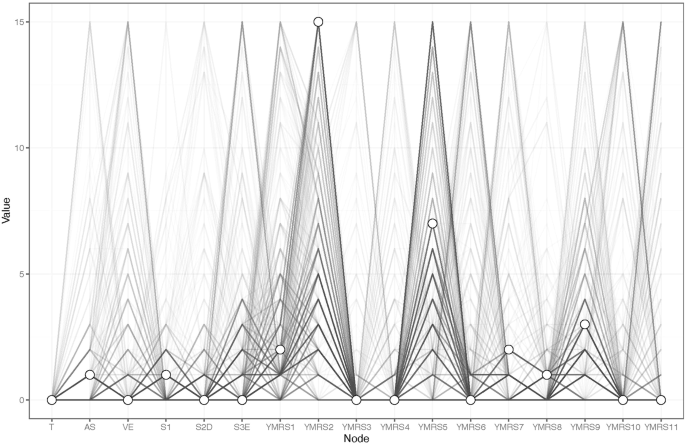
Node-specific predictive betweenness.
Network comparison tests by gender
The comparison of the network model by gender did not reveal significant differences in network global strength (network strength: 11.37 in female participants; 11.40 male participants; M = 0.214, P = 0.571) and edge weights (S = 0.026, P = 0.969, Supplementary Figs. S1–S4).
