
Abstract
Mental health problems are common in college students even in the late stage of the coronavirus disease 2019 (COVID-19) outbreak. Network analysis is a novel approach to explore interactions of mental disorders at the symptom level. The aim of this study was to elucidate characteristics of depressive and anxiety symptoms network in college students in the late stage of the COVID-19 outbreak. A total of 3062 college students were included. The seven-item Generalized Anxiety Disorder Scale (GAD-7) and nine-item Patient Health Questionnaire (PHQ-9) were used to measure anxiety and depressive symptoms, respectively. Central symptoms and bridge symptoms were identified based on centrality and bridge centrality indices, respectively. Network stability was examined using the case-drop** procedure. The strongest direct relation was between anxiety symptoms “Nervousness” and “Uncontrollable worry”. “Fatigue” has the highest node strength in the anxiety and depression network, followed by “Excessive worry”, “Trouble relaxing”, and “Uncontrollable worry”. “Motor” showed the highest bridge strength, followed by “Feeling afraid” and “Restlessness”. The whole network was robust in both stability and accuracy tests. Central symptoms “Fatigue”, “Excessive worry”, “Trouble relaxing” and “Uncontrollable worry”, and critical bridge symptoms “Motor”, “Feeling afraid” and “Restlessness” were highlighted in this study. Targeting interventions to these symptoms may be important to effectively alleviate the overall level of anxiety and depressive symptoms in college students.
Introduction
Depressive and anxiety symptoms (depression and anxiety hereafter) are common mental health problems, which are increasing globally in the past decade [1]. The presence of either depression or anxiety often increases the risk of having the other. For instance, a meta-analysis revealed that depression and anxiety are bidirectional risk factors for one another [2]. In addition, depression and anxiety often occur concurrently, such as in a study on UK college students, 29.8% of females and 13.9% of males screened positive for both anxiety and depression [3].
The coronavirus disease 2019 (COVID-19) outbreak that started in early 2020 have resulted in an increase in common depression and anxiety across many populations [4,5,6]. After the COVID-19 outbreak was largely controlled in some countries such as China, studies found that the large scale public health measures (e.g., quarantine, self-isolation, and business and school closures) resulted in long-term stress and psychological distress in many populations [19].
Researchers have explored characteristics of the anxiety and depression network in various populations. For example, “fatigue” was identified as the central and bridge symptom in migrant Filipino domestic workers, which may increase the risk of comorbidity between anxiety and depression [33]. The CS-C means the maximum cases that could be dropped from the sample, in which the centrality indices from the subsamples are correlated with the indices from the original sample at a value of r = 0.7 [33]. Generally, the value of CS-C needs to be above 0.25 and is preferably above 0.5 [33]. A nonparametric bootstrap procedure was used to assess the edge weights stability based on the 95% confidence intervals (95% CIs). Edge accuracy was assessed by 95% CIs, with a narrower CI indicating a more trustworthy network [33, 39]. Additionally, to evaluate the differences between two edges or between two nodes strength, bootstrapped tests were conducted based on 95% CIs, which indicated that there were statistical differences between two edges or two nodes strength if zero was not included in the CIs [33]. All analyses in network stability were performed by the R package bootnet (Version 1.4.3) [33].
Network comparison
The Network Comparison Test (NCT) in the R-package NetworkComparisonTest (Version 2.2.1) was used to examine the three invariance measures (i.e., network structure invariance, edge invariance, and global strength) [40]. Network structure means the maximum difference of pairwise edges between two networks, edge invariance indicates the difference of individual edge weight between two networks, and global strength refers to the sum of all edges of each network. Holm-Bonferroni correction for multiple comparisons at the level of individual edge between two networks was adopted. Considering the moderating effect of gender [41], academic major [42] and living area [42, 43] on anxiety and depression among college students, network structure invariance, edge invariance, and global strength were compared between different subgroups (e.g., between females and males, between health-related major and others, and between rural and urban residents) based on a permutation test (n = 1000) [40].
Results
Descriptive statistics
Out of the 3075 college students invited to participate, 3,062 agreed and completed the assessment, giving a response rate of 99.58%. Of the 3,062 college students included in this network, the mean age was 19.8 (standard deviation (SD) = 2.0) years, 2,068 (67.5%) were females, 1563 (51.0%) were rural residents, and 1722 (56.2%) majored in health-related subjects (Table S1). The mean PHQ-9 and GAD-7 rating score was 0.21 and 0.80, respectively (Table 1), and the distributions of the responses to PHQ-9/GAD-7 items are shown in Table S2.
Network structure
The network of anxiety and depressive symptoms is shown in Fig. 1 and the corresponding partial correlation matric is presented in Table S3. The edge Nervousness-Uncontrollable worry (GAD1-GAD2) shows the strongest association, followed by the edge Uncontrollable worry-Excessive worry (GAD2-GAD3), Excessive worry-Trouble relaxing (GAD3-GAD4), Restless-Feeling afraid (GAD5-GAD7), Sleep-Fatigue (PHQ3-PHQ4), Motor-Suicide (PHQ8-PHQ9), Anhedonia-Sad Mood (PHQ1-PHQ2), and Concentration-Motor (PHQ7-PHQ8).
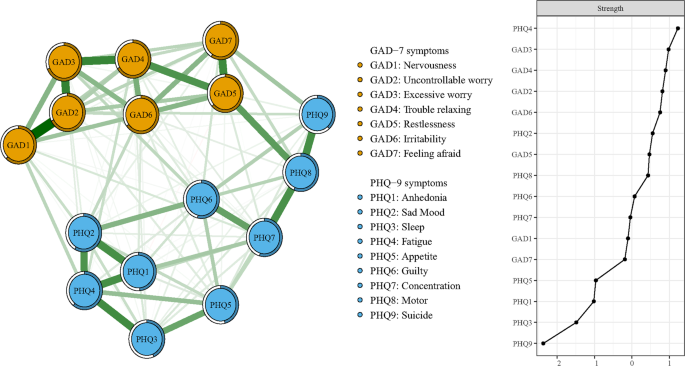
The left panel shows the visualization of the network structure; the right panel shows the value of strength in order.
In Table 1 and Fig. 1, Fatigue (PHQ4) has the highest node strength in the anxiety and depression network among college students, followed by Excessive worry (GAD3), Trouble relaxing (GAD4), and Uncontrollable worry (GAD2). The item Excessive worry (GAD3) had the highest predictability in the network (Table 1) and an average of 56.3% of variance could be potentially accounted for by each node’s surrounding nodes (Mpredictability = 0.563 ± 0.091). In terms of bridge symptoms, Motor (PHQ8) showed the highest bridge strength, followed by Feeling afraid (GAD7) and Restlessness (GAD5) (Fig. 2).
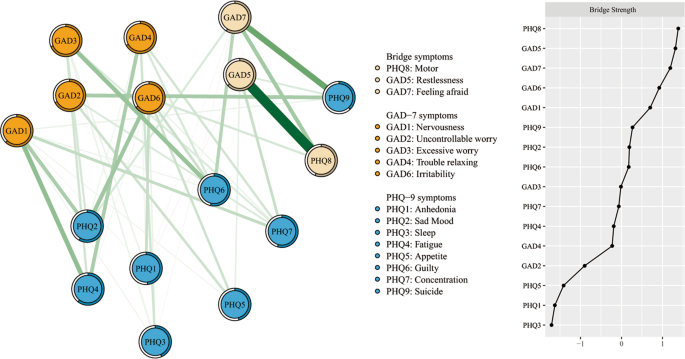
The left panel shows the visualization of the network structure of bridging symptoms; the right panel shows the value of bridge strength in order.
Network stability
In Fig. 3, the case-drop** bootstrap procedure shows that both CS-Cs of node strength and bridge strength were 0.75, which indicates that 75% of samples could be dropped, but the findings were still similar to the primary results (r = 0.7). The results of nonparametric bootstrap procedure show that most comparisons among edge weights and node strength were statistically significant (Figs. S1, S2). Additionally, bootstrapped 95% CIs were narrow, representing edges were trustworthy (Fig. S3).
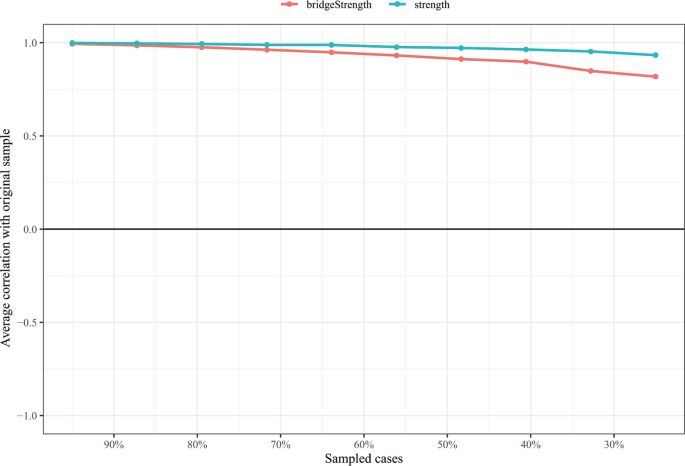
The x-axis indicates the percentage of cases of the original sample included at each step. The y-axis indicates the average of correlations between the centrality indices from the original network and the centrality indices from the networks that were re-estimated after excluding increasing percentages of cases.
Network comparisons
As shown in Fig. S4, there was significant difference in network global strength (Urban: 7.655 vs Rural: 7.469, S = 0.186, p = 0.044) between rural and urban college students. In other two subsample comparisons, no significant differences were found in network global strength (Health-related major: 7.456 vs Other majors: 7.431, S = 0.025, p = 0.703; Females: 7.461 vs Males: 7.496, S = 0.035, p = 0.613). In terms of network structure and individual edge weight comparisons, there were also no significant differences between two networks in the three subsample comparisons.
Discussion
To the best of our knowledge, this was the first study that characterized the depressive and anxiety network in Chinese college students during the late stage of the COVID-19 outbreak. All the strongest edges were within the respective disorder, while none of the strongest edges linked anxiety and depressive symptoms, which are consistent with previous findings identified in network analysis of depression and anxiety [15, 15]. In this study, we found that certain anxiety symptoms, including “Excessive worry” (GAD3), “Trouble relaxing” (GAD4), and “Uncontrollable worry” (GAD2), also had high values of node strength, indicating these symptoms may also play important role in activating and maintaining the depression and anxiety network. This could be partly explained by the fear of contagion when students are faced with this novel and potentially fatal infectious disease, which can increase such anxiety symptoms [44]. Specific interventions could be adopted, such as cognitive behavioral therapy (CBT), applied relaxation and medications, the latter being considered for those with severe symptoms.
In this depression and anxiety network, the most influential bridge symptom was the depressive symptom of “Motor” (PHQ8), which is similar to that in a previous study in Chinese adults, where “Motor” (PHQ8) showed a high bridge centrality both during the COVID-19 peak and post-peak outbreak period [49]. In another study, the symptom of “Motor” was identified as the crucial priority due to its relation to “thought of death” in female nursing students [15], suggesting that this symptom should be a target of interventions to reduce depression and anxiety. Other influential bridge symptoms included the anxiety symptoms of “Feeling afraid” (GAD7) and “Restlessness” (GAD5), suggesting that these symptoms should also be targeted in treatment.
The predictability of each node in the network of depression and anxiety was calculated. There were no associations between predictability and mean values of each node (rs = −0.056, p = 0.837), suggesting that certain symptoms might have a high value of predictability in the depressive and anxiety network, although these symptoms appeared less frequently [39]. On average, 56.3% of the node variance could be explained by neighboring nodes, implying that the potential sources of the remaining variance (e.g., stress and insomnia symptoms) were not included by both the PHQ-9 and GAD-7. Previous studies found that certain factors, such as gender, living area (urban/rural), and study major, were associated with depression and anxiety at the disorder level [41,42,43]. In this study, network comparison test found that compared to those from rural areas, students from urban areas had a significantly higher global strength of the network, indicating that individual symptoms in the model of urban college students were strongly inter-connected. This finding was not found in the relevant studies using network analysis and should be explored in future studies. In other comparisons (such as health-related major vs. other majors, and female vs male), no significant differences were found.
The strength of this study included the large sample size and use of the network approach to visualize depressive and anxiety symptom patterns in college students, with stable results. However, several limitations should be noted. First, the cross-sectional data collected by snowball sampling method were used to construct depressive and anxiety symptoms network structure, which could not identify the causality between individual symptoms and had limited representativeness. Therefore, the findings should be confirmed in future longitudinal studies. Second, self-reported measures were used to assess depressive and anxiety symptoms, which may have recall bias and are limited to capture clinical phenomena [15]. Third, for logistical reasons, depressive and anxiety network prior to and in the early stage of the COVID-19 pandemic were not assessed. Hence, the psychological impact of the pandemic could not be evaluated. Finally, some relevant symptoms, such as post-traumatic stress and certain somatic symptoms, were not measured, which could partly explain the relatively low predictability in the network.
In conclusion, centrality symptoms (i.e., “Fatigue”, “Excessive worry”, “Trouble relaxing” and “Uncontrollable worry”) and bridge symptoms (i.e., “Motor”, “Feeling afraid” and “Restlessness”) were identified in this network of depressive and anxiety symptoms in Chinese college students. Monitoring college students’ mental health in the late stage of the COVID-19 outbreak and targeting interventions (e.g., CBT, applied relaxation and medications) for selective symptoms are important to alleviate the overall level of anxiety and depression in this population.
References
Qin X, Wang S, Hsieh C-R. The prevalence of depression and depressive symptoms among adults in China: Estimation based on a National Household Survey. China Economic Rev. 2018;51:271–82. https://doi.org/10.1016/j.chieco.2016.04.001
Jacobson NC, Newman MG. Anxiety and depression as bidirectional risk factors for one another: A meta-analysis of longitudinal studies. Psychol Bull. 2017;143:1155–1200. https://doi.org/10.1037/bul0000111
Jenkins PE, Ducker I, Gooding R, James M, Rutter-Eley E. Anxiety and depression in a sample of UK college students: a study of prevalence, comorbidity, and quality of life. J Am Coll Health. 2020;1–7, https://doi.org/10.1080/07448481.2019.1709474.
Zhao YJ, ** Y, Rao WW, Li W, Zhao N, Cheung T, et al. The prevalence of psychiatric comorbidities during the SARS and COVID-19 epidemics: a systematic review and meta-analysis of observational studies. J Affect Disord. 2021;287:145–57. https://doi.org/10.1016/j.jad.2021.03.016
Kılınçel Ş, Kılınçel O, Muratdağı G, Aydın A, Usta MB. Factors affecting the anxiety levels of adolescents in home-quarantine during COVID-19 pandemic in Turkey. Asia Pac Psychiatry. 2021;13:e12406 https://doi.org/10.1111/appy.12406
Venugopal VC, Mohan A, Chennabasappa LK. Status of mental health and its associated factors among the general populace of India during COVID-19 pandemic. Asia Pac Psychiatry. 2020;e12412, https://doi.org/10.1111/appy.12412.
Gu Y, Zhu Y, Xu F, ** J, Xu G. Factors associated with mental health outcomes among patients with COVID-19 treated in the Fangcang shelter hospital in China. Asia Pac Psychiatry. 2021;13:e12443 https://doi.org/10.1111/appy.12443
Pan X, **ao Y, Ren D, Xu ZM, Zhang Q, Yang LY, et al. Prevalence of mental health problems and associated risk factors among military healthcare workers in specialized COVID-19 hospitals in Wuhan, China: a cross-sectional survey. Asia Pac Psychiatry. 2020;e12427, https://doi.org/10.1111/appy.12427.
Bao Y, Sun Y, Meng S, Shi J, Lu L. 2019-nCoV epidemic: address mental health care to empower society. Lancet. 2020;395:e37–e38. https://doi.org/10.1016/s0140-6736(20)30309-3
Auerbach RP, Mortier P, Bruffaerts R, Alonso J, Benjet C, Cuijpers P, et al. WHO World Mental Health Surveys International College Student Project: Prevalence and distribution of mental disorders. J Abnorm Psychol. 2018;127:623–38. https://doi.org/10.1037/abn0000362
Yu M, Tian F, Cui Q, Wu H. Prevalence and its associated factors of depressive symptoms among Chinese college students during the COVID-19 pandemic. BMC Psychiatry. 2021;21:66 https://doi.org/10.1186/s12888-021-03066-9
Li Y, Zhao J, Ma Z, McReynolds LS, Lin D, Chen Z, et al. Mental health among college students during the COVID-19 pandemic in China: a 2-Wave Longitudinal Survey. J Affect Disord. 2021;281:597–604. https://doi.org/10.1016/j.jad.2020.11.109
Borsboom D. A network theory of mental disorders. World Psychiatry. 2017;16:5–13. https://doi.org/10.1002/wps.20375
Hofmann SG, Curtiss J, McNally RJ. A complex network perspective on clinical science. Perspect Psychol Sci. 2016;11:597–605. https://doi.org/10.1177/1745691616639283
Ren L, Wang Y, Wu L, Wei Z, Cui LB, Wei X, et al. Network structure of depression and anxiety symptoms in Chinese female nursing students. BMC Psychiatry. 2021;21:279 https://doi.org/10.1186/s12888-021-03276-1
Epskamp S, CramerAOJ, Waldorp LJ, Schmittmann VD, Borsboom D. qgraph: network visualizations of relationships in psychometric data. J Statistical Softw. 2012;48:1.
Contreras A, Nieto I, Valiente C, Espinosa R, Vazquez C. The study of psychopathology from the network analysis perspective: a systematic review. Psychother Psychosom. 2019;88:71–83. https://doi.org/10.1159/000497425
Haslbeck JMB, Fried EI. How predictable are symptoms in psychopathological networks? A reanalysis of 18 published datasets. Psychol Med. 2017;47:2767–76. https://doi.org/10.1017/s0033291717001258
Jones PJ, Ma R, McNally RJ. Bridge centrality: a network approach to understanding comorbidity. Multivariate Behavior Res 2019;1–15, https://doi.org/10.1080/00273171.2019.1614898.
Garabiles MR, Lao CK, **ong Y, Hall BJ. Exploring comorbidity between anxiety and depression among migrant Filipino domestic workers: a network approach. J Affect Disord. 2019;250:85–93. https://doi.org/10.1016/j.jad.2019.02.062
Beard C, Millner AJ, Forgeard MJC, Fried EI, Hsu KJ, Treadway MT, et al. Network analysis of depression and anxiety symptom relationships in a psychiatric sample. Psychological Med. 2016;46:3359–69. https://doi.org/10.1017/S0033291716002300
Compton WM, Conway KP, Stinson FS, Grant BF. Changes in the prevalence of major depression and comorbid substance use disorders in the United States between 1991-1992 and 2001-2002. Am J Psychiatry. 2006;163:2141–7. https://doi.org/10.1176/ajp.2006.163.12.2141
Kleinman A. Culture and depression. N Engl J Med. 2004;351:951–3. https://doi.org/10.1056/NEJMp048078
Bai W, Cai H, Liu S, Liu H, Qi H, Chen X, et al. Attitudes toward COVID-19 vaccines in Chinese college students. Int J Biol Sci. 2021;17:1469–75. https://doi.org/10.7150/ijbs.58835
Kroenke K, Spitzer RL, Williams JB. The PHQ-9: validity of a brief depression severity measure. J Gen Intern Med. 2001;16:606–13. https://doi.org/10.1046/j.1525-1497.2001.016009606.x
Wang W, Bian Q, Zhao Y, Li X, Wang W, Du J, et al. Reliability and validity of the Chinese version of the Patient Health Questionnaire (PHQ-9) in the general population. Gen Hospital Psychiatry. 2014;36:539–44. https://doi.org/10.1016/j.genhosppsych.2014.05.021
Spitzer RL, Kroenke K, Williams JB, Löwe B. A brief measure for assessing generalized anxiety disorder: the GAD-7. Arch Intern Med. 2006;166:1092–7. https://doi.org/10.1001/archinte.166.10.1092
He XY, Li CB, Qian J, Cui HS, Wu WY. Reliability and validity of a generalized anxiety disorder scale in general hospital outpatients (in Chinese). Shanghai Arch Psychiatry. 2010;22:200–203.
R Core Team. R: A language and environment for statistical computing. 2020; https://www.R-project.org/.
Tibshirani R. Regression shrinkage and selection via the lasso. J R Stat Soc: Ser B (Methodol). 1996;58:267–88.
Haslbeck JMB, Waldorp LJ. How well do network models predict observations? On the importance of predictability in network models. Behav Res Methods. 2018;50:853–61. https://doi.org/10.3758/s13428-017-0910-x
Liu H, Han F, Yuan M, Lafferty J, Wasserman L. High-dimensional semiparametric Gaussian copula graphical models. Ann Stat. 2012;40:2293–326. 2234
Epskamp S, Borsboom D, Fried EI. Estimating psychological networks and their accuracy: a tutorial paper. Behav Res methods. 2018;50:195–212. https://doi.org/10.3758/s13428-017-0862-1
Opsahl T, Agneessens F, Skvoretz J. Node centrality in weighted networks: generalizing degree and shortest paths. Soc Netw. 2010;32:245–51. https://doi.org/10.1016/j.socnet.2010.03.006
Bringmann LF, Elmer T, Epskamp S, Krause RW, Schoch D, Wichers M, et al. What do centrality measures measure in psychological networks? J Abnorm Psychol. 2019;128:892–903. https://doi.org/10.1037/abn0000446
Epskamp S, Rhemtulla M, Borsboom D. Generalized network psychometrics: combining network and latent variable models. Psychometrika. 2017;82:904–27. https://doi.org/10.1007/s11336-017-9557-x
Haslbeck JMB, Waldorp LJ. mgm: estimating time-varying mixed graphical models in high-dimensional data. J Statistical Softw. 2020;93:1–46.
Payton J. Tools for identifying important nodes in networks. https://cran.r-project.org/web/packages/networktools/index.html.
Marchetti I. Hopelessness: a network analysis. Cogn Ther Res. 2019;43:611–9. https://doi.org/10.1007/s10608-018-9981-y
van Borkulo CD, Boschloo L, Kossakowski JJ, Tio P, Schoevers RA, Borsboom D, et al. Comparing network structures on three aspects: apermutation test. 2017; https://doi.org/10.13140/RG.2.2.29455.38569.
Gao W, ** S, Liu X. Gender differences in depression, anxiety, and stress among college students: A longitudinal study from China. J Affect Disord. 2020;263:292–300. https://doi.org/10.1016/j.jad.2019.11.121
Chang J, Yuan Y, Wang D. [Mental health status and its influencing factors among college students during the epidemic of COVID-19]. Nan fang yi ke da xue xue bao = J Southern Med Univ. 2020;40:171–6. https://doi.org/10.12122/j.issn.1673-4254.2020.02.06.
Liu Y, Yue S, Hu X, Zhu J, Wu Z, Wang J, et al. Associations between feelings/behaviors during COVID-19 pandemic lockdown and depression/anxiety after lockdown in a sample of Chinese children and adolescents. J Affect Disord. 2021;284:98–103. https://doi.org/10.1016/j.jad.2021.02.001
Yang C, Chen A, Chen Y. College students’ stress and health in the COVID-19 pandemic: The role of academic workload, separation from school, and fears of contagion. PLoS ONE. 2021;16:e0246676 https://doi.org/10.1371/journal.pone.0246676
Hasan N, Bao Y. Impact of “e-Learning crack-up” perception on psychological distress among college students during COVID-19 pandemic: a mediating role of “fear of academic year loss”. Child Youth Serv Rev. 2020;118:105355–105355. https://doi.org/10.1016/j.childyouth.2020.105355
Liu S, ** HT, Zhu QQ, Ji M, Zhang H, Yang BX, et al. The prevalence of fatigue among Chinese nursing students in post-COVID-19 era. PeerJ. 2021;9:e11154 https://doi.org/10.7717/peerj.11154
Benham G. Stress and sleep in college students prior to and during the COVID-19 pandemic. Stress Health. 2020; https://doi.org/10.1002/smi.3016.
Park SC, Kim D. The centrality of depression and anxiety symptoms in major depressive disorder determined using a network analysis. J Affect Disord. 2020;271:19–26. https://doi.org/10.1016/j.jad.2020.03.078
Wang Y, Hu Z, Feng Y, Wilson A, Chen R. Changes in network centrality of psychopathology symptoms between the COVID-19 outbreak and after peak. Mol Psychiatry. 2020;25:3140–9. https://doi.org/10.1038/s41380-020-00881-6
Acknowledgements
The study was supported by the National Science and Technology Major Project for investigational new drug (2018ZX09201-014), the Bei**g Municipal Science & Technology Commission (No. Z181100001518005), the University of Macau (MYRG2019-00066-FHS), and Bei**g Municipal Administration of Hospitals Incubating Program (PX2018063).
Author contributions
Study design: WB, SS, YTX. Data collection, analysis and interpretation: WB, HC, XC, SL, SS. Drafting of the manuscript: WB, SS, YTX. Critical revision of the manuscript: TC, JL, XC, CHN, YTX. Approval of the final version for publication: all co-authors.
Author information
Authors and Affiliations
Corresponding author
Ethics declarations
Competing interests
The authors declare no competing interests.
Additional information
Publisher’s note Springer Nature remains neutral with regard to jurisdictional claims in published maps and institutional affiliations.
Supplementary information
Rights and permissions
Open Access This article is licensed under a Creative Commons Attribution 4.0 International License, which permits use, sharing, adaptation, distribution and reproduction in any medium or format, as long as you give appropriate credit to the original author(s) and the source, provide a link to the Creative Commons license, and indicate if changes were made. The images or other third party material in this article are included in the article’s Creative Commons license, unless indicated otherwise in a credit line to the material. If material is not included in the article’s Creative Commons license and your intended use is not permitted by statutory regulation or exceeds the permitted use, you will need to obtain permission directly from the copyright holder. To view a copy of this license, visit http://creativecommons.org/licenses/by/4.0/.
About this article

Cite this article
Bai, W., Cai, H., Liu, S. et al. Anxiety and depressive symptoms in college students during the late stage of the COVID-19 outbreak: a network approach. Transl Psychiatry 11, 638 (2021). https://doi.org/10.1038/s41398-021-01738-4
Received:
Revised:
Accepted:
Published:
DOI: https://doi.org/10.1038/s41398-021-01738-4
- Springer Nature Limited
This article is cited by
-
Temporal network of experience sampling methodology identifies sleep disturbance as a central symptom in generalized anxiety disorder
BMC Psychiatry (2024)
-
A network model of depressive and anxiety symptoms: a statistical evaluation
Molecular Psychiatry (2024)
-
Network analysis of comorbid depression and anxiety and their associations with response style among adolescents with subthreshold depression
Current Psychology (2024)
-
Changes in Mental Health and EEG Biomarkers of Undergraduates Under Different Patterns of Mindfulness
Brain Topography (2024)
-
Anxiety and Depression Symptoms among Youth Survivors of Childhood Sexual Abuse: A Network Analysis
BMC Psychology (2023)