
Abstract
Electronic Health Records (EHRs) are digital records associated with hospitalization, diagnosis, medications and so on. Secondary use of EHRs can promote the clinical informatics applications and the development of healthcare undertaking. EHRs have the unique characteristic where the patient visits are temporally ordered but the diagnosis codes within a visit are randomly ordered. The hierarchical structure requires a multi-layer network to explore the different relational information of EHRs. In this paper, we propose a Multi-Layer Representation Learning method (MLRL), which is capable of learning effective patient representation by hierarchically exploring the valuable information in both diagnosis codes and patient visits. Firstly, MLRL utilizes the multi-head attention mechanism to explore the potential connections in diagnosis codes, and a linear transformation is implemented to further map the code vectors to non-negative real-valued representations. The initial visit vectors are then obtained by summarizing all the code representations. Secondly, the proposed method combines Bidirectional Long Short-Term Memory with self-attention mechanism to learn the weighted visit vectors which are aggregated to form the patient representation. Finally, to evaluate the performance of MLRL, we apply it to patient’s mortality prediction on real EHRs and the experimental results demonstrate that MLRL has a significant improvement in prediction performance. MLRL achieves around 0.915 in Area Under Curve which is superior to the results obtained by baseline methods. Furthermore, compared with raw data and other data representations, the learned representation with MLRL shows its outstanding results and availability on multiple different classifiers.
1 Introduction
Electronic Health Records (EHRs) systems accumulate massive and a wide range of medical data concerning different aspects of healthcare. The explosive growth of EHRs in recent years provides researchers the opportunities of accessing to the valuable medical information which plays a significant role in describing patient’s condition, predicting patient’s mortality and future morbidity, etc. At present, utilizing existing medical big data to provide better and personalized medical services is the promising trend in the development of healthcare industry. Nevertheless, due to the temporality, high-dimensionality, irregularity and complexity of EHRs, the researches on EHRs are challenging.
Representation learning, which is regarded as a key step before any further applications, provides opportunities for researches on EHRs. Representation learning aims to represent the semantic information of the research objects as dense low-dimensional real-valued vectors with the technology of machine learning [15, 21, 37], representation learning which is based on these techniques also has attracted great attention since the learned vectors are able to capture the implicit regularities and patterns [38].
Recurrent Neural Networks (RNNs) are deep learning models designed to handle time series data [12]. Although traditional RNNs are not good at capturing long-term dependencies of data, many variants are effective in addressing this issue [27]. Long Short-Term Memory (LSTM) [14] is not only capable of processing lengthy temporal data more effectively, but also can overcome the issue of vanishing gradient [18] with a gating mechanism. Meanwhile, attention mechanism is an effective method, and its development renders the outputs of models more interpretable. Recently, they have often been combined with deep learning methods and successfully applied to multiple fields [22, 33, 35, 40].
EHRs data for each patient consists of a sequence of patient visits, where each visit contains a subset of diagnosis codes. However, a sequence of patient visits possess sequential relationship among them which can’t be captured by simply aggregating code vectors. So the effective representations need to be derived from the hierarchical learning of diagnosis codes and patient visits. In this paper, we propose a Multi-Layer Representation Learning method (MLRL) for patient’s EHRs. MLRL is implemented from two aspects: (1) Diagnosis code-level representation. We use the multi-head attention mechanism to explore the potential interactions and associations of the diagnosis codes. Then, the non-negative real-valued code representations are obtained by the linear transformation; (2) Visit-level representation. This part utilizes Bidirectional Long Short-Term Memory (BiLSTM) to explore the temporal relationships among various patient visits. Furthermore, because the patient visits are unlikely to contribute equally to the prediction of the target outcome, we combine the self-attention mechanism to learn the weighted visit vectors which are aggregated to form the patient representation.
Main contributions of this paper are as follows:
-
1.
We propose a multi-layer representation learning method called MLRL to learn more efficient and robust patient representation based on raw EHRs data. MLRL utilizes a multi-level structure to explore the different relational information provided by EHRs hierarchical characteristic, namely diagnosis code-level and visit-level information.
-
2.
We evaluate MLRL on real EHRs dataset and conduct the experiments of patient’s mortality prediction. Experimental results demonstrate the superior prediction performance achieved by MLRL. MLRL achieves around 0.915 in Area Under Curve (AUC) while baselines are in the range of 0.8–0.9.
-
3.
We apply the learned data representation to various classifiers for prediction tasks. The experimental results with the representation learned by MLRL consistently and significantly outperform those achieved with representations based on raw data and baseline methods.
The rest of the paper is arranged as follows: In Sect. 2, we review the related work, including EHRs researches and the applications of representation learning in the medical field. Section 3 analyzes the overall architecture of the proposed method, and describes the relevant theory and processing details. Section 4 conducts the experiments based on the real EHRs, and the experimental results are analyzed and discussed in detail. Finally, Sect. 5 concludes the study and points out the future work.
2 Related Work
2.1 EHRs
Mining EHRs is a hot research topic in healthcare informatics, and massive amount of EHRs data motivates researchers to extract valuable clinical information for advanced analysis [31]. In recent years, EHRs data with different structure types, such as clinical text records and structured medical concepts, has been increasingly applied to multiple medical researches.
According to the research objectives and applications, we classify the research contents of EHRs into three types: (1) Disease risk level prediction and classification. Li et al.[19] proposed a stacked sparse auto-encoder (SSAE) based feature encoding algorithm. The proposed SSAE can effectively train on a small-scale data and learn the significant feature representation for PD diagnosis. Razavian et al. [7] was also not learned code representations by utilizing the code characteristics. Ashfaq et al. [2] leveraged the Paragraph Vector for Distributed Bag of Words (PV-DBOW) to generate simple numerical vectors of codes. Nevertheless, their process of obtaining representations did not consider the importance of the codes in current visit, that is the code weight. Besides, the patient’s multiple visit sequences also plays an important and different role in the target outcome prediction. Wang et al. [34] proposed a representation learning model for patient medical records. They aimed to capture the co-occurrence information and long-term dependence between clinical events, but ignored the visit sequentiality and the differences in the contribution of patient visits to the prediction task. Miotto et al. [25] proposed an unsupervised method, called DeepPatient, which generated patient representation from the original clinical information via a stack of denoising autoencoders (SDA). In their research, the classified diagnosis codes were used as training labels to evaluate the predictive results of diseases. However, in the vector learning process of patient EHRs, they did not consider the sequentiality and temporality of patient visits.
In our research, the proposed method is based on EHRs concept representation [30] and the idea of multi-layer structure is introduced to our proposed method, which aims to learn the patient representation by taking into account the different relational information existing in diagnosis codes and patient visits.
3 Multi-layer Representation Learning Method
In this section, we first present an overview of MLRL and then we describe the components of our proposed method in detail.

The structure of MLRL
3.1 Overview of MLRL
MLRL consists of the following parts: diagnosis code-level representation layer, visit-level representation layer and prediction layer.
As shown in Fig. 1, in the diagnosis code-level representation layer, we first embed the discrete diagnosis codes to the vectors by an embedding matrix. Then, the initial code representations are obtained by utilizing the multi-head attention mechanism to explore the potential connections existing in codes. Finally, the linear transformation and rectified linear unit (ReLU) activation function are introduced into the layer to map every code to the non-negative real-valued representation. The method of combining BiLSTM with self-attention mechanism is implemented to the visit-level representation layer. Based on the initial visit vectors which are aggregated by the learned code representations, the patient representation is obtained by the weighted sum of the learned visit vectors. The last layer is a fully connected layer with softmax classifier for patient’s mortality prediction.

The visits for a patient
Multi-head attention mechanism
3.2 Diagnosis Code-Level Representation
Assume that there are N patients, each patient has T visits and each visit contains M diagnosis codes. The visits for a patient is illustrated in Fig. 2. \(c_{n}^{t m}\) represents the diagnosis code numbered m that occurred in the tth visit of the nth patient.
There is valuable and implicit interrelated information in the disordered diagnosis codes within each visit, and the specific method is required to explore the connections and learn the vector representations.
Given the tth visit of the nth patient \(s_{n}^{t}=\left\{ c_{n}^{t 1}, \ldots , c_{n}^{t m}, \ldots , c_{n}^{t M}\right\} \), \(n \in [1, N]\), \(t \in [1, T]\), \(m \in [1, M]\), the diagnosis codes is embedded to the vectors with an embedding matrix.
where \(s_{n}^{t^{\prime }}=\left\{ e_{n}^{t 1}, \ldots , e_{n}^{t m}, \ldots , e_{n}^{t M}\right\} \).
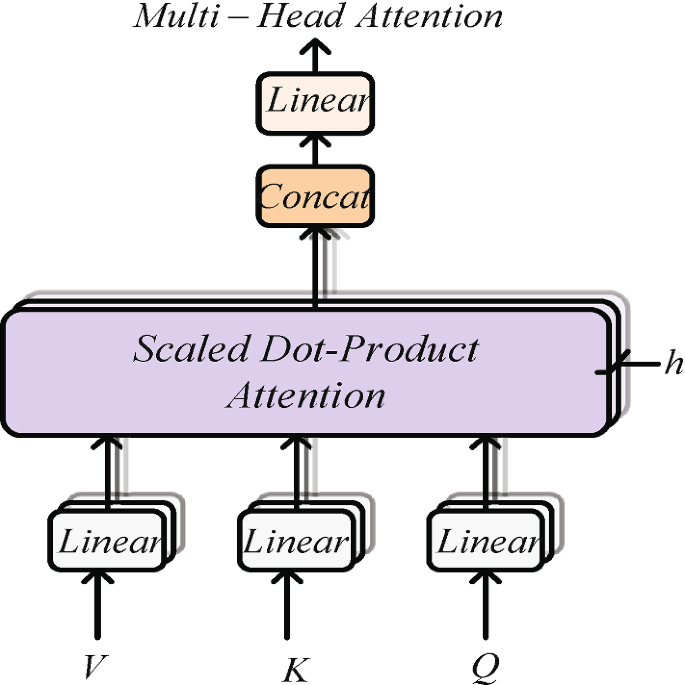
Then, the multi-head attention mechanism [32] is used to learn the initial code representations. Every head in the attention mechanism represents an attention layer, i.e. Scaled Dot-Product Attention. The attention function is defined in Eq. 2.
where Q, K and V are matrices representing queries, keys and values in the attention mechanism respectively; \(W_{Q}\), \(W_{K}\) and \(W_{V}\) are trainable parameter matrices.
Multi-head attention mechanism in Fig. 3 executes the attention function in parallel to produce the different output values which are then concatenated and linearly converted, yielding the final outputs \(u_{n}^{t}=\left\{ u_{n}^{t 1}, \ldots , u_{n}^{t m}, \ldots , u_{n}^{t M}\right\} \).
where h represents the parallel attention layers, or heads. \(W_{O}\) is a parameter matrice.
Finally, the non-negative real-valued code representations \(z_{n}^{t}=\left\{ z_{n}^{t 1}, \ldots , z_{n}^{t m}, \ldots , z_{n}^{t M}\right\} \) are obtained by the following formula.
where \(W_{z}\) and \(b_{z}\) are trainable parameter vectors of the linear transformation.
In order to obtain the initial visit vectors, the representations of diagnosis codes included in each visit are aggregated as follows.
Therefore, we can obtain a sequence of visit vectors for a patient \(v_{n}=\left\{ v_{n}^{1}, v_{n}^{2}, \ldots , v_{n}^{t}, \ldots , v_{n}^{T}\right\} \).
3.3 Visit-Level Representation
We describe the details of visit representations in the following. Because the visits of patients are temporally ordered and interrelated, BiLSTM, which is good at capturing long-term dependencies both forwards and backwards, is introduced to process the data and exploit the sequential information. LSTM has three gates with different types: the forget gate \(f_{t}\), the input gate \(i_{t}\) and the output gate \(o_{t}\), they together control how information is updated to the state. At time t, the forget gate \(f_{t}\) determines how much past information is discarded, and it is updated as follows.
where \(x_{t}\) is used as input to the memory cell at time t.
\(i_{t}\) represents the input gate and determines what information to be retained currently.
The calculation method of candidate state \(\tilde{C}_{t}\) is similar to the traditional RNNs.
\(C_{t}\) is the updated cell state.
\(o_{t}\) is the output gate and \(h_{t}\) is the output value.
Based on the initial visit vectors, the learning process of patient representation is as follows. First of all, BiLSTM is used to encode the vectors and generate the hidden states \(h_{n}=\left\{ h_{n}^{1}, h_{n}^{2}, \ldots , h_{n}^{t}, \ldots , h_{n}^{T}\right\} \), which is concatenated by the forward output \(\overrightarrow{h_{n}}\) and backward output \(\overleftarrow{h_{n}}\).
Furthermore, an attention mechanism [20] is applied to reward patient visits that are clues to correctly predict patient’s mortality, and we compute the patient representation \(x_{n}\) as a weighted sum of the hidden state vectors based on the learned weights.
where \(\alpha _{n}=\left\{ \alpha _{n}^{1}, \alpha _{n}^{2}, \ldots , \alpha _{n}^{t}, \ldots , \alpha _{n}^{T}\right\} \), \(W_{1}\) and \(W_{2}\) are parameter matrices.
Therefore, a sequence of representations of patients \(x=\left\{ x_{1}, x_{2}, \ldots , x_{n}, \ldots , x_{N}\right\} \) are obtained.
3.4 Patient’s Mortality Prediction
The results obtained by the representation learning method are high level representations of patients which can be used as the features for patient’s mortality prediction. We add a fully connected layer with softmax classifier for the final outcome prediction as follows,
where \(W_{p r e}\) is a parameter matrice and \(b_{p r e}\) is a bias vector.
The cross-entropy is introduced to calculate the prediction loss as follows,
where \(y_{n}\) is a binary variable in prediction problems. We use the dot product of \(\alpha \) and its transpose, subtracted by an identity matrix, as a penalization term to focus attention on multiple diverse areas instead of just being limited to a certain aspect.
4 Experimental Results and Analysis
4.1 Data Set
Medical Information Mart for Intensive Care (MIMIC-III) [16] is a large, single-center database, which is jointly released by Computational Physiology Laboratory of the Massachusetts Institute of Technology, the Beth Israel Deaconess Medical Center (BIDMC) and Philips Healthcare in 2006. The database has 26 kinds of data tables involving hospitalization, patient’s information, diagnosis, medication, and so on [6].
We extract the patients who have more than one visits and use the diagnosis information in terms of the first three digits of International Classification of Diseases-9 (ICD-9) codes to construct the EHRs sequences. For the extracted and classified diagnosis codes, we number them in order to better carry out code embedding. Specifically, each visit sequence in Fig. 2 is composed of a series of digital numbers representing diagnosis codes. The patient’s mortality \(y_{i} \in \{0,1\}\) (0 means survival, 1 means death) is extracted for training labels. The basic information of the database is shown in Table 1.
The reasons for selecting diagnosis codes as the features of clinical prediction tasks are as follows. On the one hand, the diagnosis codes can reflect the patient’s illness and conditions during the hospitalization, which plays an important role in predicting patient’s mortality; On the other hand, there are valuable implicit associations between them. For example, diabetic patients may also suffer from diabetes-related complications (e.g. cardiovascular disease) to a large extent, which indicates that there may be some valuable potential correlations between diabetes and its complications.
The codes follow a certain hierarchical pattern where the classification granularity of the disease gradually increases. For example, the diagnosis code 250.00 represents diabetes without mention of complications, 250.10 indicates diabetes with ketoacidosis and 250.20 indicates diabetes with hyperosmolarity. In this study, we group the codes into high-order categories by selecting the first three digits of them to reduce information overload and have a generalized specifcity level. The operation also makes the codes more generalized and hierarchical. The classified codes have also been widely practiced in multiple researches [7, 8, 10, 25, 26].
4.2 Evaluation Metrics
We use AUC, accuracy, recall and F1 score as the evaluation metrics. The ROC curve is a plot of true positive rate (TPR) versus false positive rate (FPR), which are defined in Eqs. (19) and (20) respectively. AUC is computed by integrating the ROC curve.
Accuracy refers to the proportion of the number of samples with correct classification among the total number of samples as follows.
Recall means the number of correct positive results divided by the number of positive results that should have been returned.
F1 score is the harmonic mean of classification precision and recall. The formula is as follows.
The meanings of TP, FP, TN and FN are shown in Table 2.
4.3 Comparative Algorithms
In order to evaluate the performance of MLRL in patient’s mortality prediction as well as its effectiveness of feature learning, we compare MLRL with baseline methods as follows.
-
(1)
Logistic regression (LR)
The inputs of LR [10] are the aggregated vectors formed by the visits of patients. Specifically, without vector learning, the patient vector as input is directly constructed from the original visit sequences.
-
(2)
Multi-layer perception (MLP)
MLP [10] uses the same inputs as LR, and introduce a hidden layer with size 400 between the input and output.
-
(3)
Deep patient
Deep Patient [25], an unsupervised representation learning method, aims to learn the patient representation from raw clinical data by a stack of denoising autoencoders (SDA). In this paper, we use the patient’s visits as input and train a three-layer stacked autoencoder to minimize the reconstruction error. The number of hidden units per layer is set to 400. This setting makes the dimension of the output representation consistent with other methods. Similarly, this method also directly learns the visit vectors and constructs the patient representations based on them.
-
(4)
Med2Vec
Med2Vec [9] is a scalable two-layer neural network for learning lower dimensional representations of medical concepts. This method follows the idea of skip-gram to learn the code representations, and predicts the codes appearing in the following visit based on the current visit information. The hidden layer size of the network is set to 400. Since the original Med2Vec is used for multiple variable prediction, we change the final softmax function to implement binary prediction task (i.e. patient’s mortality prediction).
-
(5)
BiLSTM-soft (BiLSTM-Softmax)
BiLSTM-Soft [3] utilizes BiLSTM to process the patient visits and learn their representations. Then, the patient representation, formed by the aggregated visit representations, is used as the features to train the softmax classifier for prediction task. The inputs of this method are the original patient visit sequences shown in Fig. 2. Both forward LSTM and backward LSTM with 200 hidden units constitute BiLSTM.
-
(6)
BiLSTM-Att-Soft (BiLSTM -Attention-Softmax)
BiLSTM-Att-Soft method [36] performs the same process as BiLSTM-Soft and keep parameter settings consistent, but combine an attention mechanism to learn the weights which are generated for patient visits. Neither of these BiLSTM-based methods learn the representations of the diagnosis codes occurring in patient visits, and both directly process the original visit sequences.

The training process of MLRL and baseline methods
4.4 Experimental Results
4.4.1 Experimental Results and Analysis for Patient’s Mortality Prediction
We randomly divide the dataset into ten mutually exclusive subsets with the same mortality, of which eight subsets are used to train the models and the remaining two subsets are used for validation and testing respectively. Most of the data constitutes the training set for training the model, the validation set is used to test the generalization ability of the model and find out whether the model has over-fitting phenomenon in time, the test set is used to verify the model performance.

Comparison of the results for different data representations
Adam optimizer [17] with a learning rate of 0.0001 is used to minimize the loss of the task, and all methods are implemented in tensorflow. The detailed parameter settings of MLRL are shown in Table 3. In the process of parameter selection, we refer to the parameter settings of attention mechanism and BiLSTM in [10, 32], and make appropriate adjustments according to our data dimensions. Besides, we set a loss threshold of 0.15 to train the model and get the training epoch. In order to ensure the validity of the comparison results, the parameters (such as the optimizer, learning rate) of the network in baseline methods are consistent with MLRL and the dimension of the output representations is guaranteed to be same.
The predictive performance of MLRL and baselines is presented in Table 4, and the model performance is evaluated with AUC, accuracy, recall, and F1 score.
According to Table 4, compared with other baselines, Deep Patient reports the better accuracy, recall and F1 score with its unsupervised deep learning network. Med2Vec plays a certain role in exploiting the potential connections of medical concepts, and its performance metrics are slightly higher than other baselines. Furthermore, BiLSTM-based methods (including BiLSTM-Soft and BiLSTM-Att-Soft) achieve better prediction performance. They achieve an AUC close to 0.9, which is 7% higher than that obtained by the common classifiers such as LR and MLP. This is because the methods are good at processing the patient visits with chronological characteristic. In addition, it is worth mentioning that the results are improved after an attention mechanism are combined with BiLSTM, which indicates that the attention mechanism plays a significant role in improving the model quality. Finally, MLRL with multi-layer structure significantly outperforms all baseline methods, it achieves an AUC of 0.915 while baselines just get 0.8–0.9 (i.e., 1–10% improvement). In sum, MLRL does yield obvious improvements for the prediction task.
Figure 4 shows the training process of MLRL and baseline methods. As shown in Fig. 4, we can find an obvious and important aspect of the experimental results, which is the overfitting phenomenon in the methods. Constantly increasing the training epochs degrades the performance of all of the methods, as it leads to overfitting. For example, overtraining makes the results of BiLSTM-Soft show a downward trend. Similar behavior can be seen as we train BiLSTM-Att-Soft for more epochs, which suggests that appropriate model training is necessary and early stop** technique should be applied to the representation learning of the medical field.
4.4.2 Analysis of Different Data Representations
To measure the quality of the data representation learned by MLRL and evaluate how well it performs in prediction task on different classifiers, we conduct experiments for several classifiers with different representations. Specifically, the experiment is to obtain the patient representations learned by all methods, and then input them as features to different classifiers for prediction tasks and compare the results. The classifiers we used include LR, MLP, LSTM, random forest (RF) and support vector machine (SVM), and the baseline methods include BiLSTM, BiLSTM-Att (BiLSTM-Attention), Deep Patient and Med2Vec.
Table 5 presents the prediction performance of different representations in terms of AUC, accuracy, recall and F1 score. From Table 5, we can observe that compared with raw data, the performance of all the representation learning methods improves, but MLRL shows superior predictive performance, demonstrates their applicability in the prediction tasks. This experimental results also show that all the methods can capture the effective information and learn different patient representations which have different contributions to the final outcome prediction. However, because the neural network-based baseline methods do not explore the hierarchical EHRs structure, or do not focus on the valuable relational information in the sequences, the prediction performance of them is not good as that achieved by MLRL which learns the patient representation by the hierarchical learning of code and visit information. In Table 5, the results of our learned representation are superior to those obtained by raw data. Particularly for SVM classifier, MLRL achieves an AUC of 0.837 while raw data just get 0.748, and other evaluation metrics are also improved about 7–12%. Meanwhile, MLRL consistently outperforms all other feature learning baseline methods. Taking LSTM classifier as an example, MLRL improves other baseline methods by 3.9%, 2.9%, 4.3% and 1.9% respectively in terms of AUC. In Fig. 5, we present a more intuitive comparison of all the methods in terms of AUC, accuracy, recall and F1 score.
In sum, the performance of MLRL on patient’s mortality prediction are better than baseline methods, which shows that taking advantage of the EHRs structure characteristics to hierarchically exploit the significant information embedded in EHRs helps to learn more effective representations.
5 Conclusion
In this paper, we propose MLRL to learn an effective deep representation of EHRs based on RNNs and attention mechanisms. MLRL learns the patient representation by hierarchically mining the valuable and effective information existed in diagnosis codes and patient visits. Then, we apply the proposed method to patient’s mortality prediction with real EHRs data. The experimental results demonstrate that MLRL is capable of achieving more accurate prediction and improving the prediction performance of the tasks. In addition, the evaluation results of the data representation learned by MLRL significantly outperform those achieved by raw EHRs data and other learned representations.
In future work, we are going to study a wider range of medical events, such as the various physical indicators and clinical notes, to further explore the valuable information. In addition, we also refer to the description of emotion in [41] and plan to explore the relationships between patient’s emotions and diseases.
References
Ardakani AA, Kanafi AR, Acharya UR, Khadem N, Mohammadi A (2020) Application of deep learning technique to manage covid-19 in routine clinical practice using ct images: results of 10 convolutional neural networks. Comput Biol Med 121:103795
Ashfaq A, Sant’Anna AP, Lingman M (2019) Readmission prediction using deep learning on electronic health records. J Biomed Inform 97:103256
Bai T, Zhang S, Egleston BL, Vucetic S (2018) Interpretable representation learning for healthcare via capturing disease progression through time. In: Acm Sigkdd international conference, pp 43–51
Bernardini M, Morettini M, Romeo L (2020) Early temporal prediction of type 2 diabetes risk condition from a general practitioner electronic health record: a multiple instance boosting approach. Artif Intell Med 105:101847
Cai X, Gao J, Ngiam KY, Ooi BC, Zhang Y, Yuan X (2018) Medical concept embedding with time-aware attention. In: Twenty-seventh international joint conference on artificial intelligence IJCAI-18, pp 3984–3990
Cheng J, Li B (2017) Research on mimic-iii electronic medical record dataset and its mining. J Inf Resour Manag 04(7):37
Cheng Y, Wang F, Zhang P, Hu J (2016) Risk prediction with electronic health records: a deep learning approach. In: SIAM international conference on data mining, pp 432–440
Choi E, Bahadori MT, Schuetz A, Stewart WF, Sun J (2015) Doctor ai: predicting clinical events via recurrent neural networks. ar**v:1511.05942 (2015)
Choi E, Bahadori MT, Searles E, Coffey C, Thompson M, Bost J, Tejedorsojo J, Sun J (2016) Multi-layer representation learning for medical concepts. In: Knowledge discovery and data mining, pp 1495–1504
Choi E, Bahadori MT, Sun J, Kulas J, Schuetz A, Stewart WF (2016) Retain: an interpretable predictive model for healthcare using reverse time attention mechanism. In: Neural information processing systems, pp 3504–3512
Deng J, Zeng W, Shi Y, Kong W, Guo S (2020) Fusion of FDG-pet image and clinical features for prediction of lung metastasis in soft tissue sarcomas. Comput Math Methods Med 1:1–11
Dong H, Supratak A, Pan W, Wu C, Matthews PM, Guo Y (2018) Mixed neural network approach for temporal sleep stage classification. IEEE Trans Neural Syst Rehabil Eng 26:324–333
Du S, Li T, Yang Y (2020) Multivariate time series forecasting via attention-based encoder-decoder framework. Neurocomputing 388:269–279
Hochreiter S, Schmidhuber J (1997) Long short-term memory. Neural Comput 9(8):1735–1780
Jiang Y, Zheng Y, Hou S, Chang Y, Gee JC (2017) Multimodal image alignment via linear map** between feature modalities. J Healthc Eng 2017:1–6
Johnson AEW, Pollard TJ, Shen L, Lehman LH, Feng M, Ghassemi MM, Moody B, Szolovits P, Celi LA, Mark RG (2016) Mimic-iii, a freely accessible critical care database. Sci Data 3(1):160035–160035
Kingma D, Ba J (2014) Adam: a method for stochastic optimization. In: International conference on learning representations, pp 1–15
Lecun Y, Bengio Y, Hinton GE (2015) Deep learning. Nature 521(7553):436–444
Li S, Lei H, Zhou F, Gardezi J, Lei B (2019) Longitudinal and multi-modal data learning for parkinson’s disease diagnosis via stacked sparse auto-encoder. In: 2019 IEEE 16th international symposium on biomedical imaging (ISBI 2019) Venice, Italy, April 8–11, 2019
Lin Z, Feng M, Santos CND, Yu M, **ang B, Zhou B, Bengio Y (2017) A structured self-attentive sentence embedding. ar**v:1703.03130
Liu R, Wang H, Yu X (2018) Shared-nearest-neighbor-based clustering by fast search and find of density peaks. Inform Sci 450:200–226
Liu X, Li K, Li K (2020) Attentive semantic and perceptual faces completion using self-attention generative adversarial networks. Neural Process Lett 51(1):211–229
Liu Z, Sun M, Lin Y, **e R (2016) Knowledge representation learning: a review. J Comput Res Dev 53(2):247–261
Ma F, Chitta R, Zhou J, You Q, Sun T, Gao J (2017) Dipole: Diagnosis prediction in healthcare via attention-based bidirectional recurrent neural networks. In: Knowledge discovery and data mining, pp 1903–1911
Miotto R, Li L, Kidd BA, Dudley JT (2016) Deep patient: an unsupervised representation to predict the future of patients from the electronic health records. Sci Rep 6(1):26094–26094
Nguyen P, Tran T, Wickramasinghe N, Venkatesh S (2017) Deepr: a convolutional net for medical records. IEEE J Biomed Health Inf 21(1):22–30
Pandey SK, Janghel RR (2019) Recent deep learning techniques, challenges and its applications for medical healthcare system: a review. Neural Process Lett 50(2):1907–1935
Razavian N, Marcus J, Sontag D (2016) Multi-task prediction of disease onsets from longitudinal lab tests. ar**v:1608.00647
Ruan T, Lei L, Zhou Y, Zhai J, Gao J (2019) Representation learning for clinical time series prediction tasks in electronic health records. BMC Med Inform Decis Making 19(8):259
Shickel B, Tighe PJ, Bihorac A, Rashidi P (2018) Deep EHR: a survey of recent advances in deep learning techniques for electronic health record (EHR) analysis. IEEE J Biomed Health Inform 22(5):1589–1604
Solares JRA, Raimondi F, Zhu Y, Rahimian F, Canoy D, Tran J, Gomes ACP, Payberah AH, Zottoli M, Nazarzadeh M et al (2020) Deep learning for electronic health records: a comparative review of multiple deep neural architectures. J Biomed Inform 101:103337–103351
Vaswani A, Shazeer N, Parmar N, Uszkoreit J, Jones L, Gomez AN, Kaiser L, Polosukhin I (2017) Attention is all you need. In: Neural information processing systems, pp 5998–6008
Wang W, Hu H (2019) Image captioning using region-based attention joint with time-varying attention. Neural Process Lett 50(1):1005–1017
Wang Z, Li H, Liu L (2019) Predictive multi-level patient representations from electronic health records. In: 2019 IEEE international conference on bioinformatics and biomedicine, pp 987–990
**ng S, Liu F, Wang Q, Zhao X, Li T (2019) A hierarchical attention model for rating prediction by leveraging user and product reviews. Neurocomputing 332:417–427
Yang Y, Zheng X, Ji C (2019) Disease prediction model based on bilstm and attention mechanism. In: 2019 IEEE international conference on bioinformatics and biomedicine (BIBM), pp 1141–1148
Yu X, Wang H, Zheng X, Wang Y (2016) Effective algorithms for vertical mining probabilistic frequent patterns in uncertain mobile environments. In: Ubiquitous computing, pp 137–151
Yuan Y, Xun G, Suo Q, Jia K, Zhang A (2019) Wave2vec: deep representation learning for clinical temporal data. Neurocomputing 324:31–42
Zhang J, Kowsari K, Boukhechba M (2020) Sparse longitudinal representations of electronic health record data for the early detection of chronic kidney disease in diabetic patients. In: CoRR
Zhang S, Xu X, Pang Y, Han J (2019) Multi-layer attention based cnn for target-dependent sentiment classification. In: Neural processing letters, pp 1–15
Zhang J, Liu X, Ren F (2016) The effects of group diversity and organizational support on group creativity. Acta Psychol Sin 48(12):1551–1560
Acknowledgements
We are grateful for the support of the National Natural Science Foundation of China (61373149, 61672329, 91846205), the National Key R & D Program (2017YFB1400102, 2016YFB1000602), and SDNSFC (No. ZR2017ZB0420).
Author information
Authors and Affiliations
Corresponding author
Ethics declarations
Conflict of interest
The authors declare that they have no conflict of interest.
Additional information
Publisher's Note
Springer Nature remains neutral with regard to jurisdictional claims in published maps and institutional affiliations.
Rights and permissions
About this article

Cite this article
Yang, S., Zheng, X., Ji, C. et al. Multi-layer Representation Learning and Its Application to Electronic Health Records. Neural Process Lett 53, 1417–1433 (2021). https://doi.org/10.1007/s11063-021-10449-2
Accepted:
Published:
Issue Date:
DOI: https://doi.org/10.1007/s11063-021-10449-2