
Abstract
Clustering has primarily been used as an analytical technique to group unlabeled data for extracting meaningful information. The fact that no clustering algorithm can solve all clustering problems has resulted in the development of several clustering algorithms with diverse applications. We review data clustering, intending to underscore recent applications in selected industrial sectors and other notable concepts. In this paper, we begin by highlighting clustering components and discussing classification terminologies. Furthermore, specific, and general applications of clustering are discussed. Notable concepts on clustering algorithms, emerging variants, measures of similarities/dissimilarities, issues surrounding clustering optimization, validation and data types are outlined. Suggestions are made to emphasize the continued interest in clustering techniques both by scholars and Industry practitioners. Key findings in this review show the size of data as a classification criterion and as data sizes for clustering become larger and varied, the determination of the optimal number of clusters will require new feature extracting methods, validation indices and clustering techniques. In addition, clustering techniques have found growing use in key industry sectors linked to the sustainable development goals such as manufacturing, transportation and logistics, energy, and healthcare, where the use of clustering is more integrated with other analytical techniques than a stand-alone clustering technique.
1 Introduction
Clustering has been defined as the grou** of objects in which there is little or no knowledge about the object relationships in the given data (Jain et al. 1999; Liao 2005; Bose and Chen 2015; Grant and Yeo 2018; Samoilenko and Osei-Bryson 2019; ** is such that objects that are within the same class have similarity characteristics and are different from objects within other classes. Clustering has also been described as an aspect of machine learning that deals with unsupervised learning. The learning lies in algorithms extracting patterns from datasets obtained either from direct observation or simulated data. Schwenker and Trentin (2014) described the learning process as attempts to classify data observations or independent variables without knowledge of a target variable.
The grou** of objects into different classes has been one of the outcomes of data clustering over the years. However, the difficulty of obtaining a single method of determining the ideal or optimal number of classes for several clustering problems has been a key clustering issue noted by several authors such as Sekula et al. (2017), Rodriguez et al. (2019), Baidari and Patil (2020). Authors have referred to this issue as the subjectivity of clustering. Sekula et al. (2017), Pérez-Suárez et al. (2019) and Li et al. (2020a) described this subjectivity as the difficulty in indicating the best partition or cluster. The insufficiency of a unique clustering technique in solving all clustering problems would imply the careful selection of clustering parameters to ensure suitability for the user of the clustering results. Jain et al. (1999) specifically noted the need for several design choices in the clustering process which have the potential for the use and development of several clustering techniques/algorithms for existing and new areas of applications. They presented general applications of clustering such as in information filtering and retrieval which could span across several industrial/business sectors. This work however discusses applications of clustering techniques specifically under selected industrial/business sectors with strong links to the United Nations Sustainable Development Goals (SDGs). We also note some new developments in clustering such as in techniques and datatype over the years of the publication of Jain et al. (1999).
This review aims to give a general overview of data clustering, clustering classification, data concerns in clustering, application and trends in the field of clustering. We present a basic description of the clustering component steps, clustering classification issues, clustering algorithms, generic application of clustering across different industry sectors and specific applications across selected industries. The contribution of this work is mainly to underscore how clustering is being applied in industrial sectors with strong links to the SDGs. Other minor contributions are to point out clustering taxonomy issues, and data input concerns and suggest the size of input data is useful for classifying clustering algorithms. This review is also useful as a quick guide to practitioners or users of clustering methods interested in understanding the rudiments of clustering.
Clustering techniques have predominantly been used in the field of statistics and computing for exploratory data analysis. However, clustering has found a lot of applications in several industries such as manufacturing, transportation, medical science, energy, education, wholesale, and retail etc. Furthermore, Han et al. (2011), Landau et al. (2011), and Ezugwu et al. (2022) indicated an increasing application of clustering in many fields where data mining or processing capabilities have increased. Besides, the growing requirement of data for analytics and operations management in several fields has increased research and application interest in the use of clustering techniques.
To keep up with the growing interest in the field of clustering over the years, general reviews of clustering algorithms and approaches have been observable trends (Jain et al. 1999; Liao 2005; Xu and Wunsch 2005; Alelyani et al. 2013; Schwenker and Trentin 2014; Saxena et al. 2017). Besides, there has been a recent trend of reviews of specific clustering techniques such as in Denoeux and Kanjanatarakul (2016), Baadel et al. (2016) Shirkhorshidi et al. (2014), Bulò and Pelillo (2017), Rappoport and Shamir (2018), Ansari et al. (2019), Pérez-Suárez et al. (2019), Beltrán and Vilariño (2020), Campello et al. (2020). We have also observed a growing review of clustering techniques under a particular field of application such as in Naghieh and Peng (2009), Xu and Wunsch (2010), Anand et al. (2018), Negara and Andryani (2018), Delgoshaei and Ali (2019). However, there appears not to be sufficient reviews targeted at data clustering applications discussed under the Industrial sectors. The application of clustering is vast, and as Saxena et al. (2017) indicated, might be difficult to completely exhaust.
To put this article into perspective, we present our article selection method, a basic review of clustering steps, classification and techniques discussed in the literature under Sect. 2. Furthermore, we discuss clustering applications across and within selected business sectors or Industries in Sect. 3. A trend of how clustering is being applied in these sectors is also discussed in Sect. 3. In Sect. 4 we highlight some data issues in the field of clustering. Furthermore, in Sect. 5, we attempt to discuss and summarize clustering concepts from previous sections. We thereafter conclude and suggest future possibilities in the field of data clustering in Sect. 6.
2 Components and classifications for data clustering
Our article selection in this work follows a similar literature search approach of Govender and Sivakumar (2020) where google scholar (which provides indirect links to databases such as science direct) was indicated as the main search engine. In addition to key reference word combinations, they used such as "clustering", "clustering analysis”, we searched the literature using google scholar for clustering techniques", "approaches", "time series", "clustering sector application", "transportation", "manufacturing", “healthcare” and “energy”. More search was conducted using cross-referencing and the screening of abstracts of potential articles. We ensured that the articles with abstracts containing the keywords earlier indicated were selected for further review while those not relevant to our clustering area of focus were excluded. Figure 1 below further illustrates the process of our article selection using the Prisma flow diagram (Page et al. 2021) which aims to show the flow of information and summary of the screening for different stages of a systematic review.
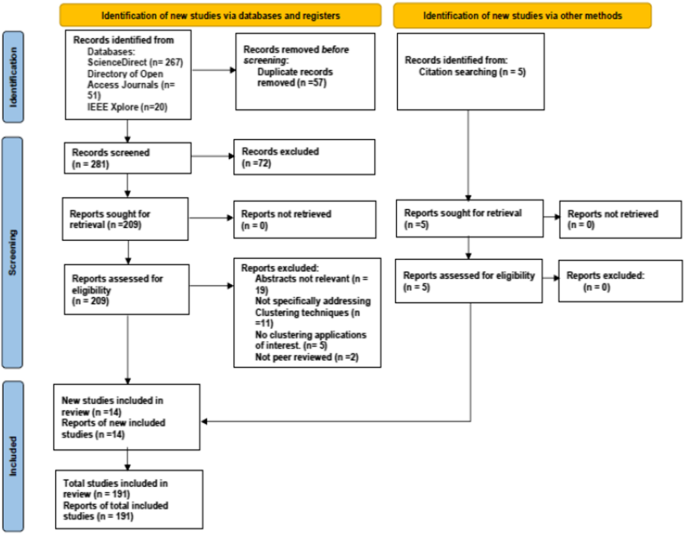
Article selection process using PRISMA 2020 Flow diagram
The components of data clustering are the steps needed to perform a clustering task. Different taxonomies have been used in the classification of data clustering algorithms Some words commonly used are approaches, methods or techniques (Jain et al. 1999; Liao 2005; Bulò and Pelillo 2017; Govender and Sivakumar 2020). However, clustering algorithms have the tendency of being grouped or clustered in diverse ways based on their various characteristics. Jain et al. (1999) described the tendency to have different approaches as a result of cross-cutting issues affecting the specific placement of clustering algorithms under a particular approach. Khanmohammadi et al. (2017) noted these cross-cutting issues as a non-mutual exclusivity property of clustering classification. We follow the logical perspective of Khanmohammadi et al. (2017) using the term criteria to classify data clustering techniques or approaches. The clustering techniques or approaches are subsequently employed to classify clustering algorithms.
2.1 Components of a clustering task
Components of data clustering have been presented as a flow from data samples requirement through clustering algorithms to cluster formations by several authors such as Jain et al. (1999), Liao (2005), and Xu and Wunsch (2010). According to Jain et al. (1999), the following were indicated as the necessary steps to undertake a clustering activity: pattern representation (feature extraction and selection), similarity computation, grou** process and cluster representation. Liao (2005) suggested three key components of time series clustering which are the clustering algorithm, similarity/dissimilarity measure and performance evaluation. Xu and Wunsch (2010) presented the components of a clustering task as consisting of four major feedback steps. These steps were given as feature selection/extraction, clustering algorithm design/selection, cluster validation and result interpretation. According to Alelyani et al. (2013) components of data clustering was illustrated as consisting of the requirement of unlabeled data followed by the operation of collating similar data objects in a group and separation of dissimilar data objects into other groups. Due to the subjective nature of clustering results, the need to consider performance evaluation of any methods of clustering used has become necessary in the steps of clustering.
Taking these observations into consideration, we essentially list steps of clustering activity below and present them also in Fig. 2:
-
(1)
Input data requirement.
-
(2)
Pattern representation (feature extraction and selection).
-
(3)
Clustering or grou** process (Clustering algorithm selection and similarity/dissimilarity computation).
-
(4)
Cluster formation.
-
(5)
Performance evaluation (clustering validation).
-
(6)
Knowledge extraction.
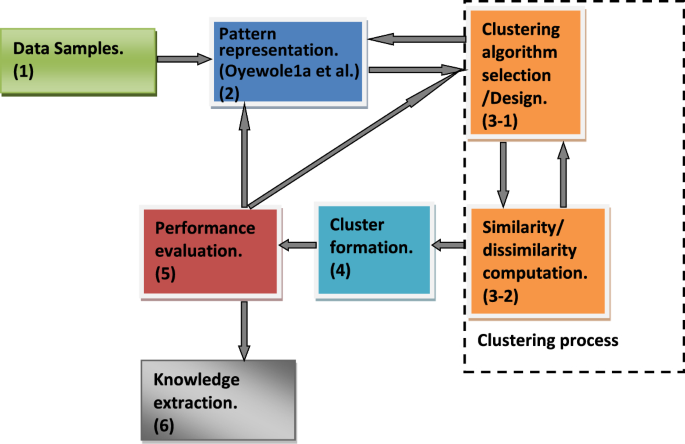
Typical clustering steps (1 to 6)
Out of the six steps highlighted above, component steps (2), (3), and (5) practically appear to be critical. This is because if the components steps (2), (3), and (5) are not appropriately and satisfactorily conducted during clustering implementation, each step or all steps (2), (3) (5) including (4) might need to be revisited. We briefly discuss these vital steps.
2.1.1 Pattern representation (step 2)
Jain et al. (1999) defined pattern representation as the "number of classes, the number of available patterns, and the number, type, and scale of the features available to the clustering algorithm". They indicated that pattern representation could consist of feature extraction and/or selection. On one hand, feature selection was defined as “the process of identifying the most effective subset of the original features to use in the clustering process”. On the other hand, “feature extraction is the use of one or more transformations of the data input features to produce new salient features to perform the clustering or grou** of data.” We refer readers to Jain et al. (1999), Parsons et al. (2004), Alelyani et al. (2013), Solorio-Fernández et al. (2020) for a comprehensive review of pattern representation, feature selection and extraction.
2.1.2 Clustering or grou** process (step 3)
This step is essentially described as the grou** process by Jain et al. (1999) into a partition of distinct groups or groups having a variable degree of membership. Jain et al. (1999) noted that clustering techniques attempt to group patterns so that the classes thereby obtained reflect the different pattern generation processes represented in the pattern set. As noted by Liao (2005) clustering algorithms are a sequence of procedures that are iterative and rely on a stop** criterion to be activated when a good clustering is obtained. Clustering algorithms were indicated to depend both on the type of data available and the particular purpose and application. Liao (2005) discussed similarity/dissimilarity computation as the requirement of a function used to measure the similarity between two data types (e.g., raw values, matrices, features-pairs) being compared. Similarly, Jain et al. (1999) presented this as a distance function defined on a pair of patterns or grou**s. Several authors such as Jain et al. (1999), Liao (2005), Xu and Wunsch (2010), Liu et al. (2020) have noted that similarity computation is an essential subcomponent of a typical clustering algorithm. We further discuss some similarity/dissimilarity measures in Sect. 2.4.
2.1.3 Performance evaluation (step 5)
This step is done to confirm the suitability of the number of clusters or grou**s obtained as the results of clustering. Liao (2005) discussed this as validation indices or functions to determine the suitability or appropriateness of any clustering results. Sekula et al. (2017) indicated that the high possibility of clustering solutions is dependent on the validation indices used and suggests the use of multiple indices for comparison.
2.2 Clustering classification
There have been different terminologies for data clustering classification in the literature. This variety of classifications was indicated by Samoilenko and Osei-Bryson (2019), Rodriguez et al. (2019) as a means to organize different clustering algorithms in the literature. Some have used the word approaches, methods, and techniques. However, the term techniques and methods appear to have been widely used to depict the term clustering algorithms.
Liao (2005) segmented time-series data clustering using three main criteria. These criteria referred to the manner of handling data as either in its raw form or transforming the raw data into a feature or parameters of a model. Saxena et al. (2017) used the terminology of clustering approaches and indicated linkage to the reason for different clustering techniques. This is due to the reason for the word “cluster” not having an exact meaning for the word. Bulò and Pelillo (2017) also discussed the limitation of hard or soft classifications of clustering into partitions and they suggested an approach to clustering which was referred to as the game-theoretic framework that simultaneously overcomes limitations of the hard and soft partition approach of clustering. Khanmohammadi et al. (2017) indicated five criteria in the literature for classifying clustering algorithms which are the nature of data input, the measure of proximity of data objects, generated data cluster, membership function style and clustering strategy. These criteria have resulted in different classifications of clustering algorithms.
We present in Fig. 3 below a summary of the classification criteria presented by Khanmohammadi et al. (2017). We extend the classification criteria by adding a criterion that can also be used to classify clustering algorithms. This is the size of input data. The size of data was presented as a factor that affects the selection of clustering algorithm by Andreopoulos et al. (2009), Shirkhorshidi et al. (2014) and more recently Mahdi et al. (2021). They observed that some clustering algorithms perform poorly and sacrifice quality when the size of data increases in volume, velocity, variability and variety. On another hand, some other clustering algorithms can increase scalability and speed to cope with the huge amount of data. Another possible criterion that could be added is what Bulò and Pelillo (2017) described as a framework for clustering. However, this appears to be a clustering strategy. They described this as a perspective framework of the clustering process that is different from the traditional approaches of obtaining the number of clusters as a by-product of partitioning. They referred to this as a clustering ideology which can be thought of as a sequential search for structures in the data provided. Figure 3 below categorizes the approaches or criteria and the sub-approaches or sub-criteria that can be useful in classifying clustering algorithms.
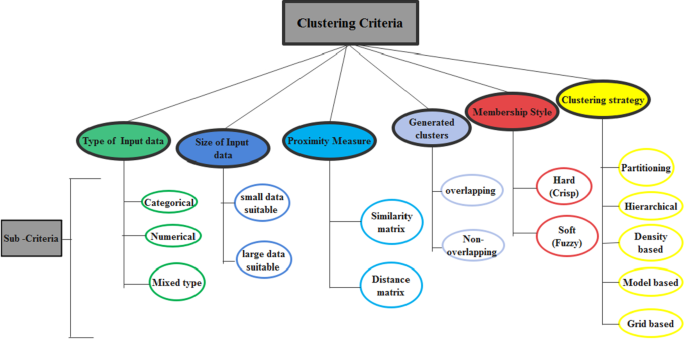
Criteria and sub-criteria for classifying clustering algorithms
2.3 Clustering algorithms
The criteria/sub-criteria described in the previous section can be used in classifying clustering algorithms. However, clustering algorithms have traditionally been classified as either having a partitioning (clusters obtained are put into distinctive groups) or hierarchical (forming a tree linkage or relationships for the data objects being grouped) strategy to obtain results. Jain et al. (1999) indicated the possibility of having additional categories to the traditional classification. Some authors have since then indicated the classification of clustering algorithms using five clustering strategies such as in Liao (2005), Han et al. (2011). Using the clustering criteria described earlier we demonstrate the classification of selected 21 clustering algorithms out of several clustering algorithms in the literature. These are (1) k-means, (2) k-mode, (3) k-medoid, (4), Density-Based Spatial Clustering of Applications with Noise (DBSCAN), (5) CLustering In QUEst (CLIQUE), (6) Density clustering (Denclue), (7) Ordering Points To Identify the Clustering Structure (OPTICS), (8) STatistical INformation Grid (STING), (9) k-prototype, (10) Autoclass (A Bayesian approach to classification) (11) fuzzy k-means, (12) COOLCAT (An entropy based algorithm for categorical clustering), (13) Cluster Identification via Connectivity Kernels (CLICK), (14) RObust Clustering using linK (Sandrock), (15) Self Organising Map (SOM), (16) Single-linkage (17) Complete-linkage (18) Centroid-linkage, (19) Clustering Large Applications Based upon Randomized Search (CLARANS), (20) Overlapped k-means, (21) Model-based Overlap** Clustering (MOC).
We summarize these classifications in Tables 1 and 2 below and include selected references for extensive reading.
2.3.1 Traditional clustering strategies
In this section, a basic description of clustering algorithms that represent the traditional clustering strategy of partitioning and hierarchical clustering algorithms is provided.
We present the common partitioning algorithm (k-means) and generic hierarchical clustering algorithm due to their basic usage and importance in being foundational for other clustering algorithms. This is as discussed by Xu and Wunsch (2010) and Sekula (2015), James et al. (2015) with some modifications to aid comprehension.
Given the following notations:
\(n\): number of observations of the data to the cluster (number of data objects).
\(K\): the number of clusters (selected randomly or obtained through statistical tests such as in the function NBclust in the statistical program R).
\({C}_{k}:\) Cluster centroid for each \(kth\) cluster, where \(k\) ranges from 1 to \(K\)
-
(a)
K-means algorithm
-
1.
Randomly assign a number from 1 to \(K\) to each of the \(n\) observations. (Initial cluster assignment.
-
2.
Iterate until the cluster assignment stops changing.
-
(a)
For each of the kth clusters, compute the cluster centroid Ck.
-
(b)
Assign each observation to the cluster whose centroid is closest (Where closest is defined using distance measures such as Euclidean distance).
-
(a)
-
3.
Iteration and cluster assignment ends when the total within-cluster variation summed over all \(K\) clusters is as small as possible.
-
1.
-
(b)
Generic hierarchical agglomerative clustering
-
1.
Begin with \(n\) observations and a distance/dissimilarity measure (such as Euclidean distance) of all \(n(n-1)/2\) pairwise dissimilarities (Each observation is treated as its cluster).
-
2.
Compute pairwise inter-cluster dissimilarities.
-
(a)
Examine all pairwise inter-cluster dissimilarities among the individual clusters and identify the pair of clusters that are least dissimilar (Dissimilarities computed depend on the type of linkages such as complete, single, or average and the type of dissimilarity measure such as correlation-based distances, Euclidean distances).
-
(b)
Combine these two clusters.
-
(c)
Compute the new pairwise inter-cluster dissimilarities among remaining clusters.
-
(a)
-
3.
Iteration proceeds until all \(n\)- observations belong to one cluster.
-
1.
-
(c)
Generic hierarchical divisive clustering
The hierarchical divisive clustering is the reverse of the hierarchical agglomerative clustering.
-
1.
Begins with one cluster (all \(n\) observations in a single cluster).
-
2.
Split this single (large) cluster in a hierarchy fashion into new smaller clusters using a dissimilarity measure and appropriate linkage.
-
3.
Iteration proceeds till all \(n\) observations have been allocated.
-
1.
2.3.2 Traditional clustering strategy variants
Denoeux and Kanjanatarakul (2016) and Saxena et al. (2017)presented clustering algorithms as basically having either hierarchical or partitioning strategies. The density-based, grid-based, and model-based clustering strategies were indicated by them to exhibit the spirit of either the hierarchical or partitioning strategy. The classification of clustering algorithms based on one of the five clustering strategies as presented in Table 2 above appears to be widely used by several authors. Therefore, we limit our further discussions of clustering algorithms based on clustering strategy.
Some other clustering algorithms have been noted by Han et al. (2011) and Campello et al. (2020) to possess characteristics that make them difficult to exclusively classify under one of the five clustering strategies. As a result, different classification strategies have been given in the literature to account for this (Saxena et al. 2017). Recently there have been additional clustering strategies developed such as discussed in Ezugwu et al. (2022). Some are partly to overcome limitations of the traditional clustering techniques such as in Bulò and Pelillo (2017), Valls et al. (2018), He et al. (2020). Others have resulted from the need to apply clustering in new fields of application. Saxena et al. (2017) also acknowledged the division of clustering algorithms into the five previous classifications above. However, they indicated other clustering methods such as multiobjective clustering, collaborative fuzzy clustering, search based clustering technique as variants of the two broad clustering methods earlier indicated. Based on their review we present a brief description.
We summarize the description of Saxena et al. (2017) and suggest other references of recent articles that have extended the selected clustering variants for detailed studies in Table 3 below.
We present basic steps of selected variants of the traditional clustering strategy as discussed by Saxena et al. (2017) including examples of clustering algorithms of selected clustering strategy variants as discussed by Jain et al. (1999), Pedrycz (2002), Johnell and Chehreghani (2020), Ramadan et al. (2020) with little modifications to aid basic comprehension. Given \(n\) number of observations of data the goal is to form clusters using different representations and approaches.
-
(a)
Grid-based clustering
-
1.
Define a set of grid cells.
-
2.
Assign observations to the appropriate grid cell and compute the density of each cell.
-
3.
Eliminate cells, whose density is below a certain threshold.
-
4.
Form clusters from contiguous groups of dense cells.
-
1.
-
(b)
Spectral clustering
-
1.
Construct a similarity graph between \(n\) observations or objects to be clustered.
-
2.
Compute the associated graph Laplacian matrix (This is obtained from the weighted adjacency matrix and diagonal matrix of the similarity graph).
-
3.
Compute the first \(K\)- eigenvectors of the Laplacian matrix to define a feature vector for each object (\(K\) implies the number of clusters to construct).
-
4.
Organize objects into \(K\) classes by running the \(k\)-means algorithm on the features obtained.
-
1.
-
(c)
Evolutionary based clustering
-
1.
Generate (e.g., randomly) a population of solution \(S\). Each solution S corresponds to valid \(K\)-partitions or clusters of \(n\) observations.
-
2.
Assign a fitness value with each solution.
-
3.
Assign a probability of selection or survival (based on the fitness value) to each solution.
-
4.
Obtain a new population of solutions using the evolutionary operators namely selection (e.g., roulette wheel selection), recombination (e.g., crossover) and mutation (e.g., pairwise interchange mutation).
-
5.
Evaluate the fitness values of these solutions.
-
6.
Repeat steps 4 to 5 until termination conditions are satisfied.
-
1.
-
(d)
Dominant set clustering
This follows the iterative procedure to compute clusters according to Johnell and Chehreghani (2020)
-
1.
Compute a dominant set using the similarity matrix of the available \(n\) observations or data objects.
-
2.
Remove the clustered observation from the data.
-
3.
Repeat until a predefined number of clusters has been obtained.
-
1.
-
(e)
Collaborative fuzzy clustering (Pedrycz 2002)
This is achieved through two stages namely: (A) Generation of clusters without collaboration and (B) Collaboration of the clusters.
-
1.
Given subsets of patterns (patterns are obtained from \(n\) observations)
-
2.
Select distance function, number of fuzzy clusters, termination criterion, and collaboration matrix.
-
3.
Initiate randomly all partition matrices based on the number of patterns.
-
4.
Stage A: Generation of clusters without collaboration.
-
4.1.
Compute prototypes (centroids) and partition matrices for all subsets of patterns. (The results of clustering for each subset of patterns come in the form of a partition matrix and collection of prototypes).
-
4.2.
Computation is done until a termination criterion has been satisfied.
-
4.1.
-
5.
Stage B: Collaboration of the clusters.
-
5.1.
Given the computed matrix of collaboration
-
5.2.
Compute prototypes (e.g., using Lagrange multipliers technique) and partition matrices (e.g., using weighted Euclidean distances between prototype and pattern)
-
5.3.
Computation is done until a termination criterion has been satisfied.
-
5.1.
-
1.
-
(f)
Multi-objective clustering
The multi-objective clustering is described using the \(k\)-means modified to work on two objective functions according to Ramadan et al. (2020).
-
1.
The data (consisting of \(n\) observations) is divided into a number of sets. The number of sets may depend on the number of distributed machines or the number of threads to be used.
-
2.
\(x\) value (mean) and \(y\) value (variance) are computed for each set of data.
-
3.
\(k\)-means clustering is applied to each set. \(K\)(number of clusters) is selected either heuristically or based on the number of records in each set.
-
4.
At the global optimizers, Pareto optimality is applied to the clusters’ centroids and nondominated centroids.
-
5.
For nondominated clusters, the distance between a point \(x\) and the cluster centre is computed as well as the Silhouette scores between \(x\) and the nearest cluster centre. Then, the \(k\)-means algorithm is used to re-cluster those points.
-
6.
A window W is used to extract the most effective clusters based on the required points. Pareto optimality could be applied once more for better results.
-
1.
-
(g)
Search-based clustering
The search-based clustering is described using the Simulated Annealing example presented by Jain et al. (1999).
-
1.
Randomly select an initial partition \({P}_{0}\) for the data (comprising \(n\) observations) and compute the squared error value termed \({E}_{P0}.\)
-
2.
Select values for the control parameters, initial and final temperatures \({T}_{0}\) and \({T}_{f}\) respectively.
-
3.
Select a neighbour partition (\({P}_{1}\)) of \({P}_{0}\) and compute its squared error value termed \({E}_{P1}\).
-
4.
If \({E}_{P1}\) is larger than \({E}_{P0}\), then assign \({P}_{1}\) to \({P}_{0}\) with a temperature-dependent probability. Else assign \({P}_{1}\) to \({P}_{0}\).
-
5.
Repeat step 3 for a fixed number of iterations.
-
6.
Reduce the value of \({T}_{0}\), i.e.\({T}_{0} = c{ T}_{0}\), where c is a predetermined constant.
-
7.
If \({T}_{0}\) is greater than \({T}_{f}\), then go to step 3. Else stop.
-
1.
2.4 Similarity and dissimilarity measures
As indicated by Jain et al. (1999) similarity measures are the actual strategies that clustering algorithms utilize in grou** data objects to fall within a class or cluster. The dissimilarity measures are used to differentiate a data grou** or cluster from one another. Saxena et al. (2017) also emphasized the important role similarity of objects within a cluster plays in a clustering process. According to Jain et al. (1999), many clustering methods use distance measures to determine the similarity or dissimilarity between any pair of objects and also they gave conditions for any valid distance measure. Xu and Wunsch (2010) emphasized the conditional requirement for computing similarity/dissimilarity function between any two data pairs of objects when using the distance measure. They stated that a valid similarity function or measure must satisfy the symmetry, positivity triangular inequality and reflexivity conditions. We present some of the similarity functions noted in the literature in Table 4 and suggest references to readers for more comprehensive studies. Other similarity functions or measures that have been discussed in the literature are city-block distance, sup distance, squared Mahalanobis, point symmetry distance. Xu and Wunsch (2010), Niwattanakul et al. (2013), Saxena et al. (2017) and Kalgotra et al. (2020) provide additional discussions on other similarity functions not included in this article.
Basic mathematical definitions of some of these measures as discussed by Xu and Wunsch (2010) are presented below. It is assumed that dataset \({\varvec{X}}\) consists of \({\varvec{n}}\) data objects or observations and \({\varvec{d}}\) features. Notation \(D\left(.,. \right)=>\) Distance function between two objects in the dataset. S \(\left(.,.\boldsymbol{ }\right)=>\) Similarity function between two objects in the dataset.
-
(a)
Minkowski distance:
\(D\left({{\varvec{x}}}_{{\varvec{i}}},{{\varvec{x}}}_{{\varvec{j}}}\right)=({\sum\limits_{l=1}^{d}{\left| {x}_{il }-{x}_{j l }\right|}^{p} ) }^\frac{1}{p}\)\(p=>\) a generic numeric value.
-
(b)
Euclidean distance:
$$D\left({{\varvec{x}}}_{{\varvec{i}}\boldsymbol{ }},\boldsymbol{ }{{\varvec{x}}}_{{\varvec{j}}\boldsymbol{ }}\right) =({\sum\limits_{l=1}^{d}{| {x}_{il }- {x}_{j l }|}^{2 }) }^{1/2}$$Special case of minkowski \(p= 2\)
-
(c)
Cosine similarity:
$${\varvec{S}}\left({{\varvec{x}}}_{{\varvec{i}} }, {{\varvec{x}}}_{{\varvec{j}} }\right) = {\varvec{c}}{\varvec{o}}{\varvec{s}} \boldsymbol{\alpha } = \frac{{{{\varvec{x}}}_{{\varvec{i}} }}^{{\varvec{T}} }{{\varvec{x}}}_{{\varvec{j}} }}{\| {{\varvec{x}}}_{{\varvec{i}} } \| \|{{\varvec{x}}}_{{\varvec{j}} }\|}$$ -
(d)
Extended Jaccard measure
$$D\left({{\varvec{x}}}_{{\varvec{i}}{ }},{ }{{\varvec{x}}}_{{\varvec{j}}{ }}\right)= \frac{{{{\varvec{x}}}_{{\varvec{i}}{ }}}^{T }{{\varvec{x}}}_{{\varvec{j}}{ }}}{ { \|{{{\varvec{x}}}_{{\varvec{i}}{ }}}\|}^{2} + { \|{{{\varvec{x}}}_{{\varvec{j}}{ }}}\|}^{2}- {{{\varvec{x}}}_{{\varvec{i}}{ }}}^{T }{{\varvec{x}}}_{{\varvec{j}}}}$$
2.5 Cluster optimization and validation
As indicated in the introduction section, obtaining the optimal number of clusters has been a major output of data clustering and an issue that keeps research in the field of clustering active. It has been widely indicated that no clustering algorithm can always solve all clustering problems. Saxena et al. (2017) emphasized user control in deciding the number of cluster results, which might either follow a trial and error, heuristic or evolutionary procedure. Fu and Perry (2020) discussed some trial and error and heuristic methods of obtaining the number of clusters and proposed a method that predicts errors and subsequently chooses the smallest error to determine the appropriate number of clusters. Improving the quality of clustering results obtainable from traditional clustering algorithms and variants have recently been advanced by some authors such as Calmon and Albi (2020), Chen et al. (2020), Ushakov and Vasilyev (2020).
As indicated by Jain et al. (1999) multiple features could be extracted or selected from given data and also performing a pairwise comparison of similarity within clusters for all data values can result in the combinatorial difficulty of clustering with an increase in data sizes. Also, Xu and Wunsch (2005) emphasized that different clustering algorithms could produce different results for a given data and also the same clustering algorithms using different approaches could still result in different clusters formed.
As a result, researchers have validated their search for the optimal number of clusters through techniques that are widely referred to as indices. Two major categories of indices have been highlighted in the literature. These are the internal indices and external indices. Some authors have indicated a breakdown of these validation indices into three categories but as Xu and Wunsch (2005) and Sekula et al. (2017) indicated these could still be subsumed into the spirit of internal and external indices. According to Baidari and Patil (2020), Internal indices measure the compactness of the clusters by applying similarity measure techniques cluster separability and intra-cluster homogeneity, or a combination of these two Baidari and Patil (2020). External criteria are conducted to match the structure of the cluster to a predefined classification of the instances to validate clustering results. They, however, noted the common use of internal validity with clustering algorithms. Table 5 below shows selected internal and external indices from the literature.
We present basic definitions of some of the indices discussed by Xu and Wunsch (2010) with some modifications to aid basic comprehension.
2.5.1 Description of selected external indices
Given a derived clustering structure \(C\), obtained using a clustering algorithm and linked to dataset \(X\) and a prescribed clustering structure P, linked to prior information on dataset \(X\).
\(a=\) number of pairs of data objects in \(X\), being a member of the same clusters in \(C\) and \(P\).
\(b=\) number of pairs of data objects in \(X\), being a member of the same clusters in \(C\) and but different clusters in \(P\).
\(c=\) number of pairs of data objects in \(X\), being a member of different clusters in \(C\) and but same clusters in \(P\).
\(d=\) number of pairs of data objects in \(X\), being a member of different clusters in \(C\) and \(P\).
\(M = n(n-1)/2\) (Total number of pairs of objects within \(n\) number of data objects in dataset \(X\).
-
(a)
Rand index (\({\varvec{R}}\)):
$$R= \frac{(a+d )}{M}$$ -
(b)
Jaccard coefficient \(({\varvec{J}}):\)
$$J= \frac{ a}{(a+b+c)}$$ -
(c)
Fowlkes and Mallows Index \(({\varvec{F}}{\varvec{M}}\)):
$$FM = \sqrt{\frac{ a}{(a+b)} \frac{ a}{(a+c)}}$$
2.5.2 Description of selected internal Indices
Also given \(n\) data objects in dataset \(X\), with \(K\) partitions indexed from \(i=1 to K\).
Where:
\({n}_{i}=\) Number of data objects assigned to cluster \({C}_{i}\)
\({m}_{i}=\) centroid linked to cluster \({C}_{i}\)
\(m=\) total centroid (mean) vector of the dataset.
\({e}_{i}=\) average error for cluster \({C}_{i}\)
\({e}_{j}=\) average error for cluster \({C}_{j}\)
\(D\left({C}_{i },{C}_{j } \right)=\) Distance function between clusters \({C}_{i}\) and \({C}_{j }\) in the dataset.
-
(a)
Calinski and Harabasz index \(({\varvec{C}}{\varvec{H}}):\)
$$CH\left(K\right)= \frac{{T}_{r }({S}_{B })}{K-1}/ \frac{{T}_{r }({S}_{w })}{n-K}$$where
$${T}_{r }\left({S}_{B }\right)= \sum_{i=1}^{K}{n}_{i} { \| {m}_{i}-m \| }^{2} \;\;(\text{Trace of between cluster scatter matrix})$$$${T}_{r }\left({S}_{w }\right)= \sum_{i=1}^{K}\sum_{j=1}^{{n}_{i}}{ \| {x}_{j}-{m}_{i} \| }^{2}\;\; (\text{Trace within}-\text{cluster scatter matrix})$$The larger the value of \(CH\left(K\right)\) the better the quality of the clustering solution obtained.
-
(b)
Davies-Bouldin Index \(({\varvec{D}}{\varvec{B}})\):
$$DB\left(K\right)= \frac{1}{K} \sum_{i=1}^{K}{R}_{i}$$where \({R}_{i}= \underset{j,\mathit{ }j\ne i}{\mathrm{max}} \left( \frac{{e}_{i}+{e}_{j}}{{ \| {m}_{i}-{m}_{j}\| }^{2}}\right)\)
The minimum \(DB\left(K\right)\) indicates the potential \(K\) in the data set.
-
(c)
Dunn Index \(({\varvec{D}}{\varvec{I}})\)
$$DI\left(K\right)= \underset{i=1,\dots ,K}{\mathrm{min}}\left( \underset{\begin{array}{c}j=1,\dots ,K, \\ j\ne i\end{array}}{\mathrm{min}}\left(\frac{{D(C}_{i}, {C}_{j}) }{\underset{\mathit{ }l=1,\dots ,K}{\mathrm{max}}\delta ({C}_{l})}\right)\right)$$
where \({D(C}_{i} ,{C}_{j})= \underset{ }{\underset{x \in {C}_{i} ,\mathit{ }y \in {C}_{j} }{\mathrm{min}}}D (x,y)\)
The larger the value of \(DI\left(K\right)\) the better the estimation of \(K\)
3 Applications of clustering
Clustering techniques have been widely used in several fields and areas (Rai et al. 2006; Devolder et al. 2012; Bulò and Pelillo 2017; Grant and Yeo 2018; Nerurkar et al. 2018; Govender and Sivakumar 2020). Its relevance has also been shown as an analytical technique on its own (Ray and Turi 1999; Lismont et al. 2017; Motiwalla et al. 2019) and also as a hybrid method with other analytical solution techniques such as in Grant and Yeo (2018), Zhu et al. (2019), Liu and Chen (2019), Jamali-Dinan et al. (2020), Tanoto et al. (2020), Pereira and Frazzon (2020). We review some field applications of clustering and subsequently review the application of clustering techniques in particular business sectors or fields.
3.1 Field applications
Some of the direct areas of clustering application generally discussed in the literature have been textual document classification, image segmentation, object recognition, character recognition, information retrieval, data mining, spatial data analysis, business analytics, data reduction, and big data mining. Other areas indicated by Saxena et al. (2017), have been sequence analysis (Durbin et al. 1998; Li et al. 2012), human genetic clustering, (Kaplan and Winther 2013; Lelieveld et al. 2017; Marbac et al. 2019), mobile banking and information system (Motiwalla et al. 2019; Shiau et al. 2019), social network analysis (Scott and Carrington 2011; Shiau et al. 2017; Khamparia et al. 2020), search result grou** (Mehrotra and Kohli 2016; Kohli and Mehrotra 2016), software evolution (Rathee and Chhabra 2018; Izadkhah and Tajgardan 2019), recommender systems (Petwal et al. 2020), educational data mining (Baker 2010; Guleria and Sood 2020), climatology (Sharghi et al. 2018; Pike and Lintner 2020; Chattopadhyay et al. 2020) and robotics (Khouja and Booth 1995; Zhang et al. 2013). In Table 6 below we briefly discuss a few applications as indicated by Saxena et al. (2017) and also provide references for more detailed studies.
3.2 Selected industry applications
The application fields or areas of clustering described above have been noted to be in general areas of application that possibly cut across through different industrial and business sectors. Clustering techniques have also found extensive application in certain industries. As indicated by Dalziel et al. (2018) different firms with similar buy-sell characteristics could be grouped under the same industry. Clustering has been used partly as a stand-alone analytical technique and largely as a hybrid technique with other analytical methods to solve industrial problems. According to Jakupović et al. (2010), Dalziel et al. (2018), (Grant and Yeo 2018), (Xu et al. 2020) and (Ezugwu et al. 2022) several business or industrial sectors exist. They further noted that a unique or universal classification of industries or business sectors is difficult due to the reason that industries or sectors are mostly classified based on the specific needs of the classifier.
According to Citizenship (2016), ten (10) industrial sectors of impact on the SDGs were identified namely Consumer goods, Industrials, Oil and Gas, Healthcare, Basic Materials, Utilities, Telecomms, Financials, Consumer Services and Technology. In addition, the industrial sectors were organised into three namely; the primary sector (raw material extraction and production), Secondary (production of goods from raw materials) and Tertiary (provision of services). These industries have also been noted to have strong linkages to either one or more SDGs. For example, Healthcare strongly impacts SDG3 which is to achieve good health and well-being for all, while Oil and gas are strongly linked to SDG 7 (affordable and clean energy). Consumer goods, industrials and consumer services impact across SDG12 (responsible consumption and production), SDG2 (achieving Zero hunger) and SG14 (on the protection of the marine environment). Furthermore, the Utilities sector is known for infrastructure provision impacts across SDG 6 (clean water and sanitation), SDG7 and SDG9 (decent work and employment). Others such as SDG 1 (poverty), SDG4 (education), and SDG 5(gender equality) have been known to be of low impact on a particular sector and receive supporting actions from the earlier discussed industrial/business sectors.
As several clustering techniques have been extensively reported in the literature, chances also exist of a corresponding application of clustering techniques in several identified industries/sectors. Using the SDG classifications indicated above, we select sectors important in driving most of the SDGs. These sectors are mostly grouped under Transportation and logistics (such as consumer services), Manufacturing (such as Industrials, basic materials, consumer goods), Energy (such as Oil and Gas, Utilities) and Healthcare. In addition, the selected industries positively impact or stimulate economic growth, innovation, development gaps and well being for a typical economy (Nhamo et al. 2020; Shi 2020; Abbaspour and Abbasizade 2020).
3.2.1 Transportation and logistics
The application of clustering in the transportation industry has been generally noted to be in the identification of similar patterns in various modes of transportation (Almannaa et al. 2020). Some fields under the transportation sector, where clustering application has been applied have been hazardous transportation, road transportation urban/public transportation (De Luca et al. 2011; Lu et al. 2013; Rabbani et al. 2017; Sfyridis and Agnolucci 2020; Almannaa et al. 2020). Recently, Wang and Wang (2020) discussed the application of genetic fuzzy C-means algorithm and factor analysis to identify the causes and control high-risk drivers. (de Armiño et al. 2020) combined the hierarchical clustering and neural networks to develop a linkage between road transportation data and macroeconomic indicators. Almannaa et al. (2020) developed a multi-objective clustering that can maximize purity and similarity in each cluster formed simultaneously. They also noted that the convergence speed of the multi-objective clustering method was fast, and the number of clusters obtained was stable to determine traffic and bike pattern change within clusters.
3.2.2 Manufacturing
Similarly to clustering applications in the transportation sector, the manufacturing sector and systems such as discussed by Delgoshaei and Gomes (2016), Delgoshaei et al. (2021) also possess a wide application of clustering techniques. The applications are mostly a hybrid method with other analytical methods. Using the case study of the textile manufacturing business, Li et al. (2011) used clustering analysis to classify customers based on selected customer characteristics and further used some cross-analysis for customer behavior tendencies. Chandrasekharan and Rajagopalan (1986) adopted k-means in a group technology problem following which the initial grou**s obtained were improved. There has been a recent trend of application of clustering techniques in cloud manufacturing, cyber manufacturing, smart manufacturing, manufacturing systems and cellular manufacturing. Delgoshaei and Ali (2019) reviewed hybrid clustering methods and search algorithms such as metaheuristics in the designing of cellular manufacturing systems. Liu and Chen (2019) used the k-medoids clustering-based algorithm and trust-aware approach to predict the quality-of-service records which might become intractable under cloud manufacturing. An improved k-mean clustering technique was compared to a k-means random by Yin (2020). The comparison was done to determine which method could provide an optimal number of edge computing nodes in a smart manufacturing setup. Sabbagh and Ameri (2020) demonstrated the application of unsupervised learning in text analytics. They used the k-means clustering and topic modelling techniques to build a cluster of supplier capabilities topics. Subramaniyan et al. (2020) clustered time-series bottle-neck data using dynamic time wrap** and complete-linkage agglomerative hierarchical clustering technique for determining bottlenecks in manufacturing systems. Ahn and Chang (2019) discussed business process management for manufacturing models. They used agglomerative hierarchical clustering in the design and management of manufacturing processes. A hybrid dynamic clustering and other techniques for establishing similarities in 3D geometry of parts and printing processes were investigated by Chan et al. (2018).
3.2.3 Energy
Clustering techniques have also been widely used in the field of energy both in isolation and in combination with other analytical techniques. Some fields under energy where clustering applications that have been used include energy efficiency, renewable energy, electricity consumption, heating and cooling, nuclear energy, and smart metering. The k-means clustering technique and its variants have mostly been used in the energy sector clustering. Vialetto and Noro (2020) used the k-means clustering, silhouette method to define the number of clusters while clustering energy demand data. They used clustering in the design of cogeneration systems to allow energy-cost savings. Wang and Yang (2020) used fuzzy clustering and an accelerated genetic algorithm to analyze and assess sustainable and influencing factors for 27 European Union countries' renewable energy. Fuzzy C means and multi-criteria decision-making process were applied by (Tran 2020) to design the optimal loading of ships and diesel fuel consumption of marine ships. Tanoto et al. (2020) applied a hybrid of k-means clustering, neural network based-self organizing map to group technology mixes with similar patterns. Their method was designed for the energy modelling community for the understanding of complex design choices for electricity industry planning. Suh et al. (2020) applied text mining in nuclear energy. Clustering analysis and technology network analysis were used to identify topics in nuclear waste management over time. Shamim and Rihan (2020) compared using k-means clustering and k-means clustering with feature extraction in smart metering electricity. Results of their experiments showed that clustering using features from raw data obtained better performance than direct raw data.
3.2.4 Healthcare
The healthcare industry has been described as one that can generate a vast amount of data from diverse clinical procedures and sources in which clustering techniques are found useful (Palanisamy and Thirunavukarasu 2019; Ambigavathi and Sridharan 2020). According to Jothi and Nur’Aini Abdul Rashidb (2015), Manogaran and Lopez (2017), Palanisamy and Thirunavukarasu (2019) and Shafqat et al. (2020) some heterogeneous data sources in the healthcare industry include electronic health records, medical imaging, genetic data, clinical diagnosis, metabolomics, proteomics and long-term psychological sensing of an individual.
Clustering techniques have been useful in the healthcare industry as part of data mining techniques for the identification of patterns in healthcare data sets (Jothi and Nur’Aini Abdul Rashidb 2015; Ahmad et al. 2015; Ogundele et al. 2018). As described by Ogundele et al. (2018) data mining is the field of study that seeks to find useful and meaningful information from large data. This definition makes data mining techniques such as clustering relevant in the health care industry. Ahmad et al. (2015) showed with examples that clustering algorithms could be used as a stand-alone technique or as a hybrid with other analytical techniques in understanding healthcare datasets. The use of clustering algorithms such as k-means, k-medoids, and x-means has been used to diagnose several diseases such as breast cancers, heart problems, diabetes, and seizures (Ahmad et al. 2015; Alsayat and El-Sayed 2016; Kao et al. 2017; Ogundele et al. 2018; Shafqat et al. 2020). To understand patterns in the automatically-collected event in healthcare settings, patient flow and clinical setting conformance, Johns et al. (2020) discussed the use of trace clustering. Density-based clustering has also been applied to obtain useful patterns from biomedical data (Ahmad et al. 2015). Hybrid techniques for analyzing and predicting health issues such as the use of clustering algorithms and classification trees, the use of k-means and statistical analysis and hybrid hierarchical clustering were discussed by (Ahmad et al. 2015).
Yoo et al. (2012), Jothi and Nur’Aini Abdul Rashidb (2015) and Ogundele et al. (2018) indicated that clustering techniques (unsupervised learning) form the descriptive components of data mining techniques. In addition, Jothi and Nur’Aini Abdul Rashidb (2015), noted that clustering techniques are not as utilized as the prescriptive (Supervised) components of data mining techniques. Ahmad et al. (2015) however pointed out that a combination of different data mining techniques should be used to achieve better disease prediction, clinical monitoring, and general healthcare improvement in the healthcare industry.
Figure 4 below summarizes the general application of clustering techniques based on the identified industries above.
General application of clustering techniques
4 Data size, dimensionality, and data type issues in clustering
One of the approaches earlier listed for classifying clustering algorithms is the type of input data. Liao (2005) observes that the data that can be inputted into any clustering task can be classified as binary, categorical, numerical, interval, ordinal, relational, textual, spatial, temporal, spatio-temporal, image, multimedia, or mixtures of the above data types. This classification can also be sub-classified. For example, numeric raw data for clustering can either be static, time series or as a data stream. Static data do not change with time while time-series data have their data objects changing with time. Aggarwal et al. (2003) described data stream as large volumes of data arriving at an unlimited growth rate. As noted by Mahdi et al. (2021) data types that are vast and complex to store such as social network data (referred to as big data) and high-speed data (data stream) such as web-click streams, network traffic could be challenging to cluster. In addition, they emphasized that the type of data type considered often influences the type of clustering techniques selected.
The application of some clustering algorithms directly to raw data has been noted to be an issue as the data size becomes larger (Gordon 1999; Parsons et al. 2004). Two reasons were given for this observed problem. The first reason indicated was based on the type of clustering algorithm used. This is such that some clustering algorithms fully take into consideration all dimensions of the data during the clustering process. As a result, they conceal potential clusters of outlying data objects. The second was because, as dimensionality increases in the given data, the distance measure for computing similarity or dissimilarity among data objects becomes less effective. Feature extraction and selection were suggested as a generic method to solve this problem by reducing the dimensionality of the data before the clustering algorithms are applied. However, they noted that this feature-based method could omit certain clusters hidden in subspaces of the data sets. Subspace clustering was the method suggested to overcome this.
Research in the field of reducing the dimensionality of the original data through feature extraction and selection methods and variants such as subspace clustering has continued to be investigated by several authors (Huang et al. 1999; Rodriguez et al. 2019) and the limitation of clustering algorithms is a strong motivation for the emergence of new clustering algorithms or variants of the traditional clustering algorithms. As new clustering algorithms emerge, it is expected that existing terminologies and classification approaches could become broader with a seeming departure from the traditional approaches. With the growing number of clustering algorithms is also the growing number of clustering validation indices. This perhaps is due to the reason that users of clustering results are more interested in knowing with good confidence that clustering results obtained are well suited for the application. To test the suitability of different clustering algorithms and indices in meeting the users' needs and also due to the increase in computing technological capabilities, clustering algorithms and indices are being combined in computer programs. Rodriguez et al. (2019) presented a comparative study of 9 clustering algorithms available in the R programming language. Other authors such as Sekula (2015) have indicated some clustering packages in the R-programming language that can be useful for comparison and as a friendly user application. Besides, computer programs are used to suggest a suitable number of clusters for clustering algorithms (e.g. k-means) requiring an input of clusters as applied by (Rhodes et al. 2014; Charrad et al. 2015).
In Sect. 3, we considered that the application of clustering has largely been reported in areas such as image segmentation, object recognition, character recognition, information retrieval, and data mining. We have considered these areas to be specific applications of clustering algorithms. It is expected that more field applications will be reported due to the vast applicability of clustering techniques. Also emphasized is the application of clustering in selected industrial sectors. We specifically noted the diverse classification schemes and grou**s of industrial sectors. The numerous clustering algorithms in existence have the corresponding possible applicability in several of these industries. We, however, selected manufacturing, energy, transportation and logistics, and healthcare as examples to illustrate the application of clustering in industries with important links to achieving sustainable development goals. The application of clustering techniques in these industries appears to be a move from a stand-alone analytical technique into hybrid techniques with other analytical processes. This suggests that clustering techniques will continue to be relevant as an integrated analytical technique in different industries and sectors. Besides, the vast application of clustering techniques will imply practitioners or users with a basic understanding of clustering techniques can use the clustering algorithm embedded into the software with little difficulty.
In Sect. 4, we highlighted some data sources used in clustering and discussed some data issues users of clustering techniques are likely to deal with. Clustering raw data inputs are generally observed to be more problematic than refined data inputs. This is attributable to the dimensionality problem. Due to the increase in computing technology for many industrial applications and cloud computing, the use of clustering techniques to analyze high volumes of static, time-series, multi-sources, and multimodal data are trends in the future. For multi-sources and multimodal data, applications or frameworks that can effectively integrate or fuse the complementary attributes of such data are currently observable trends. As such clustering techniques will be more readily deployed in such secondary data-use domain.
As the size of data becomes larger due to modern data mining capabilities and the need to avoid incomplete knowledge extraction from single sources or modes of data, methods that fuse complementary and diverse data with a goal of understanding and identifying hidden clusters are also notable trends. For example, deep learning methods are sometimes merged with traditional clustering methods to further search for underlying clusters and thereby improve clustering performance.
Putting the main observations in this paper together, the emergence of new clustering algorithms is expected due to the subjectivity nature of clustering and its vast applicability in diverse fields and industries. This suggests that emerging scholars can find meaningful research interest in several aspects of data clustering such as the development of new clustering algorithms, validity indices, improving clustering quality and comprehensive field and industry reviews of clustering techniques. Industry Practitioners will also find use in the application of specific clustering algorithms to analyze unlabeled data to extract meaningful information.
6 Conclusion and future directions
In this paper, we presented a basic definition and description of clustering components. We extended existing criteria in the literature for classifying clustering algorithms. Both traditional clustering algorithms and emerging variants were discussed. Also emphasized is the reality that clustering algorithms could produce different grou**s for a given set of data. Also, as no clustering algorithm can solve all clustering problems, several clustering validation indices are used and have also been developed to gain some confidence in the cluster results obtained from clustering algorithms.
We summarized field applications of clustering algorithms such as in image segmentation, object recognition, character recognition, data mining and social networking that have been pointed out in the literature. Selected applications of clustering techniques and notable trends in industrial sectors with strong links to achieving sustainable development goals were further presented to show the diverse application of clustering techniques. Also suggested are possible application trends in the field of clustering that are observable from both specific and general article reviews in the literature. Some data input concerns in the field of clustering were examined.
This study presents a foundation for other research work that can be projected from it. Firstly, the investigation into feature extraction, selection, alignment, and other methods that could reveal hidden clusters in large volumes, high-frequency data such as data streams, multi-modal and multi-source data obtainable from current data mining capabilities, technologies and computer simulations are current and research interest into the future for the academia and industry.
In addition, the development of new clustering strategies to analyze existing and modern data types (e.g., fused multi-source and multi-modal data) would also be of more interest to researchers. The outputs and knowledge extracted from such data types could be beneficial to policymakers and business practitioners in informed decision making.
Secondly, the use of clustering techniques has a high possibility of finding more applicability in existing fields. Examples are text mining, industrial big data applications, biomedicals, commercial sectors, military applications, space navigation and biological processes. In emerging areas of applications such as Learning management systems and social media that currently churn out huge amounts of data and have recently seen a further increase due to the covid-19 pandemic, the development of effective and efficient clustering algorithms to sufficiently mine the massive amount of data from such fields are currently being projected. Deep clustering will generally find more applications in analysis useful across different business sectors where pure clustering methods have been used. This will be due to observed performance in obtaining better clustering results for example in image classification where the Feedforward convolutional network has been very useful.
Finally, a data clustering trend that summarizes trends from qualitative and quantitative results of the application of diverse variants of clustering strategies will adequately be an improvement on this research efforts.
Data availability
Data sharing not applicable to this article as no datasets were generated or analysed during the current study.
References
Abbaspour M, Abbasizade F (2020) Energy performance evaluation based on SDGs. In: Leal Filho W, Azul AM, Brandli L, Lange Salvia A, Wall T (eds) Affordable and clean energy. Springer, Cham
Afyouni I, Al Aghbari Z, Razack RA (2021) Multi-feature, multi-modal, and multi-source social event detection: a comprehensive survey. Inf Fusion. https://doi.org/10.1016/j.inffus.2021.10.013
Aggarwal CC, Philip SY, Han J, Wang J (2003) A framework for clustering evolving data streams. In: Proceedings 2003 VLDB conference, Elsevier, pp 81–92
Ahmad P, Qamar S, Rizvi SQA (2015) Techniques of data mining in healthcare: a review. Int J Comput Appl 120:38–50
Ahn H, Chang T-W (2019) A similarity-based hierarchical clustering method for manufacturing process models. Sustainability 11:2560
Alelyani S, Tang J, Liu H (2013) Feature selection for clustering: a review. In: Data clustering: algorithms and applications. Chapman and Hal, London, p 29
Aljalbout E, Golkov V, Siddiqui Y, Strobel M, Cremers D (2018) Clustering with deep learning: taxonomy and new methods. ar**v preprint ar**v:1801.07648
Almannaa MH, Elhenawy M, Rakha HA (2020) A novel supervised clustering algorithm for transportation system applications. IEEE Trans Intell Transp Syst 21:222–232
Alsayat A, El-Sayed H (2016) Efficient genetic K-means clustering for health care knowledge discovery. In: 2016 IEEE 14th international conference on software engineering research, management and applications (SERA), IEEE, pp 45–52
Ambigavathi M, Sridharan D (2020) Analysis of clustering algorithms in machine learning for healthcare data. In: International conference on advances in computing and data sciences, Springer, Singapore, pp 117–128
Anand S, Padmanabham P, Govardhan A, Kulkarni RH (2018) An extensive review on data mining methods and clustering models for intelligent transportation system. J Intell Syst 27:263–273
Andreopoulos B, An A, Wang X, Schroeder M (2009) A roadmap of clustering algorithms: finding a match for a biomedical application. Brief Bioinform 10:297–314
Ansari MY, Ahmad A, Khan SS, Bhushan G (2019) Spatiotemporal clustering: a review. Artif Intell Rev 53:2381–2423
Baadel S, Thabtah FA, Lu J (2016) Overlap** clustering: a review. In 2016 SAI Computing Conference (SAI),IEEE., pp. 233-237.
Baidari I, Patil C (2020) A criterion for deciding the number of clusters in a dataset based on data depth. Vietnam J Comput Sci 7:417–431
Baker R (2010) Data mining for education. Int Encycl Educ 7:112–118
Bandyopadhyay S, Saha S, Maulik U, Deb K (2008) A simulated annealing-based multiobjective optimization algorithm: AMOSA. IEEE Trans Evol Comput 12:269–283
Banerjee A, Krumpelman C, Ghosh J, Basu S, Mooney RJ (2005) Model-based overlap** clustering. In: Proceedings of the eleventh ACM SIGKDD international conference on knowledge discovery in data mining, pp 532–537
Batet M, Valls A, Gibert K (2010) Performance of ontology-based semantic similarities in clustering. In: International conference on artificial intelligence and soft computing. Springer, Berlin, pp 281–288
Beltrán B, Vilariño D (2020) Survey of overlap** clustering algorithms. Comput Sist 24:575–581
Bose I, Chen X (2015) Detecting the migration of mobile service customers using fuzzy clustering. Inf Manage 52:227–238
Bouveyron C, Brunet-Saumard C (2014) Model-based clustering of high-dimensional data: a review. Comput Stat Data Anal 71:52–78
Bulò SR, Pelillo M (2017) Dominant-set clustering: a review. Eur J Oper Res 262:1–13
Calmon W, Albi M (2020) Estimating the number of clusters in a ranking data context. Inf Sci 546:977–995
Campello RJ, Kröger P, Sander J, Zimek A (2020) Density-based clustering. Wiley Interdiscip Rev: Data Min Knowl Discov 10:e1343
Celardo L, Everett MG (2020) Network text analysis: a two-way classification approach. Int J Inf Manage 51:102009
Chan LM, Intner SS, Weihs J (2016) Guide to the library of congress classification. ABC-CLIO, Santa Barbara
Chan SL, Lu Y, Wang Y (2018) Data-driven cost estimation for additive manufacturing in cybermanufacturing. J Manuf Syst 46:115–126
Chandrasekharan MP, Rajagopalan R (1986) An ideal seed non-hierarchical clustering algorithm for cellular manufacturing. Int J Prod Res 24:451–463
Charrad M, Ghazzali N, Boiteau V, Niknafs A (2015) Determining the best number of clusters in a data set. Recuperado de https://cran.rproject.org/web/packages/NbClust/NbClust.pdf
Chattopadhyay A, Hassanzadeh P, Pasha S (2020) Predicting clustered weather patterns: a test case for applications of convolutional neural networks to spatio-temporal climate data. Sci Rep 10:1–13
Chen H, Yu Z, Yang Q, Shao J (2020) Attributed graph clustering with subspace stochastic block model. Inf Sci 535:130–141
Cheng H, Hong SA, Ye X (2020) Clustering users of a social networking system based on user interactions with content items associated with a topic. Google Patents
Citizenship C (2016) SDGs & sectors: a review of the business opportunities. Corporate Citizenship, London
Connell SD, Jain AK (1998) Learning prototypes for online handwritten digits. In: Proceedings. Fourteenth international conference on pattern recognition (cat. no. 98EX170), IEEE, pp 182–184
D’haeseleer P (2005) How does gene expression clustering work? Nat Biotechnol 23:1499–1501
Dalziel M, Yang X, Breslav S, Khan A, Luo J (2018) Can we design an industry classification system that reflects industry architecture? J Enterp Transform 8:22–46
Das S, Das A, Bhattacharya D, Tibarewala D (2020) A new graph-theoretic approach to determine the similarity of genome sequences based on nucleotide triplets. Genomics. https://doi.org/10.1016/j.ygeno.2020.08.023
de Armiño CA, Manzanedo MÁ, Herrero Á (2020) Analysing the intermeshed patterns of road transportation and macroeconomic indicators through neural and clustering techniques. Pattern Anal Appl 23:1059–1070
de Luca M, Mauro R, Russo F, Dell’Acqua G (2011) Before-after freeway accident analysis using cluster algorithms. Procedia Soc Behav Sci 20:723–731
Delgoshaei A, Ali A (2019) Evolution of clustering techniques in designing cellular manufacturing systems: a state-of-art review. Int J Ind Eng Comput 10:177–198
Delgoshaei A, Gomes C (2016) A multi-layer perceptron for scheduling cellular manufacturing systems in the presence of unreliable machines and uncertain cost. Appl Soft Comput 49:27–55
Delgoshaei A, Aram AK, Ehsani S, Rezanoori A, Hanjani SE, Pakdel GH, Shirmohamdi F (2021) A supervised method for scheduling multi-objective job shop systems in the presence of market uncertainties. RAIRO-Oper Res 55:S1165–S1193
Denoeux T (2020) Calibrated model-based evidential clustering using bootstrap**. Inf Sci. https://doi.org/10.1016/j.ins.2020.04.014
Denoeux T, Kanjanatarakul O (2016) Evidential clustering: a review. In International symposium on integrated uncertainty in knowledge modelling and decision making, Springer, Cham, pp. 24-35
Devolder P, Pynoo B, Sijnave B, Voet T, Duyck P (2012) Framework for user acceptance: clustering for fine-grained results. Inf Manage 49:233–239
Dorai C, Jain AK (1995) Shape spectra based view grou** for free-form objects. In: Proceedings. International conference on image processing, IEEE, pp 340–343
Du T, Wen G, Cai Z, Zheng W, Tan M, Li Y (2020) Spectral clustering algorithm combining local covariance matrix with normalization. Neural Comput Appl 32:6611–6618
Durbin R, Eddy SR, Krogh A, Mitchison G (1998) Biological sequence analysis: probabilistic models of proteins and nucleic acids. Cambridge University Press, Cambridge
Ezugwu AE, Ikotun AM, Oyelade OO, Abualigah L, Agushaka JO, Eke CI, Akinyelu AA (2022) A comprehensive survey of clustering algorithms: state-of-the-art machine learning applications, taxonomy, challenges, and future research prospects. Eng Appl Artif Intell 110:104743
Fennell G, Allenby GM, Yang S, Edwards Y (2003) The effectiveness of demographic and psychographic variables for explaining brand and product category use. Quant Mark Econ 1:223–244
Forsyth DA, Ponce J (2002) Computer vision: a modern approach In: Prentice Hall professional technical reference
Fu W, Perry PO (2020) Estimating the number of clusters using cross-validation. J Comput Graph Stat 29:162–173
Gordon AD (1999) Classification. CRC Press, Boca Raton
Govender P, Sivakumar V (2020) Application of k-means and hierarchical clustering techniques for analysis of air pollution: a review (1980–2019). Atmos Pollut Res 11:40–56
Grant D, Yeo B (2018) A global perspective on tech investment, financing, and ICT on manufacturing and service industry performance. Int J Inf Manage 43:130–145
Guleria P, Sood M (2020) Intelligent data analysis using Hadoop cluster-inspired mapreduce framework and association rule mining on educational domain. In: Intelligent data analysis: from data gathering to data comprehension. Wiley, Hoboken
Han J, Pei J, Kamber M (2011) Data mining: concepts and techniques. Elsevier, Amsterdam
Han J, Kamber M, Pei J (2012) 10-Cluster analysis: Basic concepts and methods. Data mining. Morgan Kaufmann, Burlington, pp 443–495
Hastie T, Tibshirani R, Friedman JH, Friedman JH (2009) The elements of statistical learning: data mining, inference, and prediction. Springer, New York
He Y, Wu Y, Qin H, Huang JZ, ** Y (2020) Improved I-nice clustering algorithm based on density peaks mechanism. Inf Sci 548:177–190
Hedberg SR (1996) Searching for the mother lode: tales of the first data miners. IEEE Expert 11:4–7
Hireche C, Drias H, Moulai H (2020) Grid based clustering for satisfiability solving. Appl Soft Comput 88:106069
Hu W, Hu W, **e N, Maybank S (2009) Unsupervised active learning based on hierarchical graph-theoretic clustering. IEEE Trans Syst Man Cybern B 39:1147–1161
Hu J, Pan Y, Li T, Yang Y (2020) TW-Co-MFC: two-level weighted collaborative fuzzy clustering based on maximum entropy for multi-view data. Tsinghua Sci Technol 26:185–198
Huang Z (1997) A fast clustering algorithm to cluster very large categorical data sets in data mining. DMKD 3:34–39
Huang X, Ye Y, **ong L, Lau RY, Jiang N, Wang S (2016) Time series k-means: a new k-means type smooth subspace clustering for time series data. Inf Sci 367:1–13
Hudson IL, Keatley MR, Lee SY (2011) Using self-organising maps (SOMs) to assess synchronies: an application to historical eucalypt flowering records. Int J Biometeorol 55:879–904
Izadkhah H, Tajgardan M (2019) Information theoretic objective function for genetic software clustering. Multidiscip Digit Publ Inst Proc 46:18
Jain AK, Murty MN, Flynn PJ (1999) Data clustering: a review. ACM Comput Surv (CSUR) 31:264–323
Jakupović A, Pavlić M, Poščić P (2010) Business sectors and ERP solutions. In: Proceedings of the ITI 2010, 32nd international conference on information technology interfaces, IEEE, pp 477–482
Jamali-Dinan S-S, Soltanian-Zadeh H, Bowyer SM, Almohri H, Dehghani H, Elisevich K, Nazem-Zadeh M-R (2020) A combination of particle swarm optimization and minkowski weighted k-means clustering: application in lateralization of temporal lobe epilepsy. Brain Topogr. https://doi.org/10.1007/s10548-020-00770-9
James G, Witten D, Hastie T, Tibshirani R (2015) An introduction to statistical learning with applications in R. Springer, New York
Jiang D, Wu S, Chen G, Ooi BC, Tan K-L, Xu J (2016) epiC: an extensible and scalable system for processing big data. VLDB J 25:3–26
Johnell C, Chehreghani MH (2020) Frank-wolfe optimization for dominant set clustering. ar**v preprint ar**v:2007.11652
Johns H, Hearne J, Bernhardt J, Churilov L (2020) Clustering clinical and health care processes using a novel measure of dissimilarity for variable-length sequences of ordinal states. Stat Methods Med Res 29:3059–3075
Jothi N, Nur’aini Abdul Rashidb WH (2015) Data mining in healthcare—a review. Procedia Comput Sci 72:306–313
Kalgotra P, Sharda R, Luse A (2020) Which similarity measure to use in network analysis: Impact of sample size on phi correlation coefficient and Ochiai index. Int J Inf Manage 55:102229
Kao J-H, Chan T-C, Lai F, Lin B-C, Sun W-Z, Chang K-W, Leu F-Y, Lin J-W (2017) Spatial analysis and data mining techniques for identifying risk factors of out-of-hospital cardiac arrest. Int J Inf Manage 37:1528–1538
Kaplan JM, Winther RG (2013) Prisoners of abstraction? The theory and measure of genetic variation, and the very concept of “race.” Biol Theory 7:401–412
Kessira D, Kechadi M-T (2020) Multi-objective clustering algorithm with parallel games. In: 2020 international multi-conference on:“organization of knowledge and advanced technologies”(OCTA), IEEE, pp 1–7
Khamparia A, Pande S, Gupta D, Khanna A, Sangaiah AK (2020) Multi-level framework for anomaly detection in social networking. Libr Hi Tech. https://doi.org/10.1108/LHT-01-2019-0023
Khanmohammadi S, Adibeig N, Shanehbandy S (2017) An improved overlap** k-means clustering method for medical applications. Expert Syst Appl 67:12–18
Khouja M, Booth DE (1995) Fuzzy clustering procedure for evaluation and selection of industrial robots. J Manuf Syst 14:244–251
Kiang MY, Hu MY, Fisher DM (2007) The effect of sample size on the extended self-organizing map network—a market segmentation application. Comput Stat Data Anal 51:5940–5948
Kohli S, Mehrotra S (2016) A clustering approach for optimization of search result. J Images Graph 4:63–66
Lahat D, Adali T, Jutten C (2015) Multimodal data fusion: an overview of methods, challenges, and prospects. Proc IEEE 103:1449–1477
Lam D, Wunsch DC (2014) Clustering. In: Academic Press library in signal processing. Elsevier, Amsterdam
Landau S, Leese M, Stahl D, Everitt BS (2011) Cluster analysis. Wiley, Hoboken
Lee Y-H, Hu PJ-H, Zhu H, Chen H-W (2020) Discovering event episodes from sequences of online news articles: a time-adjoining frequent itemset-based clustering method. Inf Manage 57:103348
Lelieveld SH, Wiel L, Venselaar H, Pfundt R, Vriend G, Veltman JA, Brunner HG, Vissers LE, Gilissen C (2017) Spatial clustering of de novo missense mutations identifies candidate neurodevelopmental disorder-associated genes. Am J Human Genet 101:478–484
Li J, Wang Q (2021) Multi-modal bioelectrical signal fusion analysis based on different acquisition devices and scene settings: overview, challenges, and novel orientation. Inf Fusion 79:229–247
Li D-C, Dai W-L, Tseng W-T (2011) A two-stage clustering method to analyze customer characteristics to build discriminative customer management: a case of textile manufacturing business. Expert Syst Appl 38:7186–7191
Li W, Fu L, Niu B, Wu S, Wooley J (2012) Ultrafast clustering algorithms for metagenomic sequence analysis. Brief Bioinform 13:656–668
Li Q, Wang S, Zhao C, Zhao B, Yue X, Geng J (2020a) HIBOG: improving the clustering accuracy by ameliorating dataset with gravitation. Inf Sci 550:41–56
Li X, Liang W, Zhang X, Qing S, Chang P-C (2020b) A cluster validity evaluation method for dynamically determining the near-optimal number of clusters. Soft Comput 24:9227–9241
Liao TW (2005) Clustering of time series data—a survey. Pattern Recogn 38:1857–1874
Lismont J, Vanthienen J, Baesens B, Lemahieu W (2017) Defining analytics maturity indicators: a survey approach. Int J Inf Manage 37:114–124
Liu J, Chen Y (2019) A personalized clustering-based and reliable trust-aware QoS prediction approach for cloud service recommendation in cloud manufacturing. Knowl-Based Syst 174:43–56
Liu Y, Li Z, **ong H, Gao X, Wu J (2010) Understanding of internal clustering validation measures. In: 2010 IEEE international conference on data mining, IEEE, pp 911–916
Liu Y, Jiang Y, Hou T, Liu F (2020) A new robust fuzzy clustering validity index for imbalanced data sets. Inf Sci 547:579–591
Lu J, Gan A, Haleem K, Wu W (2013) Clustering-based roadway segment division for the identification of high-crash locations. J Transp Saf Secur 5:224–239
Mahdi MA, Hosny KM, Elhenawy I (2021) Scalable clustering algorithms for big data: a review. IEEE Access. https://doi.org/10.1109/ACCESS.2021.3084057
Manogaran G, Lopez D (2017) A survey of big data architectures and machine learning algorithms in healthcare. Int J Biomed Eng Technol 25:182–211
Marbac M, Sedki M, Patin T (2019) Variable selection for mixed data clustering: application in human population genomics. J Classif 37:124–142
Masson M-H, Denoeux T (2008) ECM: an evidential version of the fuzzy c-means algorithm. Pattern Recogn 41:1384–1397
Matula DW (1977) Graph theoretic techniques for cluster analysis algorithms. In: Classification and clustering. Elsevier, Amsterdam
Mehrotra S, Kohli S (2016) Application of clustering for improving search result of a website. In: Information systems design and intelligent applications. Springer, New Delhi
Min E, Guo X, Liu Q, Zhang G, Cui J, Long J (2018) A survey of clustering with deep learning: from the perspective of network architecture. IEEE Access 6:39501–39514
Motiwalla LF, Albashrawi M, Kartal HB (2019) Uncovering unobserved heterogeneity bias: measuring mobile banking system success. Int J Inf Manage 49:439–451
Motlagh O, Berry A, O’Neil L (2019) Clustering of residential electricity customers using load time series. Appl Energy 237:11–24
Mourer A, Forest F, Lebbah M, Azzag H, Lacaille J (2020) Selecting the number of clusters $ K $ with a stability trade-off: an internal validation criterion. ar** partitional clustering methods. In: Partitional clustering algorithms. Springer, Cham
Naghieh E, Peng Y (2009) Microarray gene expression data mining: clustering analysis review. Department of Computing, pp.1-4.
Nakayama H, Kagaku N (1998) Pattern classification by linear goal programming and its extensions. J Global Optim 12:111–126
Negara ES, Andryani R (2018) A review on overlap** and non-overlap** community detection algorithms for social network analytics. Far East Journal of Electronics and Communications, 18(1), pp.1-27.
Nerurkar P, Shirke A, Chandane M, Bhirud S (2018) Empirical analysis of data clustering algorithms. Procedia Comput Sci 125:770–779
Ng AY, Jordan MI, Weiss Y (2002) On spectral clustering: analysis and an algorithm. In: Advances in neural information processing systems. MIT Press, Boston, pp 849–856
Nhamo G, Nhemachena C, Nhamo S (2020) Using ICT indicators to measure readiness of countries to implement Industry 4.0 and the SDGs. Environ Econ Policy Stud 22:315–337
Ni J, Young T, Pandelea V, Xue F, Cambria E (2022) Recent advances in deep learning based dialogue systems: a systematic survey. In: Artificial intelligence review, pp 1–101
Niwattanakul S, Singthongchai J, Naenudorn E, Wanapu S (2013) Using of Jaccard coefficient for keywords similarity. In: Proceedings of the international multiconference of engineers and computer scientists, pp 380–384
Ogundele I, Popoola O, Oyesola O, Orija K (2018) A review on data mining in healthcare. International Journal of Advanced Research in Computer Engineering and Technology (IJARCET), Vol.7, pp 698–704
Page MJ, McKenzie JE, Bossuyt PM, Boutron I, Hoffmann TC, Mulrow CD, Shamseer L, Tetzlaff JM, Akl EA, Brennan SE (2021) The PRISMA 2020 statement: an updated guideline for reporting systematic reviews. Int J Surg 88:105906
Palanisamy V, Thirunavukarasu R (2019) Implications of big data analytics in develo** healthcare frameworks–a review. J King Saud Univ-Comput Inf Sci 31:415–425
Pandit S, Gupta S (2011) A comparative study on distance measuring approaches for clustering. Int J Res Comput Sci 2:29–31
Parsons L, Haque E, Liu H (2004) Subspace clustering for high dimensional data: a review. Dimension 1(1):5
Pedrycz W (2002) Collaborative fuzzy clustering. Pattern Recogn Lett 23:1675–1686
Pereira MM, Frazzon EM (2020) A data-driven approach to adaptive synchronization of demand and supply in omni-channel retail supply chains. Int J Inf Manage 57:102165
Pérez-Suárez A, Martínez-Trinidad JF, Carrasco-Ochoa JA (2019) A review of conceptual clustering algorithms. Artif Intell Rev 52:1267–1296
Petwal S, John KS, Vikas G, Rawat SS (2020) Recommender system for analyzing students’ performance using data mining technique. In: Data science and security. Springer, Singapore
Piernik M, Brzezinski D, Morzy T, Lesniewska A (2015) XML clustering: a review of structural approaches. Knowl Eng Rev 30:297–323
Pike M, Lintner BR (2020) Application of clustering algorithms to TRMM precipitation over the tropical and south Pacific Ocean. J Clim 33:5767–5785
Qian G, Sural S, Gu Y, Pramanik S (2004) Similarity between Euclidean and cosine angle distance for nearest neighbor queries. In: Proceedings of the 2004 ACM symposium on applied computing, 1232–1237
Rabbani M, Farrokhi-Asl H, Asgarian B (2017) Solving a bi-objective location routing problem by a NSGA-II combined with clustering approach: application in waste collection problem. J Ind Eng Int 13:13–27
Rai A, Tang X, Brown P, Keil M (2006) Assimilation patterns in the use of electronic procurement innovations: a cluster analysis. Inf Manage 43:336–349
Ramadan RA, Alhaisoni MM, Khedr AY (2020) Multiobjective clustering algorithm for complex data in learning management systems. Complex Adapt Syst Model 8:1–14
Rappoport N, Shamir R (2018) Multi-omic and multi-view clustering algorithms: review and cancer benchmark. bioRxiv. https://doi.org/10.1093/nar/gky889
Rasmussen EM (1992) Clustering algorithms. Inf Retr: Data Struct Algorithms 419:442
Rathee A, Chhabra JK (2018) Clustering for software remodularization by using structural, conceptual and evolutionary features. J Univers Comput Sci 24:1731–1757
Ray S, Turi RH (1999) Determination of number of clusters in k-means clustering and application in colour image segmentation. In: Proceedings of the 4th international conference on advances in pattern recognition and digital techniques, Calcutta, India, pp 137–143
Rhodes JD, Cole WJ, Upshaw CR, Edgar TF, Webber ME (2014) Clustering analysis of residential electricity demand profiles. Appl Energy 135:461–471
Rodriguez MZ, Comin CH, Casanova D, Bruno OM, Amancio DR, Costa LDF, Rodrigues FA (2019) Clustering algorithms: a comparative approach. PLoS ONE 14:e0210236
Rong W, Zhuo E, Peng H, Chen J, Wang H, Han C, Cai H (2020) Learning a consensus affinity matrix for multi-view clustering via subspaces merging on Grassmann manifold. Inf Sci 547:68–87
Russom P (2011) Big data analytics. TDWI best practices report, fourth quarter 19:1–34
Sabbagh R, Ameri F (2020) A framework based on K-means clustering and topic modeling for analyzing unstructured manufacturing capability data. J Comput Inf Sci Eng 20:011005
Samoilenko S, Osei-Bryson K-M (2019) Representation matters: an exploration of the socio-economic impacts of ICT-enabled public value in the context of sub-Saharan economies. Int J Inf Manage 49:69–85
Saxena A, Prasad M, Gupta A, Bharill N, Patel OP, Tiwari A, Er MJ, Ding W, Lin C-T (2017) A review of clustering techniques and developments. Neurocomputing 267:664–681
Schwenker F, Trentin E (2014) Pattern classification and clustering: a review of partially supervised learning approaches. Pattern Recogn Lett 37:4–14
Scott J, Carrington PJ (2011) The SAGE handbook of social network analysis. SAGE publications, Thousand Oaks
Sekula MN (2015) OptCluster: an R package for determining the optimal clustering algorithm and optimal number of clusters, . Electronic Theses and Dissertations. Paper 2147. https://doi.org/10.18297/etd/2147
Sekula M, Datta S, Datta S (2017) optCluster: an R package for determining the optimal clustering algorithm. Bioinformation 13:101
Sfyridis A, Agnolucci P (2020) Annual average daily traffic estimation in England and Wales: an application of clustering and regression modelling. J Transp Geogr 83:102658
Shafqat S, Kishwer S, Rasool RU, Qadir J, Amjad T, Ahmad HF (2020) Big data analytics enhanced healthcare systems: a review. J Supercomput 76:1754–1799
Shamim G, Rihan M (2020) Multi-domain feature extraction for improved clustering of smart meter data. Technol Econ Smart Grids Sustain Energy 5:1–8
Sharghi E, Nourani V, Soleimani S, Sadikoglu F (2018) Application of different clustering approaches to hydroclimatological catchment regionalization in mountainous regions, a case study in Utah State. J Mt Sci 15:461–484
Sharma KK, Seal A (2020) Multi-view spectral clustering for uncertain objects. Inf Sci 547:723–745
Shi L (2020) Industrial symbiosis: context and relevance to the sustainable development goals (SDGs). In: Leal Filho W, Azul AM, Brandli L, Özuyar PG, Wall T (eds) Responsible consumption and production. Springer, Cham
Shiau W-L, Dwivedi YK, Yang HS (2017) Co-citation and cluster analyses of extant literature on social networks. Int J Inf Manage 37:390–399
Shiau W-L, Yan C-M, Lin B-W (2019) Exploration into the intellectual structure of mobile information systems. Int J Inf Manage 47:241–251
Shirkhorshidi AS, Aghabozorgi S, Wah TY, Herawan T (2014) Big data clustering: a review. In: International conference on computational science and its applications, Springer, Cham, pp 707–720
Solorio-Fernández S, Carrasco-Ochoa JA, Martínez-Trinidad JF (2020) A review of unsupervised feature selection methods. Artif Intell Rev 53:907–948
Song Z, Wang C, Bergmann L (2020) China’s prefectural digital divide: spatial analysis and multivariate determinants of ICT diffusion. Int J Inf Manage 52:102072
Sprague LA, Oelsner GP, Argue DM (2017) Challenges with secondary use of multi-source water-quality data in the United States. Water Res 110:252–261
Subramaniyan M, Skoogh A, Muhammad AS, Bokrantz J, Johansson B, Roser C (2020) A generic hierarchical clustering approach for detecting bottlenecks in manufacturing. J Manuf Syst 55:143–158
Suh JW, Sohn SY, Lee BK (2020) Patent clustering and network analyses to explore nuclear waste management technologies. Energy Policy 146:111794
Tahmasebi P, Hezarkhani A, Sahimi M (2012) Multiple-point geostatistical modeling based on the cross-correlation functions. Comput Geosci 16:779–797
Tanoto Y, Haghdadi N, Bruce A, Macgill I (2020) Clustering based assessment of cost, security and environmental tradeoffs with possible future electricity generation portfolios. Appl Energy 270:115219
Thakur N, Mehrotra D, Bansal A, Bala M (2020) Implementation of quasi-euclidean distance-based similarity model for retrieving information from OHSUMED dataset. In: Soft computing: theories and applications. Springer, Singapore
Tran TA (2020) Effect of ship loading on marine diesel engine fuel consumption for bulk carriers based on the fuzzy clustering method. Ocean Eng 207:107383
Upton G, Fingleton B (1985) Spatial data analysis by example. Volume 1: point pattern and quantitative data. Wiley, Hoboken
Uselton S, Ahrens J, Bethel W, Treinish L (1998) Multi-source data analysis challenges. Lawrence Berkeley National Lab. (LBNL), Berkeley
Ushakov AV, Vasilyev I (2020) Near-optimal large-scale k-medoids clustering. Inf Sci 545:344–362
Valls A, Gibert K, Orellana A, Antón-Clavé S (2018) Using ontology-based clustering to understand the push and pull factors for British tourists visiting a Mediterranean coastal destination. Inf Manage 55:145–159
Vialetto G, Noro M (2020) An innovative approach to design cogeneration systems based on big data analysis and use of clustering methods. Energy Convers Manage 214:112901
Wang X, Wang H (2020) Driving behavior clustering for hazardous material transportation based on genetic fuzzy C-means algorithm. IEEE Access 8:11289–11296
Wang Q, Yang X (2020) Investigating the sustainability of renewable energy–an empirical analysis of European Union countries using a hybrid of projection pursuit fuzzy clustering model and accelerated genetic algorithm based on real coding. J Clean Prod 268:121940
Wang W, Yang J, Muntz R (1997) STING: a statistical information grid approach to spatial data mining. VLDB 97:186–195
** community detection in networks: the state-of-the-art and comparative study. ACM Comput Surv (CSUR) 45:1–35
**e W-B, Lee Y-L, Wang C, Chen D-B, Zhou T (2020) Hierarchical clustering supported by reciprocal nearest neighbors. Inf Sci. https://doi.org/10.1016/j.ins.2020.04.016
Xu R, Wunsch D (2005) Survey of clustering algorithms. IEEE Trans Neural Netw 16:645–678
Xu R, Wunsch DC (2010) Clustering algorithms in biomedical research: a review. IEEE Rev Biomed Eng 3:120–154
Xu X, Qian H, Ge C, Lin Z (2020) Industry classification with online resume big data: a design science approach. Inf Manage 57:103182
Ye J (2011) Cosine similarity measures for intuitionistic fuzzy sets and their applications. Math Comput Model 53:91–97
Yin L (2020) Intelligent clustering evaluation of marine equipment manufacturing based on network connection strength. J Coast Res 103:900–904
Yoo I, Alafaireet P, Marinov M, Pena-Hernandez K, Gopidi R, Chang J-F, Hua L (2012) Data mining in healthcare and biomedicine: a survey of the literature. J Med Syst 36:2431–2448
Zhang K, Collins EG, Barbu A (2013) An efficient stochastic clustering auction for heterogeneous robotic collaborative teams. J Intell Rob Syst 72:541–558
Zhang X, Sun Y, Liu H, Hou Z, Zhao F, Zhang C (2020) Improved clustering algorithms for image segmentation based on non-local information and back projection. Inf Sci. https://doi.org/10.1016/j.ins.2020.10.039
Zhao K, Jiang Y, **a K, Zhou L, Chen Y, Xu K, Qian P (2020) View-collaborative fuzzy soft subspace clustering for automatic medical image segmentation. Multimed Tools Appl 79:9523–9542
Zhu Q, Zhang F, Liu S, Li Y (2019) An anticrime information support system design: application of K-means-VMD-BiGRU in the city of Chicago. Inf Manage 59:103247
Author information
Authors and Affiliations
Corresponding author
Additional information
Publisher's Note
Springer Nature remains neutral with regard to jurisdictional claims in published maps and institutional affiliations.
Rights and permissions
Springer Nature or its licensor (e.g. a society or other partner) holds exclusive rights to this article under a publishing agreement with the author(s) or other rightsholder(s); author self-archiving of the accepted manuscript version of this article is solely governed by the terms of such publishing agreement and applicable law.
About this article

Cite this article
Oyewole, G.J., Thopil, G.A. Data clustering: application and trends. Artif Intell Rev 56, 6439–6475 (2023). https://doi.org/10.1007/s10462-022-10325-y
Accepted:
Published:
Issue Date:
DOI: https://doi.org/10.1007/s10462-022-10325-y