
Abstract
Sensors can produce large amounts of data related to products, design, and materials; however, it is important to use the right data for the right purposes. Therefore, detailed analysis of data accumulated from different sensors in production and assembly manufacturing lines is necessary to minimize faulty products and understand the production process. Additionally, when selecting analytical methods, manufacturing companies must select the most suitable techniques. This paper presents a data analytics approach to extract useful information, such as important measurements for the dimensions of a shim, a small part for aligning shafts, from the manufacturing data of a power transfer unit (PTU). This paper also identifies the best techniques and analytical approaches within the following six individual areas: (1) identifying measurements associated with faults; (2) identifying measurements associated with shim dimensions; (3) identifying associations between station codes; (4) predicting shim dimensions; (5) identifying duplicate samples in faulty data; and (6) identifying error distributions associated with measurement. These areas are analysed in accordance with two analytical approaches: (a) statistical analysis and (b) machine learning (ML)-based analysis. The results show (a) the relative importance of measurements with regard to the faulty unit and shim dimensions, (b) the error distribution of measurements, and (c) the reproduction rate of faulty units. Additionally, both statistical analysis and ML-based analysis have shown that the measurement ‘PTU housing measurement’ is the most important measurement among available shim dimensions. Additionally, certain faulty stations correlated with one another. ML is shown to be the most suitable technique in three areas (e.g. identifying measurements associated with faults), while statistical analysis is sufficient for the other three areas (e.g. identifying measurements associated with shim dimensions) because they do not require a complex analytical model. This study provides a clearer understanding of assembly line production and identifies highly correlated and significant measurements of a faulty unit.
1 Introduction
Today, with the rise of advanced sensor technology through the Internet of Things (IoT), a large amount of data, commonly known as big data, is collected through cyber physical systems (CPSs) [1,2,3]. However, only a small portion of the available data is being used today, and often, most of these data are not used for any purpose. Proper usage of data enables smart manufacturing through improved decision-making using a data analytics approach based on historical and real-time data for fault detection, fault prognosis, production cost estimation, and more [4, 5]. Traditional routine-based maintenance in industry can be transformed into big data-assisted predictive maintenance. Machine health monitoring can be conducted by predicting health status based on real-time and historical data [6]. ML technology can be used for predictive maintenance, as in [6,7,8]. Thus, data-driven ML techniques have created a new dimension in the manufacturing industry.
The application of ML in the manufacturing industry is a recent development [9, 10]. Several techniques for integrating ML into manufacturing have emerged in the last few decades. ML methods such as decision trees, Bayesian networks, k-nearest neighbours (kNNs), and neural networks are currently being used in the manufacturing industry for tool condition monitoring. Tool wear-sensitive features are defined and extracted [11], and ML-aided tool wear monitoring or tool condition monitoring can be helpful in the manufacturing industry [12, 13]. This trend has been applied in the semiconductor industry as well, and faulty wafers can be detected with the help of ML techniques such as Gaussian density estimation, Gaussian mixture models, the Parzen-window method, k-means clustering, support vector machines (SVM), and principal component analysis (PCA) [14]. Fault detection and fault classification are essential parts of process monitoring in photovoltaic (PV) arrays and can be performed with the help of ML algorithms [15,16,17]. ML-aided automated fault detection and diagnosis have been successful in many cases [18]. To lower the necessity of human expertise in fault detection, convolutional ML algorithms such as convolutional neural networks outperform traditional systems in rotating machinery [19]. Images of partially printed objects in 3-D printing are used for automated process monitoring. The object is classified as ‘defective’ or ‘good’ with the help of SVM [20]. Another application of ML in process monitoring is monitoring surface roughness in additive manufacturing. Temperature and vibration data are fed into an ensemble learning algorithm to predict roughness [21]. Data analytics aims to gain knowledge from raw data or derived data (i.e. results received from ML algorithms) [22]. Today, manufacturing systems are less dependent on human knowledge and rely more on advanced techniques such as deep learning to extract knowledge from raw data.
ML technology has recently been applied in the manufacturing industry. Before ML, statistical analysis was the primary method used in the manufacturing industry. Statistical methods help to correlate, organize, and interpret data [23], and statistical analysis shows the underlying patterns in a data set; for example, correlation indicates a relationship between two variables. Currently, manufacturing systems are becoming more complex, and it is challenging to detect and isolate faults. The Gaussian mixture model for finding probabilistic correlation is one method that is used for anomaly detection [24]. Another statistical method that can be used for fault detection is canonical correlation analysis (CCA), which is used during alumina evaporation [25]. Based on the correlation coefficient of the voltage curves, fault detection can be performed on short circuits [26]. Fault diagnosis in fluctuating workloads (i.e., large-scale cloud computing environments) can be performed with the help of canonical correlation analysis between workloads and performance matrices [27].
As discussed above, statistics played an important role in process control before the emergence of ML and other technologies. However, most companies are still not fully using their data to create new knowledge. Additionally, most companies face challenges in their choice of data analytics techniques—whether they will adhere to traditional statistical analysis or use the most current ML techniques. This study attempts to solve these problems by extracting useful knowledge from raw data and investigates which method (ML or statistical analysis) is best suited for different areas. To our knowledge, no study has investigated which data analytical methods have been used for power transfer unit (PTU).
Consider the following example: a local companyFootnote 1 manufactures power transfer units (PTUs) for vehicles and uses different IoT-based sensors to measure different dimensions associated with the PTUs. The primary PTU housing shown in Fig. 1 is supported with 3 shims. Approximately 6.8% of PTUs are reported to be faulty, resulting in economic loss. The data collected from the assembly line were analysed to extract useful knowledge and identify the best method for data analytics.
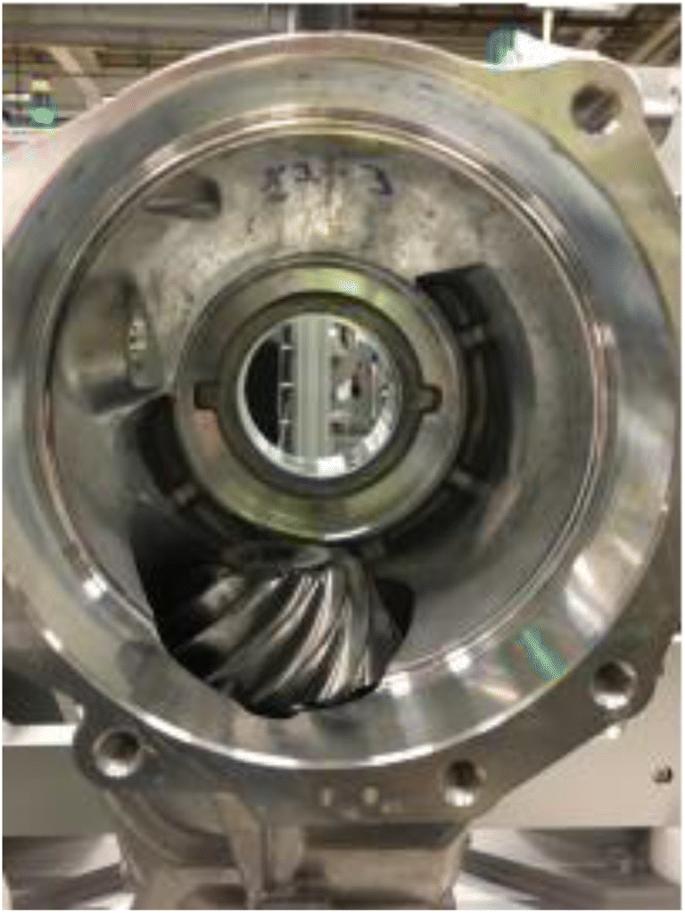
Main housing of PTU
In this case, the influence of different measurements (i.e. ‘PTU housing measurement’) on the shim dimensions is investigated. Again, both statistical analysis methods (e.g. correlation) and ML algorithms (e.g. linear regression (LR), support vector regression (SVR), and random forest regression (RFR)) have been used to identify the most significant measurements associated with the shim. Furthermore, the data can be used to identify measurements that are highly responsible for a faulty unit. In this study, associations between station codes and shim dimension prediction are also investigated. Additionally, the reproduction rate of the faulty unit and error distribution of measurements are analysed. Both statistical analysis and ML-based analysis are compared to identify the method best suited to the areas mentioned above.
2 Data collection and analysis
2.1 Power transfer unit
PTUs transfer power from the front of a vehicle to the back. This action is performed with the help of two cogwheels or gears. The efficiency of the PTU depends on the position of these two gears; misplaced gears result in vibrations and noise. Thus, to align these two gears, shims are used. Figure 2 shows a PTU in efficient driveline (ED) mode.

PTU in efficient driveline mode
2.2 Dataset
The dataset investigated in this study was obtained from a manufacturing company’s logistics in-production system database and consists of various measurements performed on an assembly line that manufactures PTUs. In total, 151,342 units are constructed, 6,488 of which have been marked as ‘faulty’ by the operator due to mismatches in measurements or incorrect shim dimensions. Forty-two measurements for each unit were recorded in the dataset, including mounting distances from the housing of the gear and gear heights. Each unit has a serial number and production time. There are several PTU stations at which the data were collected, and each station has a station code. The faulty samples were also marked in red, and the STATION fields of the nonfaulty samples were kept empty.
Explanations of the different stations are listed in Table 1. The data used in this study were gathered from an IoT platform that connects all the sensors via the internet.
2.3 Data analytics
Several data analytics areas that have been investigated in this study are shown in Fig. 3.
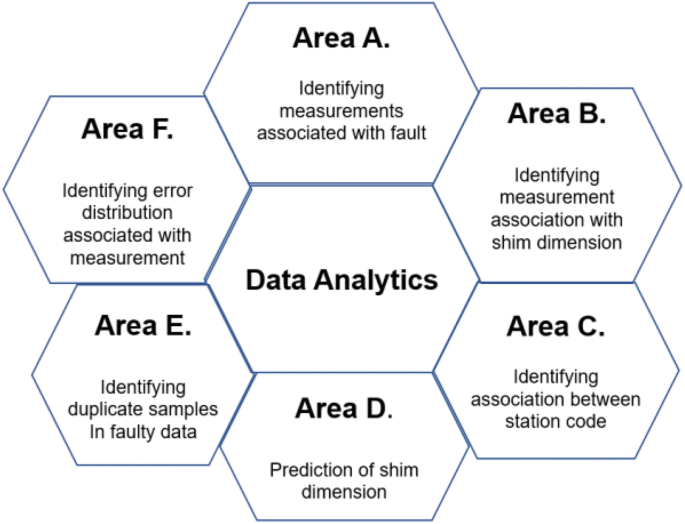
Different data analytics areas
In this study, Area A identifies an association of different measurements with faults (i.e. which of 42 measurements are highly correlated with faulty units). Area B concerns the identification of the most important measurement associated with shim dimensions. Area C identifies a correlation between the stations, as each faulty unit has a station code. Area D predicts shim dimensions, and Area E identifies duplicate samples within the faulty data sets. Finally, Area F identifies error distributions associated with the measurements.
3 Overview of the approach
The step-by-step approach to data analytics is shown in Fig. 4. The methods used in this study include domain knowledge; problem formulation; data and data pre-processing; data analytics involving statistical data analysis; ML-based data analysis; evaluation of the approach; new knowledge; and the best technique as an outcome. Initially, domain knowledge, data, requirements, and ideas are accumulated from the manufacturing company’s assembly line. Typically, the problem is formulated based on the requirements; in this study, the problem is formulated to explore the data, gather more knowledge about the assembly line, and find the best method of analysis. Additionally, domain knowledge is extracted and stored separately to evaluate the outcome of the approach.

States of the proposed method
Because data were collected in a raw format, data pre-processing (i.e. populating missing values, identifying outliers, etc.) was performed. In this stage, the values representing NaN (not a number) and null values were replaced with zeros, and missing values were identified and populated via imputation. Furthermore, data exploration was performed to identify irregular cardinality and outliers in the dataset. None of the measurements had a cardinality of 1 or a low cardinality. Therefore, irregular cardinality was absent in the dataset. To identify outliers, the distributions of measurements as well as minimums and maximums were observed. However, the dataset did not contain any outliers. Finally, all measurements were normalized to a range of 0 to 1. Then, the dataset was divided into training (containing 80% of data) and test (the other 20%) datasets to apply ML-based analysis.
In this study, data analytics was performed in two phases: (1) Phase 1 performed statistical analysis to investigate different data distributions and correlations between different station codes as well as measurements associated with shim dimensions to identify correlations within the PTU domain; and (2) Phase 2 performed ML-based data analysis to identify the most relevant measurements and optimize the number of measurements. The results of these two steps were analysed and evaluated to create new useful knowledge about the manufacturing company’s assembly line. Additionally, a comparison between Phase 1 and Phase 2 was performed to identify the most suitable methods for individual areas.
Statistical data analysis (Phase 1) was performed to explore the data and describe the various characteristics of the dataset. The goal of this Phase is to identify the distribution of faulty items considering the different ranges of measurement values, correlation between different measurements of the shim dimension, and correlation between error rates and assembly stations. Statistical analysis provides insights into the dataset, such as an overall understanding of the assembly line, the importance of different measurements, and the effects of faulty measurements on different stations in the assembly line. To identify the relationships between different measurements and the number of errors, the target measurements were divided into 100 bins. For each bin, the number of errors was summed, and the distribution of the errors was explored with histograms.
According to expert opinions, faults in the dataset are associated with one of the important measurements called the ‘PTU housing measurement’. A correlation analysis that indicates the degree to which two random measurements were linearly connected was used to see how faults from different stations were associated with station codes for ‘PTU housing measurement’. To estimate the correlation, station codes for ‘PTU housing measurement’ were first listed, and a matrix was created, which was then used to calculate the cross-correlation of the accumulated station codes. The correlation showed that certain stations were highly correlated. Additionally, certain faulty samples were found to be repeated in the dataset. Therefore, duplicate values corresponding to an item’s serial number were identified, and the frequency of faulty samples for measurement ‘PTU housing measurement’ was estimated for each station code.
The objectives of ML-based analysis (Phase 2) were to classify PTU faults, predict shim dimensions, and identify the relationships between station codes. Classifying faults helps to understand the most relevant measurements, and in the future, fault classification may help to predict the values that must be adapted for an accurate unit. All faulty and nonfaulty units were labelled station codes 1 and 0, respectively. The hyperparameters of the ML models were optimized with the goal of comparing the performance of the ML models with/without the default parameters. Additionally, most case options for hyperparameter optimization were set to default, and the creation of models with the default optimization option took an average of 12 hours. Due to the long optimization process and good performance of the default hyperparameter optimization option (discussed in Section 4), default values of the option for optimization were not changed. All eligible hyperparameters were not optimized (except RFR) for the same reason; RFR was optimized because of the deviation in the RFR model predicted value from the real value.
Two support vector machine (SVM) classifiers were trained to classify the faulty units using the training dataset. Then, the coefficient values of the measurements obtained from the SVM classifier were used to rank the measurements, and the most relevant measurements were compared to the suggestions of experts. One of the classifiers had default hyperparameters, and another had optimized hyperparameters. The default hyperparameters associated with the classifier are box constraint=1, kernel scale=1, kernel function= ‘linear’, and standardized data=0. The second classifier was built using automatic hyperparameter optimization. The hyperparameter optimization option was set to ‘auto’, which indicates that the hyperparameters ‘BoxConstraint’ and ‘KernelScale’ will be optimized instead of all eligible parameters. Options for optimization were set to default values except ‘AcquisitionFunctionName’, which was set to ‘expected improvement plus’ to enable reproducibility. After 30 iterations, a hyperparameter-optimized model (support vector classifier) was created. The best feasible ‘BoxConstraint’ value is 837.56, and the ‘KernelScale’ value is 133.58.
Furthermore, to identify the correlations between ‘Gear (Pinion) height’, ‘PTU housing measurement’ and ‘Manual adjustment’, and the ‘shim dimension’ and to predict the shim dimension, several ML algorithms (LR, SVR, and RFR) were trained. With the LR algorithm, only one model was trained because the hyperparameters were not involved in fitting the input datapoints. It is assumed that the relation between input and output follows the formula y = bx + c.
In SVR, two models were trained: one with default hyperparameters, and one with optimized hyperparameters. The default hyperparameter SVR was trained with a linear kernel, and the hyperparameters were set to default values (lambda=8.259×10⁻⁶, learner=SVM, regularization=ridge(L2)). Conversely, for the optimized model, the parameters to be optimized were set to ‘auto’ to optimize three hyperparameters: BoxConstraint, KernelScale, and Epsilon. Option for optimization was set to default. After 30 iterations, a hyperparameter-optimized regression model was created. The values of the optimized hyperparameters are BoxConstraint=0.022683, KernelScale=0.013568, and Epsilon=0.00022608.
In RFR, three models were trained: one with default hyperparameters, one with four hyperparameters optimized and one with all hyperparameters optimized. The default RFR was trained using a bagged ensemble of 200 regression trees, and the hyperparameters were set as follows: number of ensemble learning cycles=200, learn rate=1, method=‘bag’, and number of predictors to select at random for each split=all. In the four hyperparameter-optimized RFR models, the parameters to be optimized were set to ‘auto’ to optimize four hyperparameters: Method, NumLearningCycles, LearnRate, and MinLeafSize. Options for optimization was set to default. After 30 iterations a four hyperparameter-optimized RFR model was created The values of the optimized hyperparameters are Method= ‘LSBoost’, NumLearningCycles=85, LearnRate= 0.050891, and MinLeafSize=1. In the third model, all eligible parameters were optimized. The values of all optimized hyperparameters are Method= ‘Bag’, NumLearningCycles=16, LearnRate=NaN, MinLeafSize=4, MaxNumSplits= 60006, NumVariablesToSample=2. Then, these models were evaluated using the test dataset.
To identify the relationships between different stations, 10 rules were mined using an Apriori algorithm on the Weka platform. General association rules were mined instead of class association rules by setting ‘car’ to false. The rules were ranked based on the values of ‘confidence’, and the minimum metric score was 0.9. Upper bound for minimum support was 1.0.
4 Results and discussion
The goal of this evaluation was to gather new, useful knowledge about the assembly line using the proposed data analytics method and identify the best techniques for individual areas. In this study, an exploratory validation approach is used to find the best ML model.
In Fig. 3, different areas of data analytics are described, and an evaluation is presented based on these different areas.
Area A
Experts from the manufacturing company provided a set of the most relevant measurements corresponding to faults. In Phase 1, the objective was to find the correlation coefficients between each of the 42 measurements and STATION. However, this method was found to be time-consuming. The MATLAB command ‘corrplot’ for finding correlations resulted in a 42×42 matrix that was difficult to interpret. Another method of implementing Phase 1 analysis is analysis of variance (ANOVA), where p-values are used to select the most informative measurements [28]. The authors in [28] discarded measurements depending on the p-value. However, this work does not use the ANOVA method because the dataset was not normally distributed in certain cases.
Implementation of Phase 1 analysis could also be accomplished by following the methods used by Andrew and Srinivas [29]. The authors deleted one measurement at a time to find the most important measurements; however, this method is time-consuming. Due to these problems, we did not consider Phase 1 to be a suitable analysis method.
In the next step, we found a different set of relevant measures in Phase 2 (ML algorithms). Two SVM classifiers were created: one with default hyperparameter values and another with optimized hyperparameters. Both classifiers provided the same measurements based on relevance, and the identified relevant measurements found with both SVM classifiers are shown in Table 2. However, a large amount of overlap was observed between the measurements provided by the experts and measurements identified using the ML algorithm SVM. Thus, SVM classification was used to classify the samples into two groups: ‘faulty’ and ‘nonfaulty’. Then, linear coefficients associated with the predictors (measurements) were compared. We have listed the 18 most relevant measurements. A comparison between the list of 18 measurements provided by the manufacturer and those uncovered using SVM showed that the lists agree. After discussion with the experts, it was confirmed that whenever a fault takes place, technicians can check the measurements in Table 2 for possible faults.
The classification results using the test dataset and classifier with default hyperparameters and optimized hyperparameters are shown in Table 3. The classifiers are useful based on these measurements. None of the samples were incorrectly classified as faulty or nonfaulty by the classifiers, and both classifiers had 100% accuracy, specificity, and sensitivity. The motivation of creating a hyperparameter-optimized model is to see if there is any change in performance.
Phase 1 analysis is also shown to be unsuitable for Area A. With increments in the number of measurements, the difficulty of implementing Phase 1 increases exponentially. Thus, Phase 2 is best suited for this area, considering implementation time and difficulty.
Area B
Both Phase 1 and Phase 2 analyses were implemented. Three measurements—‘Gear (Pinion) height’, ‘PTU housing measurement’, and ‘Manual adjustment’—were analysed for correlations with the shim dimension. In Phase 1, the correlation coefficients of these measurements with the shim dimension were calculated and are shown in Table 4.
As shown in Table 4, ‘PTU housing measurement’ has the highest correlation with the shim dimension, and this result also aligns with the experts’ opinions.
In Phase 2, the relative importance (i.e. linear coefficients of measurements associated with shim dimension) was found by the ML algorithms LR, SVR, and RFR with default hyperparameters and optimized hyperparameters (Table 5). These ML algorithms predicted the shim dimension with the help of regression models.
From the table, it can concluded that if there is any fault in the shim dimension, it is highly probable that ‘PTU housing measurement’ has a problem. A technician can check this measurement for probable adjustment. Both the default and optimized hyperparameter models provided the same result except for the default hyperparameter RFR model. In the case of the default hyperparameter RFR model, ‘gear (pinion) height’ has the highest importance with regard to the shim dimension. However, this result does not align with the results of the remainder of the models. Because hyperparameter-optimized SVR and LR have higher accuracies (Table 8), we considered ‘PTU housing measurement’ as the most important measurement. Additionally, a comparison between the default hyperparameter and optimized hyperparameter models (SVRs) showed that the overall relative importance of the predictors is lower in the optimized hyperparameter model than in the default hyperparameter model. The effect of predictors on the shim dimension is lower in the optimized hyperparameter model than in the default hyperparameter model.
Although both Phase 1 and Phase 2 analyses were implemented in this area, Phase 1 was easier to use than Phase 2. Phase 2 involved the creation of regression models with hyperparameter tuning. Additionally, knowledge of ML is required to implement Phase 2 analysis. The application of ML is not necessary when the target problem can be easily solved with traditional mathematics or statistics. Therefore, for this area, Phase 1 is the most suitable method of analysis.
Area C
The correlation (Phase 1) between different station codes for the ‘PTU housing measurement’ was calculated, and the most highly correlated station codes are shown in Table 6 (i.e. faults with a correlation coefficient higher than 0.80). The remainder of the station codes appeared random because their correlation coefficients were comparatively low and are thus not listed in Table 6.
In Phase 2 analysis, association rules were mined using the Weka platform, and the results are shown in Table 7. All of the rules have confidence levels higher than 90%. For example, we can interpret the first row as if Station 114 does not have any fault, then there is a 100% chance that Station 140 will not have any fault as a confidence level of 1. A lift value greater than 1 indicates that the rule body and rule head occur together more often than expected. Additionally, if the conviction value is 1, then the rule body and rule head are independent. A conviction value other than 1 indicates a better rule. A high leverage value indicates a higher probability of the rule head and rule body happening together. All of these measures, as shown in Table 7 indicate that the rules are reliable.
However, the stations that have a high correlation according to Phase 2 do not align with the results of Phase 1. Manual checking of the stations suggests that Phase 2 is more accurate. Statistical analysis only measured the correlation by the number of faults and ignored the relationship when a fault was absent. ML considered the relationships between stations according to both faults and non-faults. Therefore, for this area of analysis, Phase 2 is most suitable.
Area D
To use Phase 1 in Area D, we reviewed 50 peer-reviewed papers published in 2019–2020 and selected certain statistical techniques. For example, we attempted to use spatial statistics [30]; however, this method has basic applications in feature extraction, not prediction. Similarly, Cox proportional hazards regression [31] was used to predict the next occurrence of an event; however, predicting the shim dimension was not possible with this algorithm. The accelerated failure time (AFT) model was also considered. However, this model uses the same method as the Cox proportional hazards regression. Logistic regression was considered as a statistical method in one study [32]; however, logistic regression is a classifier that cannot be used for regression. Thus, we could not find any other statistical techniques that could be implemented in Area D. For this reason, Phase 1 was not implemented in Area D.
In Phase 2, both the LR and SVR (default and optimized hyperparameter) algorithms predicted the shim dimension with an accuracy near 100%. A small deviation was observed in the predicted value from the real value in the case of RFR (both default and optimized hyperparameter) compared to LR and SVR. All eligible hyperparameters were optimized in one of the RFR models; however, the deviation was also the same for that model. Figure 5 shows the parity plot for the shim-dimension prediction using the test dataset and the optimized hyperparameter RFR algorithm. These deviated values were within 10% of the real values.
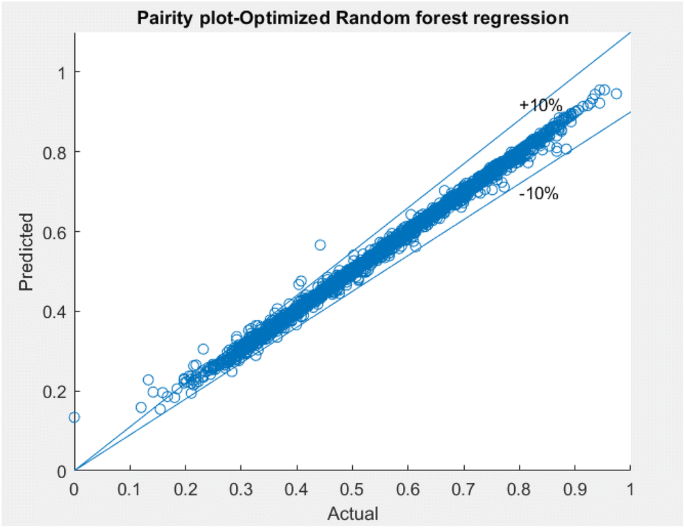
(Area D) Parity plot for optimized random forest regression
Table 8 lists the coefficient of determination (R2), root mean square error (RMSE), mean absolute error (MAE), and mean square error (MSE) values of the regression models (default and optimized hyperparameter). In the hyperparameter-optimized models, the R2, RMSE, MAE, and MSE values were marginally improved compared to the default hyperparameter models. However, for the RFR model, there was no improvement in the hyperparameter-optimized model. In Table 8, a lower RMSE value indicates a better fit, and the observed data points are near the model’s predicted values. Conversely, the R2 values are 1 or near 1, indicating that the models can significantly predict the shim dimension.
Additionally, the MAE and MSE of the models are near zero, indicating that the models can predict without any error. However, the dataset to which the results are compared is labelled by technicians and thus may be labelled incorrectly. Thus, there may be faults in the model.
Table 9 shows the estimated coefficients of the linear regression model, where ‘Gear (Pinion) height’, ‘PTU housing measurement’, and ‘Manual adjustment’ are the predictors. The term ‘Estimate’ indicates the relative importance (coefficient value) of the predictors in the model. The predictor ‘PTU housing measurement’ is the most important of the three predictors.
‘SE’ is the standard deviation of the estimate and indicates the standard error of the coefficients, which represents the model’s ability to estimate coefficient values. A lower SE indicates a better estimate. In Table 9, the SE is small, meaning that the model accurately estimated the values of the coefficients.
‘tStat’ is used to determine whether a null hypothesis should be accepted or rejected by measuring the precision of measurement estimates. ‘Null hypothesis’ indicates that there is no relationship between the input and the output. The higher the tStat value, the more significant the estimate is in the regression model. Thus, the null hypothesis can be rejected because tStat is high.
The ‘P-value’ in the linear regression analysis indicates whether the null hypothesis can be rejected. In this study, the null hypothesis can be rejected if the p-value is low. Additionally, there is a high correlation between the input and the output.
In Table 9, all p-values are 0, indicating that predictors are highly correlated with the response.
For Area D, Phase 2 is the most suitable method because Phase 1 could not be implemented.
Area E
The ‘Serial number’ column was checked for duplicate instances of a PTU unit, and a duplicate instance was created if a fault were present. The faulty item was repaired, and the same ‘serial number’ was provided. In Phase 1, analysis was performed on faults with station codes 90 and 110. A total of 3,930 items with station codes 90 and 110 were found to be faulty. Out of these 3930 faulty items, only 360 items with the same ‘serial number’ were repaired. According to discussions with experts in this field, PTUs with faults can be assigned new ‘Serial numbers’, or can be considered scrap.
Phase 2 was not implemented in this area because it is not necessary to use ML to find duplicate instances within a given set of numbers; traditional statistics are sufficient for this purpose. ML is necessary the following cases [33]:
-
A task that is too complex for a human to solve
-
A task requiring large amounts of memory
-
A task requiring adaptivity
Therefore, for Area E, Phase 1 is the best suited method.
Area F
Phase 1 was implemented to find the error distribution. The relationship between faults and measurements follows a Gaussian distribution, except for ‘housing measurement from loading house/measuring house’, which has a large bar at 59. We assume that the data were equivalent to 59 and not due to a programming error. After double-checking, it was confirmed that these data were correct. The error distribution of the ‘PTU housing measurement’ is shown in Fig. 6. At a threshold of 103.58, the error rate is high. Conversely, the error rate decreases below a threshold of 103.68.
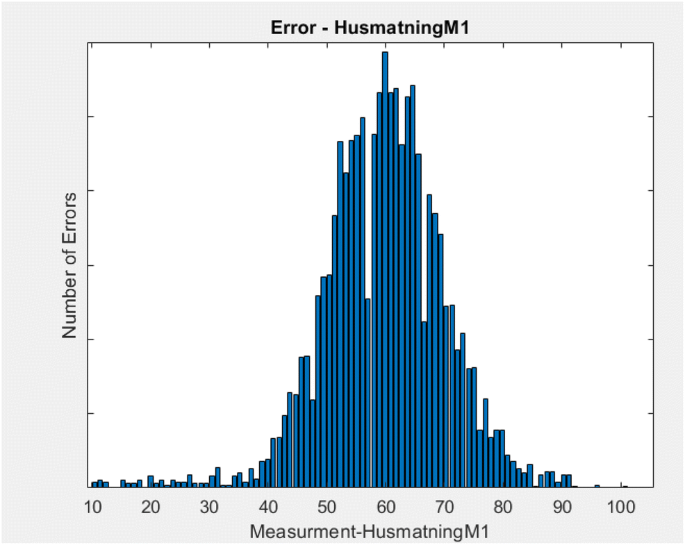
Error distribution of ‘PTU housing measurement’
Phase 2 was not implemented for the same reason stated in Area E; therefore, Phase 1 is the most suitable method for Area F.
5 Conclusions
Concerning the various areas described in Fig. 3, the outcomes of the proposed intelligent data analytics with regard to power transfer units are as follows:
-
Area A: Out of 42 measurements, the experts from the manufacturing company identified the 18 most relevant measurements. In this study, we used two SVM classifiers to find the most relevant measurements, which are listed in Table 2. There is a large amount of overlap between the measurements provided by the experts and the measurements identified using the ML algorithm. Phase 1 is not best suited for this area; Phase 2 is needed for this area in this study.
-
Area B: Both statistical analysis and ML-based analysis have shown that ‘PTU housing measurement’ is the most important measurement for the shim dimension. Phase 1 is the method best suited for this area.
-
Area C: Certain station codes were highly correlated. Phase 2 is the most suitable method for this area because Phase 1 produced incomplete results.
-
Area D: ML algorithms predicted the shim dimension accurately. The manufacturing company’s technicians manually selected a shim dimension whenever there was a mismatch. This manually selected shim dimension was frequently correct. In this study, the dataset that was used to train the ML models to predict the shim dimension (Area D) contains these erroneous values. In the future, the prediction of shim dimensions can be improved by classifying them with the help of an ML algorithm instead of depending on the knowledge of technicians to create the labelled datasets. Phase 1 could not be implemented in this area; thus, Phase 2 is the most suitable method for this area.
-
Area E: Not all units that had faults were reproduced, which was determined by observing the number of duplicate instances. Phase 1 was more effective in this area than Phase 2.
-
Area F: The relationship between fault and measurements follows a Gaussian distribution. Phase 1 is thus the most suitable method for this area.
Thus, this study contributes to knowledge about a manufacturing company’s assembly line and presents a comparative study of the suitability of various analytical methods in the aforementioned six areas. The proposed methods allow assembly line technicians to check important measurements identified by ML (Area A) when there is a fault in a PTU instead of checking all 42 measurements. Additionally, in the case of shim dimensions (Area B), a technician can check ‘PTU housing measurement’ for mismatches. The identification of relationships between station codes (Area C) can help the manufacturing company find patterns and causes of failures. The prediction of the shim dimension (Area D) will help technicians choose shims when there is a mismatch, and the shim dimension prediction system can be used in the cloud. Considering the rate of reproduction of faulty units (Area E), technicians can try to reduce this rate. According to discussions with experts at the manufacturing company, the error distribution of ‘PTU housing measurement’ (Area F, Fig. 6) follows an exponential distribution. However, the distribution found in this study is Gaussian; this discrepancy will be investigated in future research.
The performance of the hyperparameter-optimized RFR model was not higher than the default hyperparameter model; this topic will also be investigated in future research.
We attempted to find the most suitable method of analysis for six areas of interest. Based on various analyses, neither statistics nor ML can be used in all six areas. Statistics were found to be most suitable for areas B, E, and F, while ML was found to be the most suitable technique for areas A, C, and D because ML is used when a problem is too complex for statistics to solve and requires adaptability. None of the problems solved in areas B, E, and F were too complex, nor did they require any adaptability, while the problems solved in A, C, and F were complex and benefitted from the advantages of ML.
Availability of data and materials
The data used in this work is not possible to upload to a repository due to confidentiality of the manufacturing company.
References
Lasi H, Fettke P, Kemper H-G, Feld T, Hoffmann M (2014) Industry 4.0. Bus Inf Syst Eng 6(4):239–242
Lee J, Bagheri B, Kao H-A (2015) A cyber-physical systems architecture for industry 4.0-based manufacturing systems. Manuf Lett 3:18–23
Nagorny K, Lima-Monteiro P, Barata J, Colombo AW (2017) Big data analysis in smart manufacturing: A review. Int J Commun Netw Syst Sci 10(3):31–58
Tao F, Qi Q, Liu A, Kusiak A (2018) Data-driven smart manufacturing. J Manuf Syst 48:157–169
Gao W, Zhu Y (2017) A cloud computing fault detection method based on deep learning. J Comput Commun 5(12):24–34
Wan J, Tang S, Li D, Wang S, Liu C, Abbas H, Vasilakos AV (2017) A Manufacturing Big Data Solution for Active Preventive Maintenance. IEEE Trans Ind Inf 13(4):2039–2047. https://doi.org/10.1109/TII.2017.2670505
Susto GA, Schirru A, Pampuri S, McLoone S, Beghi A (2015) Machine Learning for Predictive Maintenance: A Multiple Classifier Approach. IEEE Trans Ind Inf 11(3):812–820. https://doi.org/10.1109/TII.2014.2349359
Prytz R (2014) Machine learning methods for vehicle predictive maintenance using off-board and on-board data. Halmstad University Press
Monostori L, Márkus A, Van Brussel H, Westkämpfer E (1996) Machine learning approaches to manufacturing. CIRP Ann 45(2):675–712
Tomohiko Sakao PF, Matschewsky J , Bengtsson M, Ahmed MU (2021) AI-LCE: Adaptive and Intelligent Life Cycle Engineering by applying digitalization and AI methods – An emerging paradigm shift in Life Cycle Engineering Paper presented at the 28th CIRP Conference on Life Cycle Engineering (CIRP LCE 2021)
Kilundu B, Dehombreux P, Chiementin X (2011) Tool wear monitoring by machine learning techniques and singular spectrum analysis. Mech Syst Signal Process 25(1):400–415
de Farias A, de Almeida SLR, Delijaicov S, Seriacopi V, Bordinassi EC (2020) Simple machine learning allied with data-driven methods for monitoring tool wear in machining processes. Int J Adv Manuf Technol 109(9):2491–2501
Serin G, Sener B, Ozbayoglu A, Unver H (2020) Review of tool condition monitoring in machining and opportunities for deep learning. Int J Adv Manuf Technol 1–22
Kim D, Kang P, Cho S, Lee H-j, Doh S (2012) Machine learning-based novelty detection for faulty wafer detection in semiconductor manufacturing. Expert Syst Appl 39(4):4075–4083
Zhao Y, Yang L, Lehman B, de Palma J-F, Mosesian J, Lyons R (2012) Decision tree-based fault detection and classification in solar photovoltaic arrays. In: 2012 Twenty-Seventh Annual IEEE Applied Power Electronics Conference and Exposition (APEC). IEEE, pp 93–99
Omran WA, Kazerani M, Salama MM (2010) A clustering-based method for quantifying the effects of large on-grid PV systems. IEEE Trans Power Deliv 25(4):2617–2625
Zhao Y, Ball R, Mosesian J, de Palma J-F, Lehman B (2014) Graph-based semi-supervised learning for fault detection and classification in solar photovoltaic arrays. IEEE Trans Power Electron 30(5):2848–2858
Han H, Gu B, Wang T, Li Z (2011) Important sensors for chiller fault detection and diagnosis (FDD) from the perspective of feature selection and machine learning. Int J Refrig 34(2):586–599
Janssens O, Slavkovikj V, Vervisch B, Stockman K, Loccufier M, Verstockt S, Van de Walle R, Van Hoecke S (2016) Convolutional neural network based fault detection for rotating machinery. J Sound Vib 377:331–345
Delli U, Chang S (2018) Automated process monitoring in 3D printing using supervised machine learning. Procedia Manuf 26:865–870
Li Z, Zhang Z, Shi J, Wu D (2019) Prediction of surface roughness in extrusion-based additive manufacturing with machine learning. Robot Comput Integr Manuf 57:488–495
Xu K, Li Y, Liu C, Liu X, Hao X, Gao J, Maropoulos PG (2020) Advanced Data Collection and Analysis in Data-Driven Manufacturing Process. Chin J Mech Eng 33(1):1–21
Daniel EC, Onyedika IC, Christian OI, Benjamin AU (2014) Statistical Analysis of Processing Data for a Manufacturing Industry (A Case Study of Stephens Bread Industry) Conference Proceedings
Guo Z, Jiang G, Chen H, Yoshihira K (2006) Tracking probabilistic correlation of monitoring data for fault detection in complex systems. In: International Conference on Dependable Systems and Networks (DSN’06). IEEE, pp 259–268
Chen Z, Ding SX, Zhang K, Li Z, Hu Z (2016) Canonical correlation analysis-based fault detection methods with application to alumina evaporation process. Control Eng Pract 46:51–58
**a B, Shang Y, Nguyen T, Mi C (2017) A correlation based fault detection method for short circuits in battery packs. J Power Sources 337:1–10
Wang T, Zhang W, Wei J, Zhong H (2015) Fault detection for cloud computing systems with correlation analysis. In: 2015 IFIP/IEEE International Symposium on Integrated Network Management (IM). IEEE, pp 652–658
Huang Z, Chen H, Hsu C-J, Chen W-H, Wu S (2004) Credit rating analysis with support vector machines and neural networks: a market comparative study. Decis Support Syst 37(4):543–558
Sung AH, Mukkamala S (2003) Identifying important features for intrusion detection using support vector machines and neural networks. In: 2003 Symposium on Applications and the Internet. Proceedings, 2003. IEEE, pp 209–216
Cameron B, Tasan C (2019) Microstructural damage sensitivity prediction using spatial statistics. Sci Rep 9(1):1–6
Senders JT, Staples P, Mehrtash A, Cote DJ, Taphoorn MJ, Reardon DA, Gormley WB, Smith TR, Broekman ML, Arnaout O (2020) An online calculator for the prediction of survival in glioblastoma patients using classical statistics and machine learning. Neurosurgery 86(2):E184–E192
Barnett-Itzhaki Z, Elbaz M, Butterman R, Amar D, Amitay M, Racowsky C, Orvieto R, Hauser R, Baccarelli AA, Machtinger R (2020) Machine learning vs. classic statistics for the prediction of IVF outcomes. J Assist Reprod Genet 37(10):2405–2412
Shalev-Shwartz S, Ben-David S (2014) Understanding machine learning: From theory to algorithms. Cambridge university press
Acknowledgements
The authors would like to acknowledge the students Simon Svensson, Kristoffer Lindve, Henrik Särnblad, and Gustav Radbrandt, for their initial work on the data and effort in the course project held in Mälardalen University, Sweden, many thanks to them. Many thanks to GKNFootnote 2 for the data and domain knowledge.
Funding
Open access funding provided by Mälardalen University. The study was conducted through the project AUTOMAD which is funded by the XPRES framework and also the project DIGICOGS which is financed by Vinnova (Vinnovas Diarienr: 2019-0532) and the innovation programme Process Industrial IT and Automation (PiiA) at Mälardalen University.
Author information
Authors and Affiliations
Contributions
The corresponding author Sharmin Sultana Sheuly has been responsible for writing the paper, develo** the MATLAB codes, comparison between ML and statistical analysis, and finding the most suitable method. Shaibal Barua and Shahina Begum have been responsible for identifying and discussing the most important analysis areas. Mobyen Uddin Ahmed has been working in identifying most relevant measurements corresponding to faults and shim dimension prediction. Ekrem Güclü and Michael Osbakk have provided the data and domain knowledge for evaluating the analysis result.
Corresponding author
Ethics declarations
Consent to participate
Not applicable.
Consent to publish
All the authors signed the consent to publish this work.
Conflict of interest
The authors declare no competing interests.
Additional information
Publisher’s note
Springer Nature remains neutral with regard to jurisdictional claims in published maps and institutional affiliations.
Rights and permissions
Open Access This article is licensed under a Creative Commons Attribution 4.0 International License, which permits use, sharing, adaptation, distribution and reproduction in any medium or format, as long as you give appropriate credit to the original author(s) and the source, provide a link to the Creative Commons licence, and indicate if changes were made. The images or other third party material in this article are included in the article's Creative Commons licence, unless indicated otherwise in a credit line to the material. If material is not included in the article's Creative Commons licence and your intended use is not permitted by statutory regulation or exceeds the permitted use, you will need to obtain permission directly from the copyright holder. To view a copy of this licence, visit http://creativecommons.org/licenses/by/4.0/.
About this article

Cite this article
Sheuly, S.S., Barua, S., Begum, S. et al. Data analytics using statistical methods and machine learning: a case study of power transfer units. Int J Adv Manuf Technol 114, 1859–1870 (2021). https://doi.org/10.1007/s00170-021-06979-7
Received:
Accepted:
Published:
Issue Date:
DOI: https://doi.org/10.1007/s00170-021-06979-7