
Abstract
Ionizing radiation is ubiquitous in the environment. Its source can be natural, such as radioactive materials present in soil and cosmic rays, or artificial, such as the fuel for nuclear power plants. Overexposure to ionizing radiation may damage living tissue and could cause severe health problems (i.e., mutations, radiation sickness, cancer, and death). Cytogenetic bio-dosimetry has the great advantage to take into account the inter-individual variation, and it is informative even when physical dosimetry is not applicable; moreover, it is the definitive method to assess exposure to ionizing radiation recommended by the World Health Organization (WHO). Such a procedure involves counting the frequency of dicentric chromosomes (DCs), which are the most studied chromosomal aberrations used as absorbed radiation biomarkers, during the metaphase of cells. A set of algorithms, tested on different programming languages to automatically identify DCs, is analyzed by the authors together with an Automated Dicentric Chromosome Identifying software (ADCI) mostly based on OpenCV programming libraries. The purpose of this work is to review the main results regarding the correlation between ionizing radiation and dicentric chromosomes in cytogenetic bio-dosimetry.
1 Introduction
Ionizing radiation can release energy upon interaction with the matter [1]. Directly ionizing radiation releases energy through Coulomb interactions with the orbital electrons of the absorbing medium [2]. Indirectly ionizing radiation releases energy through a two-step process. The first step involves primary radiation undergoing an initial interaction with the absorbing medium, forcing the release of charged particles. The second step involves directly ionizing charged particles depositing energy through Coulomb interactions with the orbital electrons of the medium [3].
Generally, during primary interactions, photons tend to release electron/hole pairs or electron/positron pair, through different processes such as the photoelectric effect, Compton scattering, and pair production interactions. The probability that these interactions occur depends on the energy of the photons and the physical properties of the absorbent materials [31, 44].
As previously mentioned, in cytogenetic bio-dosimetry irradiated blood samples are analyzed to score chromosomal aberrations [45]. In vitro samples are taken from experimental laboratories to study the number of chromosomal aberrations after they have received fixed absorbed doses, or in vivo, where samples are taken by radiotherapy patients or directly from nuclear accident victims to analyze the amount of absorbed dose and predict their future health consequences [46,47,48,49]. When the entire body is homogeneously exposed to radiation, the scenario is the irradiation of the whole body, whereas if the exposure takes place in a localized area of the body, the scenario is partial body irradiation (PBI).
Depending on the nature of the radiation, LET describes how much energy an ionizing particle transfers to the material transverse per unit distance (i.e., γ-rays and α-particles are considered low- and high-LET, respectively) [50, 51]. Based on the nature of the radiation, chromosomal damage is caused by discrete energy deposition traces in time and space which are produced by ionizing radiation. It is shown that low-LET radiation can produce localized clusters of ionizations within a single electron track; meanwhile, high-LET radiation produces a larger number of ionizations that are close in spatial extent [51, 52].
The most studied chromosomal aberrations are DCs; a DC is an abnormal chromosome with two centromeres. In the first generation and post-irradiation, the acentric chromosome resulting from dicentric formation is not lost and the fusion of two chromosome segments results in the formation of one DC [53]. DCs have an extra centromere than normal chromosomes, but depending on the shape of the chromosome, identification of the narrowest part can be subtle on certain metaphase chromosomes [53, 54]. DCs frequency is crucial in the diagnosis of radiation exposure because a high frequency of DCs is an index that the individual was exposed to a high radiation dose.
Another studied chromosome aberration is called ring chromosomes or centric rings; they are an exchange between two breaks on separate arms of the same chromosome and are also accompanied by acentric fragments (chromosomes without centromere) [51, 53, 54]. The further cytogenetic assay is based on the study of micronuclei, chromosomal aberrations that can form during anaphase, when part of a chromosome or an entire chromosome is not included in the nuclei of daughter cells [51, 54, 55].
Biological dosimetry has progressed from an initial research idea in the 1960s to a variety of research programs developed all around the world and has been based on the analysis of DCs aberrations, which is the most frequent technique (the only one for a long time). Since then, this field has progressed to become a standard in most of the radiation protection programs and its application in radiation exposure cases has shown its importance [56, 57]. Chromosomal aberrations are a dosimeter providing very important information for nuclear or radiological accidents; all this bio-dosimetry information is compounded to get a trustable appraisal of the cases. Today there are many new and emerging assays being tested as markers of both radiation exposure and effect (i.e., individual cancer susceptibility) [57, 58].
2 Cytogenetic Bio-dosimetry
Generally, during accidents involving exposure to ionizing radiation, information on the dose absorbed by the individual is difficult to obtain. In these situations, biological dosimetry can play a key role in the evaluation of the absorbed dose. This type of dosimetry is based on the estimation of changes in a biological system following exposure to ionizing radiation [26, 46, 59, 60].
Despite all the efforts and the need to have a biological dosimeter (especially for low absorbed doses), its development has been hindered by the lack of adequate analytical methods able to fully utilize the information deriving from exposed individuals. In particular, a biological dosimeter refers to a substrate or system, present in body fluids, which respond directly to continuous exposure to radiation on the entire body or for partial exposures, both at low doses and at low dose ratios. Body fluids, such as blood, have the advantage of being easily withdrawn, even in series, without causing any damage or discomfort to the exposed individual [60].
Theoretically, a biological dosimeter should have the following characteristics: (1) Its response should be dependent on the radiation dose received over a sufficiently wide dose range, and specific to the type of radiation to which it has been exposed; (2) must have a remarkable sensitivity, able to distinguish on biological basis responses between 0.1 Gy and 1 Gy; (3) the selected substrate must be present throughout the body so that it can be detected even in the presence of partial exposure; (4) must have “memory”: the response of the substrate to radiation should remain for an extended period to allow the assessment of the dose received and thus the damage suffered after exposure; (5) samples should be easy to find and the dosimetric procedure shall be sufficiently simple so that it can be used by routine in health and radiation protection procedures [61, 62].
In the search for a biological dosimeter, procedures based on variations of metabolic, hematological, or genetic processes were considered, such as biochemical indicators, lymphocyte counting, and the presence of chromosomal aberrations. Ionizing radiation can alter all types of cells causing different degrees of damage. However, the doses needed to produce the same effect in different cell types are very different. The average energy deposit of ionizing radiation necessary to cause an ionization phenomenon is about 20–30 eV [48, 63]. Considering that the chemical bonds of the organic components can disintegrate with the absorption of energy equal to 1–2 eV, it is concluded that any biological structure can undergo alterations of some entity, even temporarily. Also, even after exposure to lethal doses throughout the body (> 5 Gy), the total energy variation that can be measured (total measurable chemical variation) is very small. The macromolecules, like enzymes and proteins, inside the cells, are numerous and represent large reserves of functional capacity [60].
As previously mentioned, the search for a biological dosimeter has been directed to particularly radiosensitive and target cells as irreplaceable cell structures; or structures that if damaged are not repaired correctly [64]. Consolidated examples are chromosomes and DNA molecules involved in regulation and cell division. Much of the experimental work on finding a reliable biological dosimeter has been directed toward the study of chromosomal damage, particularly in PBLs. It has been proven that lymphocytes are the most appropriate system among blood cells for biological dosimetry [46, 65].
The reasons for choosing lymphocytes as a biological dosimeter are four: (1) Lymphocytes by nature are extremely radiosensitive; (2) they are distributed in all tissues of the human body, are present in any exposure, and can be easily extracted from peripheral blood (1 ml of blood may contain up to 3 × 10⁶ lymphocytes). Thanks to this, lymphocytes can also be used as indicators in cases of partial irradiation. (3) They are differentiated cells, synchronized in the G0 phase. This phase, also called the "resting phase", is a period of the cell cycle in which cells exist in a quiescent state outside of the replication state [66]. Some of these lymphocytes live for many years. In healthy people, they are only rarely involved in mitotic proliferation and, therefore, chromosomal aberrations accumulate with the result that an analysis can be made of them even after a long time since the incident. (4) The number of chromosomal aberrations of interest in lymphocytes (high dose DCs or multicentric configurations) depends on the dose received and their distribution in cells follows the distribution of Poisson [35, 46, 48, 67, 68].
Biological dosimetry plays a key role both in radiation protection and in the medical treatment of individuals exposed to radiation. It is extremely relevant during the diagnostic phase to establish the prognosis for subsequent care needed. In the situations where overexposure is suspected and in the absence of physical dosimetry or presence of unrealistic data, analysis of chromosomal aberrations (CAAs) in PBLs provides key information. The CAA technique may also provide information on dose distribution, whether it is whole-body or partial exposure [69, 70].
In investigating ionizing radiation incidents, it is vital to assess the absorbed dose. In the case of acute exposures where the absorbed dose is high (> 1 Gy), this information makes it possible to plan the therapy and to warn the healthcare professional of probable deterministic consequences on the health of the exposed individual (e.g., tissue damage) which may occur in the following weeks or months [71]. For exposures below that level, which may still require medical treatment, dosimetry is important to adequately inform the person about the risk of late stochastic disease (i.e., tumors) [72].
Other symptoms that may occur immediately after exposure to the whole individual (total body) may be used for dose assessment but cannot be considered as a strictly dosimetric method. Thus, as mentioned above, although other biological indicators for use as a dosimeter have also been identified, cytogenetic changes in PBLs are today the most credible indicator of an absorbed dose [73].
The most commonly used method for estimating radiation damage in exposed individuals is the analysis of CAAs in lymphocytes. The standard procedure requires the use of a minimum amount of blood (0.3–0.4 ml) to which is added as a mitogenic agent (PHA) in a culture medium [32]. The whole is then incubated for 48 h at 37 C and 5% CO2 [74, 75]. T-lymphocytes, which are stimulated by PHA, are the cells that go into mitosis allowing chromosomes to be visible during metaphase. Lymphocytes block in metaphase with the addition of colcemid three hours before cell collection. Lymphocytes should then be fixed with methanol and acetic acid (3:1), dropped on wet microscope slides, left to dry in the air, and stained with Giemsa or FPG (Fluorescence Plus Giemsa). FPG technique is used only when the bromodeoxyuridine (BUdR) has been added to the culture [76]. The metaphases must be analyzed with the aid of an optical microscope. Chromosome abnormalities should be counted, and aberrations should be related (dicentric and rings) to the dose received. At very low radiation doses, chromosomal aberrations, in particular dicentric aberrations, are rarely induced and this constitutes the greatest limitation of this method [46, 48, 63].
There are at least three reasons why very low doses cannot be revealed: The first is related to the fact that the damaged DNA could be repaired through cell repair processes during the 48 h needed for lymphocytes to proceed to mitosis. Unstimulated lymphocytes have been hypothesized to be susceptible to intermitotic death without significant intracellular repair and that the repair of lymphocytes only takes place after their stimulation with mitogenic agents [76, 77]. The second reason is that cells that have suffered excessive chromosomal damage may not survive and do not induce mitosis. It has already been experimentally proven that damaged cells are accumulated in the G2 phase of the cell cycle and thus, by analyzing lymphocytes in metaphase, a large amount of information on the extent of the damage is lost. The third reason is related to the method: Only T-lymphocytes are stimulated with PHA and therefore B-lymphocytes, which are more radiosensitive, cannot be analyzed [77].
As mentioned above, the biological dosimetry methodology developed during the 1960s is based on the research of chromosomal aberrations in PBLs and is widely used for the assessment of the overdose dose. The classical cytogenetic methodology involves the culture of these lymphocytes in the presence of mitogenic elements in such a way that the cells continue their cell cycle and the analysis of chromosomal aberrations in the metaphase, like DCs and rings. In people not exposed to radiation, the presence of DCs is very rare. It is reported that one dicentric per 1000 cells analyzed can be found [46, 48, 63]. The low level of baseline dicentric chromosome frequency (1 in 1000 cells with a frequency of 0.001/cell) makes it difficult to estimate the doses precisely below 0.05 Gy. According to the IAEA manual [33], a minimum of four dicentric chromosomes in 1000 cells is required for dose estimation above background. Scoring a large number of cells (5000–10,000) is often recommended for detecting low dose exposures (< 0.1 Gy) for statistically significant results [33].
DCs, which are 10 times more frequent than the rings, are usually accompanied by chromosomal fragments, the existence of which becomes a criterion for their counting and the frequency of their presence is a function of the absorbed dose. Using these aberrations as an index of exposure, the absorbed dose is determined by calibration curves, which are constructed as a result of the in vitro irradiation of peripheral blood. These calibration curves, modeled for low-LET radiation like γ-rays, are of the quadratic linear type (Fig. 1):

Dose–response curves for high-LET (linear progression) and low-LET (linear quadratic) curves
where:
-
f is the number of dicentrics found per cell
-
D is the absorbed radiation dose expressed in gray
-
y0 is the frequency of detection in the background (non-irradiated cells)
-
α and β are coefficients that depend on the type of radiation used. In particular, α is the linear coefficient of the curve and β the quadratic coefficient of the dose [46].
The situation is different for high LET radiation (alpha particles, neutrons, or heavy ions) as a single track can produce the two lesions leading to a DC. Decreasing the dose does not alter the production of DCs because repairing injuries during longer exposures is not a factor that can affect their production (both injuries are produced by a single trace at the same time) [78]. Considering what has been analyzed, it becomes clear that the shape of the dose–response curves in biological dosimetry depends on the LET and therefore on the quality of the radiation. In particular, DCs produced by low-LET radiation are inherently unstable. This is due to the short lifetime of the PBLs and their replacement after the multiplication of predominantly bone marrow cells. These new cells no longer carry aberrations incompatible with cell division. Generally, the half-life of lymphocytes is considered to be 3 years; however, a decrease of up to 95% of this time has been observed with high-dose radiation therapy [46, 48, 78, 79].
The method of PCC may be used to determine the absorbed dose in a short time. The method involves interphase cell fusion with host mitotic cells. In general, chromosomes in eukaryotic cells are only visible for a short period during the cell cycle, that is, during mitosis [80].
The chemical fusion-induced cell fusion technique allows us to visualize chromosomes even in interphase cells. When interphase cells are fused with cells in mitosis, the nucleus of interphase cells, influenced by mitogen factors present in the cytoplasm of mitotic cells, undergoes the condensation of their chromatin, which is rapidly followed by the dissolution of the nuclear membrane and further condensation of chromatin up to the formation of separate chromosomes [81, 82]. The morphology of the prematurely condensed chromosomes reflects the position of the interphase cell in the cell cycle at the time of fusion, for example, single chromatids for the G1 phase, double chromatids for the G2 phase, and regions with powdered chromosomes for the S phase [81, 82]. The method offers great advantages as the direct CAA in PBLs chromosomes (both T and B) [83, 84]. Besides, this technique is rapid because it avoids the 48-h culture and any complication resulting from peripheral blood culture. It is applicable at high doses (since cells should not reach mitosis) to all types of cells (no pre-culture required) and can be useful for a dose assessment in the presence of partial doses and not only for whole-body exposures (can also be applied to skin cells). As a result, this method can be used as a biological dosimeter once the dose–response calibration curves have been constructed in vitro [85].
The PCC technique can be applied immediately and at varying times after irradiation to investigate in vitro the kinetics of aberration formation and their repair at various radiation doses in lymphocytes not stimulated human peripheral blood. In particular, with this method, information on exposure may be obtained 3–4 h after receipt of blood after exposure to ionizing radiation. The non-cell division required by PCC avoids artifacts associated with post-irradiation stimulation as well as cell cycle continuation, events that may interfere with the analysis. Even for accidents involving doses higher than 5 Gy, the cells can safely go into condensation, but it could not reach the metaphase (case of the traditional technique). The PCC technique is particularly useful for this type of situation [86].
The consequence of the above is the uncertainty on the assessment of the dangerousness of overexposure to ionizing radiation since the classical methodologies used today on a large scale for dose assessment are based on (1) the detection of unstable chromosome aberrations (DCs and rings); (2) on increasing the frequency of neo-plasma diseases based on studies referring to high doses and high radiation dose rates; (3) on the assumption of the linear extrapolation of the consequences from high doses to low doses without having yet defined the mechanisms of action and danger of low doses; (4) on the assumption that all members of the population have the same sensitivity to ionizing radiation [46, 48, 78, 79].
It is clear at this point that the existence of stable chromosome aberrations due to exposure to ionizing radiation is limited in time (these chromosome aberrations can last up to three years). For the exposures that occurred in the past, it is necessary to develop a biological methodology that can give a response to the dose received. A considerable number of people have been exposed to various levels of radiation as a result of different events, incident, nuclear tests on the earth’s surface, and overexposures of workers using ionizing radiation, such as in the cases of Hiroshima and Nagasaki [87, 88], Chernobyl [89, 90], Tomsk [91, 92], and the most recent disaster at the Fukushima Daiichi nuclear power station [27, 93]. In all these cases, bio-dosimetry studies have been used to apply cytogenetic methods. Today, a retrospective evaluation of absorbed doses (retrospective dosimetry) is considered indispensable to be able to use the results in epidemiological studies concerning the health of these individuals after radiation exposure.
Ionizing radiation, in fact, also causes stable chromosomal aberrations that are compatible with cell division, thus allowing to evaluate the absorbed dose by an individual even after many years [27, 46, 48, 63]. These aberrations are recombinations and translocations of chromosomal material such that the genome as a whole remains stable. It is, therefore, these balanced aberrations in genes that can be detected in PBLs even after several decades [94]. In the 1960s, within joint studies between U.S. Air Force and NASA, irradiations of monkeys and studies on chromosomal aberrations were performed which were highlighted 28 years later [95]. The detection of stable chromosome translocations in laboratory cells thirty years later at the same levels as those produced immediately after irradiation in vitro is a clear demonstration of the permanence of such aberrations in the exposed population [96].
The great importance of stable chromosomal aberrations lies in the fact that they can be used in the assessment of the dose absorbed by an individual even after many years of accidental exposure. Besides, their formation appears to be closely linked to the mechanisms of carcinogenesis and their study could contribute significantly to understanding the carcinogenicity of ionizing radiation [93]. Studies for the development of biological dosimetry methods and in particular the assessment of past accidents are directed toward the detection and quantification of stable chromosomal translocations occurring after exposure to ionizing radiation. The method used is the GTG-banding of the chromosomes with trypsin and Giemsa, which allows the unequivocal definition of each chromosome. As a result, structural inconsistencies of two or more chromosomes that normally occur as translocations or exchanges of chromosome material may be identified [48, 97].
For rapid detection and quantification of stable chromosome aberrations in peripheral blood samples after overexposure to ionizing radiation as an alternative method to GTG-banding of chromosomes, cytogenetic methodologies may be used in combination with molecular genetic techniques; an example is FISH assay [96]. The method allows homogeneous staining of selected chromosomes with the use of molecular probes (DNA probes) that carry fluorescent substances. The use of different fluorophores for the coloring of non-hybridized chromosome areas simplifies the detection of chromosomes thanks to the onset of dichromy. Using this method, especially in the evaluation of a recent accident, has disadvantages as it presupposes a good cell culture and a good subsequent analysis of the lymphocytes in the metaphase [98].
If the in vitro activation of lymphocytes with mitogenic factors is unsuccessful or the mitotic index is low, such as in cases where the radiation dose is high, or after partial irradiation and not on the whole body, where statistically chromosomal aberrations do not follow the distribution of Poisson, there is undoubtedly a particular selection in the cellular population that is concentrated in the metaphase and therefore of the complications in the application of the method [99]. Moreover, as already described, this method applies only to the chromosomal analysis of T-lymphocytes and not B-lymphocytes, in which there may be important chromosomal translocations. Therefore, delays in the cell cycle and general different kinetics of lymphocytes with chromosomal aberrations series will result in the sample, which is analyzed 48 h after culture, no longer being representative [100]. Recently, to overcome this problem, the techniques previously analyzed were used in parallel; or combined the FISH technique with the PCC technique for the analysis of unstable chromosome aberrations directly in PBLs during metaphase. This method allows the direct quantification of aberrations and the evaluation of the absorbed dose in the metaphase, thus avoiding a 48-h delay and the complications arising from peripheral blood culture [96].
The assessment of an absorbed dose using calibration curves confirms, on the one hand, the exposure to radiation, on the other hand, contributes to the assessment of the hazard of this exposure. As shown by studies on the survivors of Hiroshima and Nagasaki, knowledge of the absorbed dose is an indication of both the danger and the incidence in develo** malignant tumors [101]. This method considers that a defined dose of radiation is equally dangerous for all members of the population without distinction [102, 103]. This assumes that the same number of chromosomal aberrations is a consequence of the dose received by each individual, considering that all members of the population have the same sensitivity to ionizing radiation. It should also be considered that among the population there are individuals who are particularly sensitive to radiation; in addition to this, the presence of subjects carrying mutated genes that are characterized by an increased chromosomal sensitivity to the radiation effect and simultaneously express a predisposition to carcinogenesis must be considered [48, 104, 105].
3 Radiation-induced DNA damage and repair
The radiosensitivity among different members of the population does not affect human PBLs as they represent a predominantly located cell population (99.8%) in a pre-synthetic stage of cell cycle DNA (phase G0) and, without stimulation, do not enter mitosis. It is consolidated in the literature that after the in vitro irradiation of PBLs of both healthy and syndromes-bearing individuals that make them particularly radiosensitive, there are no substantial differences in the number of chromosomal aberrations per cell at various ray doses and this because they are all irradiated while they are in the G0 phase of the cell cycle [106, 107]. This experimental evidence is the basis for which “universal” calibration curves can be created. The fact that each laboratory must have its own, is based on the different response of lymphocytes to radiation from place to place and to the diversity of the operators who process methods and carry out the analysis of the results.
Regarding the cells that enter mitosis without stimulation (i.e., the spinal cord cells), it becomes interesting to evaluate the danger of overexposure and to understand the mechanisms of individual radiosensitivity among the population and also to understand which elements establish such chromosomal radiosensitivity [108, 109]. Knowing the elements that establish the individual and his chromosomal radiosensitivity, could become the indispensable biological basis for the development of such methods as to be able to identify particularly sensitive members of the ionizing radiations.
In the case of accidents involving important radiation sources, when first responders, firefighters, or groups of selected plant personnel are called upon to intervene, prior knowledge of any particular radiosensitivity of the personnel is of primary importance [57, 94, 110]. It is, therefore, necessary to indicate the mechanisms that govern the variability of the cell's radiosensitivity at the genetic level and, in particular, in the various phases of the cell cycle.
The first description of the cell cycle is already offered by studies on the relationship between chromosomal aberrations generated by ionizing radiation and cell DNA duplication [79, 111, 112]. The cells double their genetic material during the synthesis phase (phase S), which follows a phase known as G1, and separates from the cell mitosis (phase M), with a second phase called G2. As the cells complete this cycle, their radiosensitivity varies. The middle and final parts of the synthesis and the G1 phase are known as radioresistant phases, while the mitosis and the passages from G1 to S and from G2 to phase M are particularly sensitive to radiation [57, 79, 94, 110,111,112,113]
In order to explain this variation in terms of sensitivity, as well as an elongation of the intermediate phases G1 and G2 after exposure of the cells to radiation, many probable mechanisms have been proposed. A first hypothesis concerned the variation of radiosensitivity related to the organization of chromatin during irradiation. However, it was not possible to explain the important increase in cell radiosensitivity during the transition from G1 to synthesis (G1/S border) [57, 94, 111,112,113,114,115]. A second explanation is that the radiation causes a different number of DNA-DSBs depending on the phase in which the cell cycle is found. It is widely known that DNA-DSBs lead to the formation of chromosomal aberrations and their number does not vary throughout the cell cycle [69, 77, 116]
The most widely accepted explanation of the different radiosensitivity in the cell cycle is based on the fact that the cell's ability to repair the damage is different at various stages [117]. Even though cells suffer the same damage per unit of DNA at any time in their cell cycle, the effectiveness of DNA-break repair mechanisms is different, thus establishing the variability of radiosensitivity in the various stages of the cycle [118].
Cell's ability to repair the damage was found to be similar at all stages of the cell cycle even though the chromosomal aberrations encountered were different. In particular, when the cells are irradiated in their most sensitive phase, that is during metaphase, the chromosomes present themselves intact, despite the presence of a large number of DNA-DSBs; the repair rate of these breaks was found to be similar to that of exponential cell growth [117, 119, 120]. Besides, in radiosensitive cell lines that exhibit the same repair rate as DNA-DSBs compared to normal lines, they show a high level of cell death. Radiation damage does not depend on the speed with which DNA-DSBs damage is repaired, but on a biochemical process that transforms molecular aberrations into chromosomal aberrations. The effectiveness of this process depends on genetically defined cell cycle control elements and is greater in the more sensitive phases of the cell cycle [69, 77, 116,117,118,119,120,121,122].
4 Automatization of dicentric chromosome assay
It is important to evaluate as many samples as possible in a very short time for the large-scale nuclear accidents. An efficient method for scaling up the assay is to introduce automatic evaluation methods.
The segmentation of chromosomes is a more complex task than the automatization of other bio-dosimetry assays. For example, the shape of the objects that have to be identified during a micronucleus assay is circular and more-or-less homogeneously stained [123, 124]. On the contrary, the shape and orientation of the chromosomes cover a wide parameter range which requires more advanced image processing algorithms.
The automatic algorithm can be added to three separate parts of the process of the identification of DCs which starts with the saved images as input and ends with the number of DCs as output: (1) metaphase finder; (2) chromosome segmentation; and (3) centromere localization. The realization of the first two parts has rich literature since besides DC assay they are also used for karyoty**. However, for the localization of the centromeres only a few methods have been developed in the last decade [23, 125,126,127,128,129]. The greatest challenge is to make a difference between the intersection of overlap** chromosomes and real centromeres.
As a partial solution the combination of automatization and visual scoring, the so-called semi-automatic scoring, is also popular. For example, finding metaphases can be done by a separate metaphase finder, then a gallery of the chromosomes is made available for further manual dicentric inspection [94, 130].
According to the published data, until now the algorithm that has the highest efficiency is the so-called Automated Dicentric Chromosome Identifier (ADCI). In order to demonstrate the required complexity of such an algorithm, the key steps are summarized in the next chapter.
5 Automated dicentric chromosome identify—ADCI
ADCI is a set of algorithms that were originally developed for MATLAB programming language to automatically identify chromosomes and then locate centromeres accurately and quickly for dicentric analysis. To speed up the image processing, these algorithms have been converted to a C + + /OpenCV ADCI software version including process parallelization [23]. The current ADCI system is comprised of 6 functional modules: metaphase ranking (ranking), chromosome classification (classifying), gradient vector flow contour extraction (GVF), discrete curve evolution (DCE), centerline interpolation (interpolation), and centromere detection (centromere). Additional modules and their related algorithms are under development. Examples are sister chromatid separation with integrated intensity Laplacian and chromosomes separation (Fig. 2) [28, 127, 128].
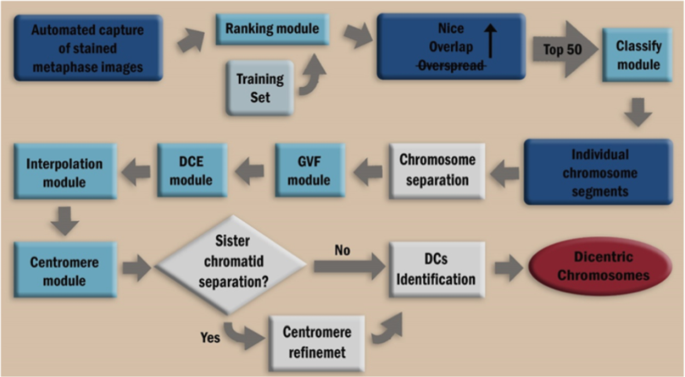
Flowchart of the ADCI system. Blue boxes depict data in ADCI. Light blue boxes represent current functional modules. The strikethrough indicates that overspread images are discarded
In addition to the previously mentioned modules, ADCI designed for interactive use in desktops (which is referred to as ADCI desktop), has a GUI module. ADCI cluster designed for large-scale event management is run on high-performance computing clusters and has a planning module. In the classification module, ADCI performs a preliminary selection of suitable metaphases for further analysis and also analyses pre-processes of metaphases [28, 127]. The ranking algorithm combines content extraction and classification of metaphases to select the optimal candidates for DCs identification. Cytogenetic information such as the number of separated connected components (blob) and the average length of separated blobs is also collected. The chromosome classification (classifying) module will determine whether the input blob is a single chromosome or more overlap** chromosomes [28, 125,126,127,128].
The current algorithm used (as well as the best performing), is a variant of the algorithm proposed by Rizvandi et al. 2008 [131]. It generates and cuts a first central line for an input blob and then counts the number of common parts of the central line. If there are one or more common parts, the input blob is considered as a chromosomal cluster; otherwise, it results as a single chromosome. The individual chromosomes are analyzed through further steps with the DCA [126, 131]. GVF contour extraction is one of the key components in ADCI, which produces a very descriptive contour for the input chromosome. The initial contours of the chromosomes are obtained thanks to the segmentation of the threshold, which is not very regular [126, 127, 131]. The active contours (or “snakes”) are curves that can either move under the effect of internal energy from the shape of the curve or through the effect of external energy from the data in the photo [127]. A parametric curve is expressed as Eq. (2):
Given an initial outline, the energy of this is defined as in Eq. 3:
The part between the square bracket represents the internal energy function in which the parameters a and b, respectively, control the voltage and the rigidity of the active profile. The function Eext(x(s)) indicates the external energy coming from the data in the image. The active contour can expand or shrink from the initial contour minimizing the energy defined in Eq. (3), making the curve a function of time [28]. An equation of minimization of the active profile 3 must satisfy the Euler Eq. (4):
In the GVF snake model, the gradient vector represents the flow vector field (V in Eq. (5)). The parametric curve that can solve Eq. (5) is a GVF snake, which is the final contour obtained from the GVF module for chromosomes.
The gradient vector flow in Eq. (4) is defined as a vector field V(x, y) = [u (x,y),v(x,y)] and can be acquired by minimizing the energy function in Eq. (6):
The f in Eq. (6) represents the map of the edges of the input image and can be any gray-level or binary boundary map defined in image processing, while ∇f is the gradient of the site map. Unlike other active contour methods, the GVF snake has two advantages: First, the initial curve for the GVF snake can be flexible, and also the GVF snake can facilitate the convergence of the curve to its boundary concavities [128, 132].
The normal morphological methods that generate the central line of an object, such as the skeletonizing, will lead to the formation of additional branches in the central line of a chromosome. To obtain central lines without a branch, they must be pruned [127, 128]. The discrete curve evolution (DCE) algorithm decomposes a 2D object by generating a polygon, which highly represents the 2D input object. Skeletal pruning, with the help of the polygon deriving from the DCE, is one of its important applications. In ADCI, a triangle is obtained by DCE for long chromosomes and this indicates which branches in the central line should be pruned. The central lines of the short chromosomes are obtained by thinning [28, 127, 128].
To get a curve to exactly represent a chromosome centerline, interpolation is used which connects the discrete centerline. In numerical analysis, when only some of the data points are known, interpolation is widely used to construct new data points. Interpolation is close to function approximation except that the latter does not return new data points but can be used to calculate new data points [23, 28, 128]. In ADCI, the cubic spline interpolation is applied on both the x and y axes for a discrete centerline. Since the final polygon with DCE is a triangle, a central line obtained after interpolation still retains one shorter branch. This extra branch is located at the end of a central line, which means that a central line is composed of a long branch and two smaller branches. These last two branches are pruned, and the main branch will retain most of the information requested [127].
In ADCI, centromeres are searched through the centerlines obtained from DCE and interpolation modules by combining the intensity and width information along chromosomes. Chromosome's shapes are represented by the contours acquired thanks to the GVF module [23, 28, 127, 128]. Along the central line, virtual lines (referred to as trellis) perpendicular to the central line are generated at a unit length, with a line corresponding to a region in the central line [128].
The combined information in each region of the central line will be calculated along the corresponding line in the trellis. Intensity information through a line is weighted through a Gaussian function, which helps reduce background noise at the boundaries of chromosomes. The width information is counted as the length of a line in the truss. These two sets of information are combined in a series of profiles [23]. The first centromere is located by finding the global minima in the profile settings. Then, a regional mask covering a small neighborhood of the first centromere is applied in the profile settings, and the second global minima are found in the masked profile set [126, 131]. If the first and second minima are far enough, this chromosome is determined as a DC; otherwise, the first and second minima are assigned to the same centromere, thus resulting as a monocentric chromosome [23, 28, 125,126,127,128, 131, 132].
6 Machine learning and artificial intelligence algorithms: challenge of the future
In addition to the topics covered previously, there is a wide range of algorithms aimed at improving imaging tools in the medical field, thanks to the use of techniques such as machine learning, artificial intelligence, and deep learning.
Thanks to the high amount of health data currently available and the enormous progress in image acquisition devices, the data are remarkably numerous (moving toward big data), which makes image analysis challenging and interesting. This rapid growth in image acquisition and medical modalities requires a great deal of work on the part of healthcare professionals; however, the acquisition of these data could be prone to human error and may have large variations between different experts [133,134,135]. One solution to this problem is to use machine learning techniques to automate the diagnosis process. Nonetheless, traditional machine learning methods are not enough to tackle complex problems. The combination of high-performance processing and machine learning promises the ability to process large medical image data for accurate and efficient diagnosis [134, 136]. Deep learning will not only help to select, evaluate and extract characteristics but also extrapolate new ones; moreover, it will not only be able to diagnose the disease but will be able to predict its evolution, providing reliable prediction models to help healthcare professionals efficiently [134, 136, 137]. Machine learning and artificial intelligence have evolved rapidly in recent years. These have played crucial roles in healthcare such as image processing and interpretation, assisted diagnosis, image-guided therapy, image retrieval, and analysis. Consequently, machine learning techniques extrapolate information from images allowing them to be analyzed quickly and efficiently [136]. Machine learning and artificial intelligence assist and facilitate healthcare personnel to be able to accurately and quickly diagnose and predict the risk of disease. These techniques provide healthcare professionals and researchers tools to understand how to evaluate and analyze the different genetic variations that will cause diseases [138,139,140]. These techniques composed of conventional algorithms without learning like support vector machine (SVM), neural network and deep learning algorithms such as convolutional neural network (CNN), recurrent neural network (RNN), long short-term memory (LSTM), extreme learning model (ELM) and generative adversarial networks (GANs) [136] (Fig. 3). Previous algorithms have limitations in processing images in their raw form; they rely on specialist knowledge and take a long time to set up. The algorithms that are currently being developed are fed with raw data and have rapid and automatic functions. These algorithms seek to automatically learn in multiple levels of abstraction, representation, and information from a large set of images that show the desired data behavior [134, 136].

Neural network architecture. This is the most common structure for neural networks: three layers with full inter-connection. The input layer nodes are passive, doing nothing but relaying the values from their single input to their multiple outputs. In comparison, the nodes of the hidden and output layers are active, modifying the signals. The action of this neural network is determined by the weights applied in the hidden and output nodes
Although automated disease detection, based on conventional methods in medical imaging, has shown significant accuracy over the past decades, new advances in machine learning techniques are currently focusing on deep learning. Deep learning-based algorithms have shown promising performance and speed in several domains such as speech recognition, text recognition, lip-reading, computer-assisted diagnosis, facial recognition, tumor detection, and the discovery of new drugs [134, 136, 139].
7 Conclusion
ADCI has the extraordinary ability to analyze significant amounts of cytogenetic bio-dosimetry data generated as a consequence of a large-scale radiological event. Thanks to this type of automation, the laboratories' ability to process samples and obtain metaphase image data has been vastly increased worldwide. Obtaining a standardized model, opened and widespread globally, would create the possibility of generating different metaphase image data standards in multiple cytogenetic bio-dosimetry laboratories, such as to make each of them personalized to use their selection of images.
Data, samples, and images that have been analyzed would be saved and processed in parallel via a cloud-based system that runs ADCI, estimating the exposures for all samples at the same time in a rapid sequence. The ideal approach would be to leverage existing laboratory infrastructure; however, replacing them with this automation in large commercial laboratories cytogenetics may be able to fulfill any bio-dosimetric test needs in large-scale radiological events. Rapid triaging that uses fewer metaphase images or further analyzes micronuclei, biomarkers in urine, miRNA or RT-PCR has been proposed as valid alternatives to DCA; nevertheless, these approaches may not be sufficiently accurate to distinguish the persons suitable for the treatment such as subjects with exposures > 2 Gy.
Over the past few years, rapid biological tests have been developed for the evaluation of triage in potentially exposed populations; however, the large-scale implementation of these tests does not yet have specific demonstrable frameworks. Reproducibility estimates were in the majority of cases theoretical and based on the execution of the assays themselves, later relating them to large populations. The details relating to the instrumental capabilities, the availability of critical reagents and the adequately trained personnel to carry out and interpret these tests have not been outlined in the concept of operations. However, physical doses may not be identical to biological doses but may be partially related. Spectral clustering and geostatistics can be used to determine the minimum number of data points that are needed to build a similar distribution. Nonetheless, the difficulty of the calculations necessary for spectral clustering becomes proportionally prohibitive in the function of large data sets.
In cases of large-scale radiological events and in patients requiring rapid intervention and treatment, ADCI could be an instrumental resource for their rapid identification. Depending on the population density, ADCI software can identify the DCs and estimate the dose of a population within an exposed area in about 4 days. However, ADCI only accelerates image processing and identification of DCs. The retrieval of samples, the preparation of cells in metaphase, and the acquisition of images of DCs make it impossible to test a large number of individuals. Sampling and testing requirements can be reduced by geostatistical sampling. This consists of a method for estimating the spatial boundaries of a region using small subsets of samples in different areas. The implementation of these methods can limit the number of patients who require tests, thus reducing the time of retrieval of the samples necessary for first responders, speeding up the identification of those who require treatment in scenarios where time and resources are limited. Although this causes a significant reduction in processing time using the ADCI software, there are still potential improvements that can be implemented in this software such as a normal bio-dosimetry laboratory routine. Even if a new ADCI has been developed, called ACDI-HT (high-performance ADCI), which has been evaluated as faster than the conventional ADCI, its use requires access to new supercomputers, which may not always be guaranteed; for this reason, the increase in the rate of analysis through conventional ADCI is and remains the fundamental technique.
Finally, ADCI results to be a foundation in cytogenetic bio-dosimetry. Obtaining data on the absorbed dose in a short time, especially in patients involved in a large-scale radiological event, is of fundamental importance. In the future, the knowledge of both the absorbed dose and the consequent number of DCs accumulated will allow us on obtaining information on the possible development of tumors thanks to the development of algorithms tested on program languages, machine learning, and deep learning techniques. Moreover, this information will permit us to intervene preventively with adequate cancer treatments.
References
N. Foray, M. Bourguignon, N. Hamada, Mutat Res. (2016). https://doi.org/10.1016/j.mrrev.2016.09.001
M. Zaider, M. Bardash, A. Fung, Int J Radiat Biol. (1994). https://doi.org/10.1080/09553009414551461
J. Berakdar, A. Lahmam-Bennani, C. Dal Cappello, Phys Rep. (2003). https://doi.org/10.1016/S0370-1573(02)00515-X
F. Gao, L.W. Campbell, R. Devanathan, Y.L. **e, Y. Zhang, A.J. Peurrung, W.J. Weber, Nucl. Instrum. Methods Phys. Res. B 255, 286 (2007)
S. Meroli, D. Passeri, L. Servoli, J Instrum. (2011). https://doi.org/10.1088/1748-0221/6/06/P06013
W.P. Chang, B.F. Hwang, D. Wang, J.D. Wang, Lancet (1997). https://doi.org/10.1016/S0140-6736(97)11056-X
M.R. Gilbert, J. Marian, J.C. Sublet, J Nucl Mater. (2015). https://doi.org/10.1016/j.jnucmat.2015.09.023
F. Tommasino, M. Durante, Cancers (2015). https://doi.org/10.3390/cancers7010353
I. Shuryak, H.C. Turner, J.R. Perrier, L. Cunha, M. Pujol Canadell, M.H. Durrani, A. Harken, A. Bertucci, M. Taveras, G. Garty, D.J. Brenner, Sci Rep. (2020) doi: https://doi.org/10.1038/s41598-020-59695-9
J.D. Tucker, Mutat Res. (2008). https://doi.org/10.1016/j.mrrev.2008.04.001
W.M. Court Brown, K. Buckton, A.S. McLean, Lancet. (1965) doi: https://doi.org/10.1016/S0140-6736(65)91889-1
L.E. Feinendegen, M. Pollycove, J. Nucl. Med. 42, 17N (2001)
W. Fendler, B. Malachowska, K. Meghani, P.A. Konstantinopoulos, C. Guha, V.K. Singh, D. Chowdhury, Sci Transl Med. (2017). https://doi.org/10.1126/scitranslmed.aal2408
M. Bunn, Daedalus (2009). https://doi.org/10.1162/daed.2009.138.4.112
K. Akahane, S. Yonai, S. Fukuda, N. Miyahara, H. Yasuda, K. Iwaoka, M. Matsumoto, A. Fukumura, M. Akashi, Environmentalist (2012). https://doi.org/10.1007/s10669-011-9381-2
R. Arora, R. Chawla, R. Marwah, V. Kumar, R. Goel, P. Arora, S. Jaiswal, R.K. Sharma, J Pharm Bioallied Sci. (2010). https://doi.org/10.4103/0975-7406.68502
M.A. Pomper, G. Tarini, AIP Conf. Proc. (2017). https://doi.org/10.1063/1.5009230
V. Garaj-Vrhovac, A. Fucić, D. Horvat, Mutat Res. (1992). https://doi.org/10.1016/0165-7992(92)90006-4
P. Venkatachalam, S.F. Paul, M.N. Mohankumar, B.K. Prabhu, N. Gajendiran, A. Kathiresan, R.K. Jeevanram, Mutat Res. (1999). https://doi.org/10.1016/s0027-5107(98)00238-3
Y. Abe, T. Miura, M.A. Yoshida, R. Ujiie, Y. Kurosu, N. Kato, A. Katafuchi, N. Tsuyama, T. Ohba, T. Inamasu, F. Shishido, H. Noji, K. Ogawa, H. Yokouchi, K. Kanazawa, T. Ishida, S. Muto, J. Ohsugi, H. Suzuki, T. Ishikawa, K. Kamiya, A. Sakai, Sci Rep. (2015). https://doi.org/10.1038/srep13882
J. Kamen, W.Y. Hsu, B. Boswell, C. Hill, Health Phys. (2019). https://doi.org/10.1097/HP.0000000000001095
N. Kumar, A. Dixit, In Nanotechnology for Defence Applications (Springer, Cham, 2019), pp. 117–153
P.K. Rogan, R. Lu, E. Mucaki, S. Ali, B. Shirley, Y. Li, R. Wilkins, F. Norton, O. Sevriukova, D. Pham, E. Ainsbury, J. Moquat, R. Cooke, T. Peerlaproulx, E. Waller, J.H.M. Knoll, bioRxiv (2019) doi: https://doi.org/10.1101/718973
A.O. Langlands, P.G. Smith, K.E. Buckton, G.E. Woodcock, J. McLelland, Nature (1968). https://doi.org/10.1038/2181133a0
J. Hall, P.A. Jeggo, C. West, M. Gomolka, R. Quintens, C. Badie, O. Laurent, A. Aerts, N. Anastasov, O. Azimzadeh, T. Azizova, S. Baatout, B. Baselet, M.A. Benotmane, E. Blanchardon, Y. Guéguen, S. Haghdoost, M. Harms-Ringhdahl, J. Hess, M. Kreuzer, D. Laurier, E. Macaeva, G. Manning, E. Pernot, J.L. Ravanat, L. Sabatier, K. Tack, S. Tapio, H. Zitzelsberger, E. Cardis, Mutat Res. (2017). https://doi.org/10.1016/j.mrrev.2017.01.001
S. Rana, R. Kumar, S. Sultana, R.K. Sharma, J Pharm Bioallied Sci. (2010). https://doi.org/10.4103/0975-7406.68500
E. Pernot, J. Hall, S. Baatout, M.A. Benotmane, E. Blanchardon, S. Bouffler, H. El Saghire, M. Gomolka, A. Guertler, M. Harms-Ringdahl, P. Jeggo, M. Kreuzer, D. Laurier, C. Lindholm, R. Mkacher, R. Quintens, K. Rothkamm, L. Sabatier, S. Tapio, F. de Vathaire, E. Cardis, Mutat Res. (2012). https://doi.org/10.1016/j.mrrev.2012.05.003
Y. Li, J.H.M. Knoll, R.C. Wilkins, F.N. Flegal, P.K. Rogan, Microsc Res Tech. (2016). https://doi.org/10.1002/jemt.22642
A. Giussani, M.A. Lopez, H. Romm, A. Testa, E.A. Ainsbury, M. Degteva, S. Della Monaca, G. Etherington, P. Fattibene, I. Güclu, A. Jaworska, D.C. Lloyd, I. Malátová, S. McComish, D. Melo, J. Osko, A. Rojo, S. Roch-Lefevre, L. Roy, E. Shishkina, N. Sotnik, S.Y. Tolmachev, A. Wieser, C. Woda, M. Youngman, Radiat Environ Biophys. (2020) doi: https://doi.org/10.1007/s00411-020-00845-y
K. Rothkamm, C. Beinke, H. Romm, C. Badie, Y. Balagurunathan, S. Barnard, N. Bernard, H. Boulay-Greene, M. Brengues, A. De Amicis, S. De Sanctis, R. Greither, F. Herodin, A. Jones, S. Kabacik, T. Knie, U. Kulka, F. Lista, P. Martigne, A. Missel, J. Moquet, U. Oestreicher, A. Peinnequin, T. Poyot, U. Roessler, H. Scherthan, B. Terbrueggen, H. Thierens, M. Valente, A. Vral, F. Zenhausern, V. Meineke, H. Braselmann, M. Abend, Radiat Res. (2013). https://doi.org/10.1667/RR3231.1
J.M. Sullivan, P.G.S. Prasanna, G.B. Grace, L.K. Wathen, R.L. Wallace, J.F. Koerner, C.N. Coleman, Health Phys. (2013). https://doi.org/10.1097/HP.0b013e31829cf221
A.A. Awa, T. Honda, T. Sofuni, S. Neriishi, M.C. Yoshida, T. Matsui, Lancet (1971). https://doi.org/10.1016/s0140-6736(71)92505-0
INTERNATIONAL ATOMIC ENERGY AGENCY, Cytogenetic Dosimetry: Applications in Preparedness for and Response to Radiation Emergencies (IAEA, Vienna, 2011).
K. Al-Hadyan , S. Elewisy, B. Moftah, M. Shoukri, A. Alzahrany, G. Alsbeih, 3 Biotech. (2014) doi: https://doi.org/10.1007/s13205-014-0217-x
I. Silva-Barbosa, S. Pereira-Magnata, A. Amaral, G. Sotero, H.C. Melo, Genet Mol Biol. (2005). https://doi.org/10.1590/S1415-47572005000300021
A.J. Sigurdson, M. Ha, M. Hauptmann, P. Bhatti, R.J. Sram, O. Beskid, E.J. Tawn, C.A. Whitehouse, C. Lindholm, M. Nakano, Y. Kodama, N. Nakamura, I. Vorobtsova, U. Oestreicher, G. Stephan, L.C. Yong, M. Bauchinger, E. Schmid, H. Won Chung, F. Darroudi, L. Roy, P. Voisin, J.F. Barquinero, G. Livingston, D. Blakey, I. Hayata, W. Zhang, C. Wang, L.M. Bennett, L.G. Littlefield, A.A. Edwards, R.A. Kleinerman, J.D. Tucker, Mutat Res. (2008) doi: https://doi.org/10.1016/j.mrgentox.2008.01.005
M. Bauchinger, E. Schmid, H. Braselmann, Int J Radiat Biol. (2001). https://doi.org/10.1080/09553000010022382
A. Ivashkevich, C.E. Redon, A.J. Nakamura, R.F. Martin, O.A. Martin, Cancer Lett. (2011). https://doi.org/10.1016/j.canlet.2011.12.025
Y. Lee, Q. Wang, I. Shuryak, D.J. Brenner, H.C. Turner, Radiat Oncol. (2019). https://doi.org/10.1186/s13014-019-1344-7
E.L. Pannkuk, A.J. Fornace Jr., E.C. Laiakis, Int J Radiat Biol. (2017). https://doi.org/10.1080/09553002.2016.1269218
J. Lacombe, C. Sima, S.A. Amundson, F. Zenhausern, PLoS ONE (2018). https://doi.org/10.1371/journal.pone.0198851
E.I. Azzam, J.P. Jay-Gerin, D. Pain, Cancer Lett. (2012). https://doi.org/10.1016/j.canlet.2011.12.012
J.A. Reisz, N. Bansal, J. Qian, W. Zhao, C.M. Furdui, Antioxid Redox Signal. (2014). https://doi.org/10.1089/ars.2013.5489
A.B. Flood, A.N. Ali, H.K. Boyle, G. Du, V.A. Satinsky, S.G. Swarts, B.B. Williams, E. Demidenko, W. Schreiber, H.M. Swartz, Health Phys. (2016). https://doi.org/10.1097/HP.0000000000000538
F. Zakeri, T. Hirobe, Eur J Radiol. (2010). https://doi.org/10.1016/j.ejrad.2008.10.015
H. Romm, U. Oestreicher, U. Kulka, Ann. Ist. Super. Sanita. 43, 251 (2009)
S.S. Acharya, W. Fendler, J. Watson, A. Hamilton, Y. Pan, E. Gaudiano, P. Moskwa, P. Bhanja, S. Saha, C. Guha, K. Parmar, D. Chowdhury, Sci Transl Med. (2015). https://doi.org/10.1126/scitranslmed.aaa6593
Y. Lusiyanti, M. Syaifudin, T. Budiantari, S. Purnami, D. Ramadhani, Genome Integr. (2019). https://doi.org/10.4103/genint.genint_1_19
Y. Pan, J. Ruan, G. Gao, L. Wu, C. Piao, J. Liu, Dose Response. (2019). https://doi.org/10.1177/1559325819833473
D.S. Gridley, M.J. Pecaut, G.A. Nelson, Am J Physiol Regul Integr Comp Physiol. (2002). https://doi.org/10.1152/ajpregu.00435.2001
M. Higueras, P. Puig, E.A. Ainsbury, V.A. Vinnikov, K. Rothkamm, Radiat Prot Dosimetry. (2016). https://doi.org/10.1093/rpd/ncv356
C. Allen, T.B. Borak, H. Tsujii, J.A. Nickoloff, Mutat Res. (2011). https://doi.org/10.1016/j.mrfmmm.2011.02.012
K.M. Stimpson, J.E. Matheny, B.A. Sullivan, Chromosome Res. (2012). https://doi.org/10.1007/s10577-012-9302-3
G. Harfouche, M.T. Martin MT, Mutat Res. (2010) doi: https://doi.org/10.1016/j.mrrev.2010.01.007
W.H. Lee, P.K. Nguyen, D. Fleischmann, J.C. Wu, Eur Heart J. (2016). https://doi.org/10.1093/eurheartj/ehw206
H.J. Cook, N.H. Steneck, A.J. Vander, G.L. Kane, Ann. Sci. (1980). https://doi.org/10.1080/00033798000200271
K. Cho, T. Imaoka, D. Klokov, T. Paunesku, S. Salomaa, M. Birschwilks, S. Bouffler, A.L. Brooks, T.K. Hei, T. Iwasaki, T. Ono, K. Sakai, A. Wojcik, G.E. Woloschak, Y. Yamada, N. Hamada, Int J Radiat Biol. (2019). https://doi.org/10.1080/09553002.2018.1558303
M. Bender, P. Gooch, Radiat. Res. 16, 44 (1962)
D.C. Lloyd, R.J. Purrott, G.W. Dolphin, Nature (1973). https://doi.org/10.1038/241069a0
A. Amaral, Braz Arch Biol Technol. (2002). https://doi.org/10.1590/S1516-89132002000500017
M. Desrosiers, L. DeWerd, J. Deye, P. Lindsay, M.K. Murphy, M. Mitch, F. Macchiarini, S. Stojadinovic, H. Stone, J Res Natl Inst Stand Technol. (2013). https://doi.org/10.6028/jres.118.021
S. Maxwell, R. Fox, D. McRobbie D, M. Bulsara, J. Doust, P. O'Leary, J. Slavotinek, J. Stubbs, R. Moorin, PloS One. (2019) doi: https://doi.org/10.1371/journal.pone.0217816
P.K. Agrawala, J.S. Adhikari, N.K. Chaudhury NK, J Pharm Bioallied Sci. (2010) doi: https://doi.org/10.4103/0975-7406.68501
A. Tulard, F. Hoffschir, F.H. de Boisferon, C. Luccioni, A. Bravard, Free Radic Biol Med. (2003). https://doi.org/10.1016/s0891-5849(03)00243-0
P.G.S. Prasanna, C.J.C. Hamel, N.D. Escalada, K.L. Duffy, W.F. Blakely, Mil. Med. 167, 10 (2002)
R. Kumar, S. Srivastava, Sci Rep. (2016). https://doi.org/10.1038/srep32031
S. Hu, W.F. Blakely, F.A. Cucinotta, Health Phys. (2015). https://doi.org/10.1097/HP.0000000000000295
K. Guogytė, A. Plieskienė, R. Ladygienė, Ž Vaisiūnas, O. Sevriukova, V. Janušonis, J. Žiliukas, Genome Integr. (2017). https://doi.org/10.4103/2041-9414.198907
Y. Suto, T. Gotoh, T. Noda, M. Akiyama, M. Owaki, F. Darroudi F, M. Hirai, Health Phys. (2015) doi: https://doi.org/10.1097/HP.0000000000000182
S. Heydarheydari, A. Haghparast, M.T. Eivazi, J. Biomed. Phys. Eng. 6, 21 (2016)
F.A. Mettler, J Radiol Prot. (2012). https://doi.org/10.1088/0952-4746/32/1/N9
H.B. Stone, C.N. Coleman, M.S. Anscher, W.H. McBride, Lancet Oncol. (2003). https://doi.org/10.1016/s1470-2045(03)01191-4
M.S. Linet, T.L. Slovis, D.L. Miller, R. Kleinerman, C. Lee, P. Rajaraman, A. Berrington de Gonzalez, CA Cancer J Clin. (2012). https://doi.org/10.3322/caac.21132
J. Cao, J. Zhang, Y. Wang, L.Q. Du, C. Xu, Q. Wang, J.X. Liu, X. Su, F.Y. Fan, Q. Liu, S.J. Fan, Int J Mol Sci. (2013). https://doi.org/10.3390/ijms140917525
C. Beinke, M. Port, A. Lamkowski, M. Abend, Radiat Prot Dosimetry. (2016). https://doi.org/10.1093/rpd/ncv286
B. Howe, A. Umrigar, F. Tsien, J Vis Exp. (2014). https://doi.org/10.3791/50203
P. Cramers, P. Atanasova, H. Vrolijk, F. Darroudi, A.A. van Zeeland, R. Huiskamp, L.H.F. Mullenders, J.C.S. Kleinjans, Radiat Res. (2005). https://doi.org/10.1667/rr3430.1
G. Baiocco, S. Barbieri, G. Babini, J. Morini, D. Alloni, W. Friedland, P. Kundrát, E. Schmitt, M. Puchalska, L. Sihver, A. Ottolenghi, Sci Rep. (2016). https://doi.org/10.1038/srep34033
M.M.P. de Lemos Pinto, N.F.G. Santos, A. Amaral, Radiat Environ Biophys. (2010) doi: https://doi.org/10.1007/s00411-010-0311-3
E.G. Neronova, Genome Integr. (2016). https://doi.org/10.4103/2041-9414.197166
I. Corre, C. Niaudet, F. Paris, Mutat Res. (2010). https://doi.org/10.1016/j.mrrev.2010.01.014
S.V. Costes, I. Chiolo, J.M. Pluth, M.H. Barcellos-Hoff, B. Jakob, Mutat Res. (2010). https://doi.org/10.1016/j.mrrev.2009.12.006
E. Gotoh, Methods Mol Biol. (2015). https://doi.org/10.1007/978-1-4939-2474-5_5
S.A. Ghandhi, I. Shuryak, S.R. Morton, S.A. Amundson, D.J. Brenner, Sci Rep. (2019). https://doi.org/10.1038/s41598-019-54967-5
C. Schorl, J.M. Sedivy, Methods (2007). https://doi.org/10.1016/j.ymeth.2006.07.022
T.L. Ryan, A.G. Pantelias, G.I. Terzoudi, G.E. Pantelias, A.S. Balajee, PLoS ONE (2019). https://doi.org/10.1371/journal.pone.0216081
B.R. Jordan, Genetics (2016). https://doi.org/10.1534/genetics.116.191759
M. Tomonaga, JPND. (2019). https://doi.org/10.1080/25751654.2019.1681226
K. Baverstock, D. Williams, Environ Health Perspect. (2006). https://doi.org/10.1289/ehp.9113
A.P. Møller, T.A. Mousseau, Sci Rep. (2015). https://doi.org/10.1038/srep08363
B.N. Porfiriev, Environ Manage. (1996). https://doi.org/10.1007/PL00006699
A. Germon, Rev Etud Comp Est Ouest. (2016). https://doi.org/10.4074/S0338059916003053
E. Burgio, P. Piscitelli, L. Migliore, Int J Environ Res Public Health. (2018) doi: 10.3390
H. Romm, E. Ainsbury, A. Ba**skis, S. Barnard, J.F. Barquinero, L. Barrios, C. Beinke, R. Puig-Casanovas, M. Deperas-Kaminska, E. Gregoire, U. Oestreicher, C. Lindholm, J. Moquet, K. Rothkamm, S. Sommer, H. Thierens, A. Vral, V. Vandersickel, A. Wojcik, Radiat Environ Biophys. (2014). https://doi.org/10.1007/s00411-014-0519-8
J.N. Lucas, Radiat. Res. 148, S33 (1997)
G.K. Livingston, M. Escalona, A. Foster, A.S. Balajee, J Radiat Res. (2018). https://doi.org/10.1093/jrr/rrx049
R.H. Crespo, M.M. Domene, M.J. Rodríguez, Rep Pract Oncol Radiother. (2011). https://doi.org/10.1016/j.rpor.2011.06.003
K.A. Bocskay, M.A. Orjuela, D. Tang, X. Liu, D. Warburton, F.P. Perera, Environ Mol Mutagen. (2007). https://doi.org/10.1002/em.20276
Q. Liu, J. Cao, Z.Q. Wang, Y.S. Bai, Y.M. Lü, Q.L. Huang, W.Z. Zhao, J. Li, L.P. Jiang, W.S. Tang, B.H. Fu, F.Y. Fan, Br J Radiol. (2009). https://doi.org/10.1259/bjr/62484075
M.S. Cho, J.K. Lee, K.S. Bae, E.A. Han, S.J. Jang, W.H. Ha, S.S. Lee, J.F. Barquinero, W.T. Kim, Radiat Res. (2015). https://doi.org/10.1093/jrr/rrv028J
G. Shim, M. Ricoul, W.M. Hempel, E.I. Azzam, L. Sabatier, Mutat Res Rev Mutat Res. (2014) doi: 10.1016
I. Takahashi, R.D. Abbott, T. Ohshita, T. Takahashi, K. Ozasa, M. Akahoshi, S. Fujiwara, K. Kodama, M. Matsumoto, BMJ Open (2012). https://doi.org/10.1136/bmjopen-2011-000654
K. Ozasa, J Radiat Res. (2016). https://doi.org/10.1093/jrr/rrw005
V. Perumal, T.S. Gnana Sekaran, V. Raavi, S.A. Basheerudeen, K. Kanagaraj, A.R. Chowdhury, S.F. Paul, World J Radiol. (2015) doi: https://doi.org/10.4329/wjr.v7.i9.266
B. Shirley, Y. Li, J.H.M. Knoll, P.K. Rogan, J Vis Exp. (2017). https://doi.org/10.3791/56245
E. Tsuchida, A. Kaida, E. Pratama, M.A. Ikeda, K. Suzuki, K. Harada, M. Miura, PLoS ONE (2015). https://doi.org/10.1371/journal.pone.0128090
L. Zhao, D. Wu, D. Mi, Y. Sun, J Radiat Res. (2017). https://doi.org/10.1093/jrr/rrw062
R.C. Wilkins, H. Romm, U. Oestreicher, L. Marro, M.A. Yoshida, Y. Suto, P.G.S. Prasanna, Radiat Meas. (2011). https://doi.org/10.1016/j.radmeas.2011.03.012
P. Seibold, A. Auvinen, D. Averbeck, M. Bourguignon, J.M. Hartikainen, C. Hoeschen, O. Laurent, G. Noël, L. Sabatier, S. Salomaa, M. Blettner, Int J Radiat Biol. (2020). https://doi.org/10.1080/09553002.2019.1665209
A. Wojcik, M. Harms-Ringdahl, Int J Radiat Biol. (2019). https://doi.org/10.1080/09553002.2019.1589027
G. Borrego-Soto, R. Ortiz-López, A. Rojas-Martínez, Genet Mol Biol. (2015). https://doi.org/10.1590/S1415-475738420150019
M. Durante, S.C. Formenti, Front Oncol. (2018). https://doi.org/10.3389/fonc.2018.00192
R.A. Sclafani, T.M. Holzen, Annu Rev Genet. (2007). https://doi.org/10.1146/annurev.genet.41.110306.130308
J.S. Bedford, W.C. Dewey, Radiat Res. (2002) doi: 10.1667
K. Otani, Y. Naito, Y. Sakaguchi, Y. Seo, Y. Takahashi, J. Kikuta, K. Ogawa, M. Ishii, Sci Rep. (2016). https://doi.org/10.1038/srep30689
F. Darroudi, W. Wiegant, M. Meijers, A.A. Friedl, M. van der Burg, J. Fomina, J.J.M. van Dongen, D.C. van Gent, M.Z. Zdzienicka, Mutat Res. (2007). https://doi.org/10.1016/j.mrfmmm.2006.11.029
W.J. Cannan, D.S. Pederson, J Cell Physiol. (2016). https://doi.org/10.1002/jcp.25048
A. Fucic, G. Brunborg, R. Lasan, D. Jezek, L.E. Knudsen, D.F. Merlo, Mutat Res. (2008). https://doi.org/10.1016/j.mrrev.2007.11.003
T.M. Pawlik, K. Keyomarsi, Int J Radiat Oncol Biol Phys. (2004). https://doi.org/10.1016/j.ijrobp.2004.03.005
J.R. Hubenak, Q. Zhang, C.D. Branch, S.J. Kronowitz, Plast Reconstr Surg. (2014). https://doi.org/10.1097/01.prs.0000440818.23647.0b
S.C. Short, C. Martindale, S. Bourne, G. Brand, M. Woodcock, P. Johnston, Neuro Oncol. (2007). https://doi.org/10.1215/15228517-2007-030
S.J. McMahon, J. Schuemann, H. Paganetti, K.M. Prise, Sci Rep. (2016). https://doi.org/10.1038/srep33290
Z. Darzynkiewicz, P. Smolewski, E. Holden, E. Luther, M. Henriksen, M. François, W. Leifert, M. Fenech, Mutagenesis (2011). https://doi.org/10.1093/mutage/geq069
R.C. Wilkins, M.A. Rodrigues, L.A. Beaton-Green, Genome Integr. (2017). https://doi.org/10.4103/2041-9414.198912
W. Hoffmann, I. Schmitz-Feuerhake, J Expo Anal Environ Epidemiol. (1999). https://doi.org/10.1038/sj.jea.7500008
E. Grisan, E. Poletti, A. Ruggeri, IEEE Trans Inf Technol Biomed. (2009). https://doi.org/10.1109/TITB.2009.2014464
P.K. Rogan, Y. Li, A. Wickramasinghe, A. Subasinghe, N. Caminsky, W. Khan, J. Samarabandu, R.C. Wilkins, F.N. Flegal, J.H.M. Knoll, Radiat Prot Dosimetry. (2014). https://doi.org/10.1093/rpd/ncu133
J. Liu, Y. Li, R.C. Wilkins, F.N. Flegal, J.H.M. Knoll, P.K. Rogan, F1000Res. (2017) doi: https://doi.org/10.12688/f1000research.12226.1
X. Shen, Y. Qi, T. Ma, Z. Zhou, Sci Rep. (2019). https://doi.org/10.1038/s41598-019-38614-7
H. Romm, E. Ainsbury, S. Barnard, L. Barrios, J.F. Barquinero, C. Beinke, M. Deperas, E. Gregoire, A. Koivistoinen, C. Lindholm, J. Moquet, U. Oestreicher, R. Puig, K. Rothkamm, S. Sommer, H. Thierens, V. Vandersickel, A. Vral, A. Wojcik, Mutat Res. (2013). https://doi.org/10.1016/j.mrgentox.2013.05.013
N.B. Rizvandi, A. Pižurica, F. Rooms, W. Philips, In 2008 16th European Signal Processing Conference, 1 (2008)
A. Akgül, J Taibah Univ Sci. (2019). https://doi.org/10.1080/16583655.2019.1651988
A. Belle, R. Thiagarajan, S.M. Soroushmehr, F. Navidi, D.A. Beard, K. Najarian, BioMed Res Int. (2015). https://doi.org/10.1155/2015/370194
A. Hosny, C. Parmar, J. Quackenbush, L.H. Schwartz, H. Aerts, Nat Rev Cancer. (2018). https://doi.org/10.1038/s41568-018-0016-5
S. Dash, S.K. Shakyawar, M. Sharma, S. Kaushik, J Big Data. (2019). https://doi.org/10.1186/s40537-019-0217-0
M.I. Razzak, S. Naz, A. Zaib, in Classification in BioApps: Automation of decision making. ed. by N. Dey, A.S. Ashour, S. Borra (Springer, Switzerland, 2018), pp. 323–350
U. Schmidt-Erfurth, A. Sadeghipour, B.S. Gerendas, S.M. Waldstein, H. Bogunović, Prog Retin Eye Res. (2018). https://doi.org/10.1016/j.preteyeres.2018.07.004
A.S. Ahuja, PeerJ (2019). https://doi.org/10.7717/peerj.7702
T. Davenport, R. Kalakota, Future Healthc J. (2019). https://doi.org/10.7861/futurehosp.6-2-94
G. Rong, A. Mendez, E.B. Assi, B. Zhao, M. Sawan M, Engineering. (2020) doi: https://doi.org/10.1016/j.eng.2019.08.015
Funding
Open access funding provided by Università degli Studi di Roma Tor Vergata within the CRUI-CARE Agreement.
Author information
Authors and Affiliations
Corresponding author
Rights and permissions
Open Access This article is licensed under a Creative Commons Attribution 4.0 International License, which permits use, sharing, adaptation, distribution and reproduction in any medium or format, as long as you give appropriate credit to the original author(s) and the source, provide a link to the Creative Commons licence, and indicate if changes were made. The images or other third party material in this article are included in the article's Creative Commons licence, unless indicated otherwise in a credit line to the material. If material is not included in the article's Creative Commons licence and your intended use is not permitted by statutory regulation or exceeds the permitted use, you will need to obtain permission directly from the copyright holder. To view a copy of this licence, visit http://creativecommons.org/licenses/by/4.0/.
About this article

Cite this article
Ludovici, G.M., Cascone, M.G., Huber, T. et al. Cytogenetic bio-dosimetry techniques in the detection of dicentric chromosomes induced by ionizing radiation: A review. Eur. Phys. J. Plus 136, 482 (2021). https://doi.org/10.1140/epjp/s13360-021-01447-3
Received:
Accepted:
Published:
DOI: https://doi.org/10.1140/epjp/s13360-021-01447-3